I. INTRODUCTION
Corrosion has a very important economy impact in the oil and gas industry. Oilfield production environments can range from practically zero corrosion to extremely high rates corrosion. The most predominant form of corrosion encountered in oil and gas production is the one caused by CO2. Dissolved carbon dioxide in the produced brines is very corrosive to carbon and low alloy steel tubular and to process equipment used in this industry. The costs of corrosion control are significant and are mainly related to materials replacement and corrosion control programs. Approximately 60% of oilfield failures are related to CO2 corrosion mainly due to inadequate knowledge/predictive capability and the poor resistance of carbon and low alloy steels to this type of corrosive attack. CO2 can cause not only general corrosion but also localized corrosion, which is a much more serious problem [1, 3].
Pipelines whether buried in the ground, exposed to the atmosphere, or submerged in water, are liable to corrosion. Without proper maintenance, every pipeline system will eventually deteriorate, and a corroded pipe is unsafe as a means of transportation because of the associated failure risks. These failures in pipelines and flow lines lead to shutdown of facilities and platforms. Corrosion results in the deterioration of a metal and weakens its structural integrity as a result of chemical reactions between it and the surrounding environment [2]. Corrosion in pipelines occurs where there is loss of metal from an exposed surface in a corrosive environment. The majority of pipeline failures are caused by localized corrosion, and its mechanism can be induced by flow, metallurgy, deposits, internal stresses, and microbiologically influenced corrosion (MIC) among others. The internal corrosion of carbon steel is a noteworthy problem for the oil and gas industry because of its frequency of occurrence. Although high cost corrosion resistant alloys (CRAs) are often developed to resist internal corrosion, carbon steel is still the most cost effective material used for oil and gas production. Issues of possible corrosive species encountered in the oil and gas industry have been documented in so many literatures. The reports on the significance of CO2 in corrosion of metal have also been reported; and, there seems to be a consensus on the significance of CO2 in corrosion of flow lines [2]. Corrosion control is an ongoing dynamic process; therefore, an effective model for predicting pipeline corrosion is essential. Corrosion models give early caution signs of impending failures; they are developed correlations that relate processes and their corrosive effects on systems which help to diagnose a specific problem and in turn evaluate the effectiveness of any corrosion control measure/prevention technique applied to improve the service life of the target metal [2].
Corrosion has been one of the primary mechanisms causing failures of infrastructure in the oil and gas industry. The corrosion phenomenon can be found in all stages of oil production and transportation and processing. In addition to downhole tubulars, corrosion has been a vital threat to integrity of the above-ground pipelines [4].
II. LITERATURE REVIEW
Aspen HYSYS software for on-site simulation research was used to analyze the corrosion rate in the collection pipeline and to predict CO2 corrosion in the natural gas pipeline system. Different models were employed to estimate the CO2 corrosion such as NORSOK standard M-506, and De Waard model 1991 and 1995. The study's goal was to look at the influence of operating circumstances, inhibitors, pipe characteristics, and flow system on CO2 corrosion. When the working pressure is more than 10 MPa and the solution contains 0.85 kmol/m3 of iron carbonate, raising the operating pressure causes a rise in pH and a drop in CO2 corrosion rate. By comparing the data of simulation with field corrosion rate data, the feasibility of the numerical simulation method was proved [3].
Carbon dioxide corrosion in natural gas collection pipelines was predicted through the use of Aspen HYSYS simulation software and the effect of operating pressure, temperature, pH solution, pipeline length, flow regime, and pipe inclination on the CO2 was examined. The findings showed that raising the operating pressure raises the partial pressure of carbon dioxide and accelerates corrosion. The temperature influences the formation of the protective layer, as the maximum rate of carbon dioxide corrosion is 2.96 mm/year at . As the concentration of dissolved carbon dioxide decreases along the pipeline, so does the corrosion rate. High speed results in effective confusion, preventing the formation of the protective layer and increasing carbon dioxide erosion [5].
The effect of many operational events (temperature, partial pressure of carbon dioxide, flow rate, and acidity) in the erosion of oil and gas lights was studied. A multi-lines slope was used to examine field data from wild oil and gas fields to assess the rate of corrosion dependence on operational transactions. ANOVA, P value test, and multiple regression coefficients were used in statistical analysis of data, while previous experimental results used De Waaard-Milliams models and the De Waaard-LOTZ model to verify exceptional well erosion rates. According to the survey, operational transactions represent about of the deterioration of wells. The expected corrosion models were also compatible with field data and Dideaard-Lotz models [6].
To estimate the rate of carbon steel corrosion, the response surface methodology (RSM) was utilized.
Response surface methodology (RSM), a form of statistical model, has demonstrated a successful way for decreasing the number of runs. The influence of the pH, CO2 pressure and temperature on corrosion rate of carbon steel were considered. The NORSOK corrosion software with the second order model has 98% of coefficient determination. Moreover, the results show that the second-order model was confirmed using experimental data, indicating an excellent correlation [7].
Response surface methodology (RSM) was employed to study, model, and optimize the effect of some operation parameters of crude oil transportation processes, by pipeline, on the corrosion penetration rate (CPR). The parameters pressure, temperature, and pH were studied, and their ranges were determined. The predicted values obtained using the developed model were compared with the actual values calculated using NORSOK M-506 standard software based on the mean absolute error(MAE). The value of the MAE was 0.047467 which indicated that the model was reliable and significant [8].
The influence of many operational parameters (temperature, pressure, shear stress, and pH) were analyzed on the corrosion penetration rate, and optimal values of process parameters were determined. The response surface methodology (RSM) and fuzzy logic (FL) were used to predict the corrosion penetration rate that occurs during the process of transporting crude oil through the pipeline. The optimum values of operating conditions were the temperature is , the pressure is 34.28 Pascal, pH is 5.51 and the shear stress is 1 bar to achieve the lowest CPR of 2.16 mm/year [9].
It is considered that the Aspen HYSYS software can simulate the transportation of oil and gas through pipelines and produce results that are extremely close to reality. Response surface methodology is used for modeling and analysis.
This study aims to simulate crude oil transporting pipelines using the Aspen HYSYS software, afterwards design experiments using (RSM) and applying them through simulation, then using the results to create a model to predict corrosion penetration rate inside the pipeline and identifying the most suitable values for operating conditions.
III. MATERIALS AND METHODS
a) Material
Many elements influence CPR. The influence of the factors temperature, pressure, flow rate, and pH on the corrosion penetration rate was investigated in this study utilizing RSM.
The pipeline considered in this study is according to AGOCO from the Sarir field to Hrayqa oil port in Tobruk, the entire distance of pipeline is , pipeline diameter 34 inch, and mole percent of CO2 was set at for the period between 01/01/2019 and 01/01/2023 for oil pipeline. Table 1 shows the operational parameters and related ranges in the Sarir field over the period.
| No. | Parameters | Notation | Unit | Range | |
| Lower value | Upper value | ||||
| 1 | Temperature (°F) | T | °F | 100 | 130 |
| 2 | Pressure (psig) | P | psig | 360 | 580 |
| 3 | Flow Rate (bbl/day) | FR | bbl/day | 150,000 | 240,000 |
| 4 | pH | pH | - | 5.51 | 5.65 |
b) Method
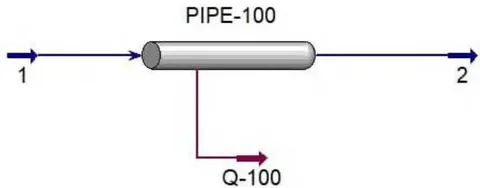
In this work, the variables considered are those most critical to CPR; temperature, pressure, flow rate, and pH. The experimental design was conducted according to the CCD method in Minitab 17 program for four factors and one response. CCD determined total experimental runs of 31 as shown in Table 2. To carry out these experiments, the reality was simulated using Aspen HYSYS V10 by creating a pipeline, filled with the chemical composition of raw oil, and calculating the corrosion penetration rate using the De Waard 1995 method, as shown in Figure 1.
| Run Order | Temperature (°F) | Pressure (psig) | Flow Rate (bbl/day) | pH |
| 1 | 115 | 470 | 240,000 | 5.58 |
| 2 | 115 | 470 | 195,000 | 5.58 |
| 3 | 115 | 360 | 195,000 | 5.58 |
| 4 | 100 | 360 | 240,000 | 5.65 |
| 5 | 115 | 580 | 195,000 | 5.58 |
| 6 | 130 | 360 | 240,000 | 5.65 |
| 7 | 115 | 470 | 195,000 | 5.51 |
| 8 | 130 | 360 | 150,000 | 5.51 |
| 9 | 115 | 470 | 195,000 | 5.58 |
| 10 | 115 | 470 | 195,000 | 5.58 |
| 11 | 100 | 580 | 150,000 | 5.65 |
| 12 | 100 | 360 | 150,000 | 5.51 |
| 13 | 100 | 470 | 195,000 | 5.58 |
| 14 | 100 | 580 | 240,000 | 5.51 |
| 15 | 115 | 470 | 195,000 | 5.58 |
| 16 | 100 | 360 | 150,000 | 5.65 |
| 17 | 130 | 580 | 150,000 | 5.51 |
| 18 | 100 | 580 | 150,000 | 5.51 |
| 19 | 100 | 580 | 240,000 | 5.65 |
| 20 | 130 | 360 | 150,000 | 5.65 |
| 21 | 130 | 580 | 150,000 | 5.65 |
| 22 | 100 | 360 | 240,000 | 5.51 |
| 23 | 115 | 470 | 195,000 | 5.58 |
| 24 | 130 | 470 | 195,000 | 5.58 |
| 25 | 130 | 580 | 240,000 | 5.65 |
| 26 | 115 | 470 | 150,000 | 5.58 |
| 27 | 115 | 470 | 195,000 | 5.58 |
| 28 | 130 | 360 | 240,000 | 5.51 |
| 29 | 130 | 580 | 240,000 | 5.51 |
| 30 | 115 | 470 | 195,000 | 5.58 |
| 31 | 115 | 470 | 195,000 | 5.65 |

IV. DISCUSSION OF RESULTS AND OPTIMIZATION
Minitab worksheet, and after that the predicted values of CPR were calculated as shown in Table 3.
a) Results
The response data were calculated by the Aspen HYSYS model. Then, the data were entered in the
Tables 3: Actual Values by Aspen HYSYS Model and Predicted Values by RSM
| Run Order | Temperature (°F) | Pressure (psig) | Flow Rate (bbl/day) | pH | Actual CPR (mm/year) | Predicted CPR (mm/year) |
| 1 | 115 | 470 | 240,000 | 5.58 | 5.6578 | 5.6555 |
| 2 | 115 | 470 | 195,000 | 5.58 | 5.1139 | 5.1161 |
| 3 | 115 | 360 | 195,000 | 5.58 | 5.0475 | 5.0397 |
| 4 | 100 | 360 | 240,000 | 5.65 | 4.8703 | 4.8502 |
| 5 | 115 | 580 | 195,000 | 5.58 | 5.0855 | 5.0883 |
| 6 | 130 | 360 | 240,000 | 5.65 | 6.0183 | 6.0394 |
| 7 | 115 | 470 | 195,000 | 5.51 | 5.2187 | 5.2129 |
| 8 | 130 | 360 | 150,000 | 5.51 | 4.8189 | 4.8133 |
| 9 | 115 | 470 | 195,000 | 5.58 | 5.1139 | 5.1161 |
| 10 | 115 | 470 | 195,000 | 5.58 | 5.1139 | 5.1161 |
| 11 | 100 | 580 | 150,000 | 5.65 | 4.1568 | 4.1357 |
| 12 | 100 | 360 | 150,000 | 5.51 | 4.1388 | 4.1472 |
| 13 | 100 | 470 | 195,000 | 5.58 | 4.6811 | 4.7307 |
| 14 | 100 | 580 | 240,000 | 5.51 | 5.3160 | 5.3243 |
| 15 | 115 | 470 | 195,000 | 5.58 | 5.1139 | 5.1161 |
| 16 | 100 | 360 | 150,000 | 5.65 | 3.9784 | 3.9871 |
| 17 | 130 | 580 | 150,000 | 5.51 | 4.6784 | 4.6993 |
| 18 | 100 | 580 | 150,000 | 5.51 | 4.3237 | 4.3030 |
| 19 | 100 | 580 | 240,000 | 5.65 | 5.0553 | 5.0613 |
| 20 | 130 | 360 | 150,000 | 5.65 | 4.6749 | 4.6675 |
Table 4 shows the p-values that determine whether the effects are significant or insignificant.
| 21 | 130 | 580 | 150,000 | 5.65 | 4.5270 | 4.5465 |
| 22 | 100 | 360 | 240,000 | 5.51 | 5.1253 | 5.1061 |
| 23 | 115 | 470 | 195,000 | 5.58 | 5.1139 | 5.1161 |
| 24 | 130 | 470 | 195,000 | 5.58 | 5.5782 | 5.5235 |
| 25 | 130 | 580 | 240,000 | 5.65 | 5.9883 | 5.9808 |
| 26 | 115 | 470 | 150,000 | 5.58 | 4.4618 | 4.4590 |
| 27 | 115 | 470 | 195,000 | 5.58 | 5.1139 | 5.1161 |
| 28 | 130 | 360 | 240,000 | 5.51 | 6.2590 | 6.2809 |
| 29 | 130 | 580 | 240,000 | 5.51 | 6.2377 | 6.2294 |
| 30 | 115 | 470 | 195,000 | 5.58 | 5.1139 | 5.1161 |
| 31 | 115 | 470 | 195,000 | 5.65 | 5.0077 | 5.0085 |
| Term | Effect | Coef | SE Coef | p-Value | |
| Constant | 5.11609 | 0.00721 | 0.000 | Significant | |
| Temperature (°F) | 0.79277 | 0.39639 | 0.00573 | 0.000 | Significant |
| Pressure (psig) | 0.04859 | 0.0243 | 0.00573 | 0.001 | Significant |
| Flow Rate (bbl/day) | 1.19657 | 0.59829 | 0.00573 | 0.000 | Significant |
| pH | -0.20439 | -0.10219 | 0.00573 | 0.000 | Significant |
| Temperature (°F)*Temperature (°F) | 0.022 | 0.011 | 0.0151 | 0.476 | Insignificant |
| Pressure (psig)*Pressure (psig) | -0.1042 | -0.0521 | 0.0151 | 0.003 | Significant |
| Flow Rate (bbl/day)*Flow Rate (bbl/day) | -0.1176 | -0.0588 | 0.0151 | 0.001 | Significant |
| pH*pH | -0.0109 | -0.0054 | 0.0151 | 0.724 | Insignificant |
| Temperature (°F) *Pressure (psig) | -0.13484 | -0.06742 | 0.00608 | 0.000 | Significant |
| Temperature (°F) *Flow Rate | 0.25436 | 0.12718 | 0.00608 | 0.000 | Significant |
| Temperature (°F) *pH | 0.00721 | 0.00361 | 0.00608 | 0.561 | Insignificant |
| Pressure (psig)*Flow Rate (bbl/day) | 0.0312 | 0.0156 | 0.00608 | 0.021 | Significant |
| Pressure (psig)*pH | -0.00353 | -0.00177 | 0.00608 | 0.775 | Insignificant |
| Flow Rate (bbl/day)*pH | -0.04789 | -0.02395 | 0.00608 | 0.001 | Significant |
The equation from table of estimated regression coefficients for corrosion penetration rate (mm/year) of the first - second order is given as equation 1:
\begin{array}{l} \mathrm{CPR} = -32.7 - 0.0215\mathrm{T} + 0.00963\mathrm{P} + 0.000044\mathrm{FR} + 12.1\mathrm{pH} + 0.000049\mathrm{T}^{*}\mathrm{T} \\- 0.000004\mathrm{P}^{*}\mathrm{P} - 0.000000\mathrm{FR}^{*}\mathrm{FR} - 1.11\mathrm{pH}^{*}\mathrm{pH} - 0.000041\mathrm{T}^{*}\mathrm{P} + 0.000000\mathrm{T}^{*}\mathrm{FR} \\+ 0.00344\mathrm{T}^{*}\mathrm{pH} + 0.000000\mathrm{P}^{*}\mathrm{FR} - 0.000230\mathrm{P}^{*}\mathrm{pH} - 0.000008\mathrm{FR}^{*}\mathrm{pH} \tag{1} \\end{array}where:
CPR: Corrosion Penetration Rate (mm/year)
T: Temperature
P: Pressure (psig)
FR: Flow Rate (bbl/day) pH: -
Table 4 shows that all p-values associated with each individual model term. The terms are significant when alpha value is .
b) Model Validation
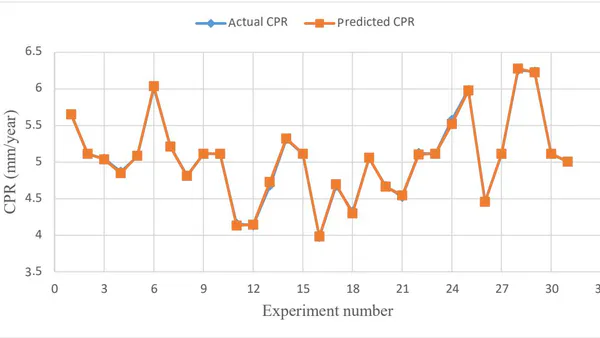
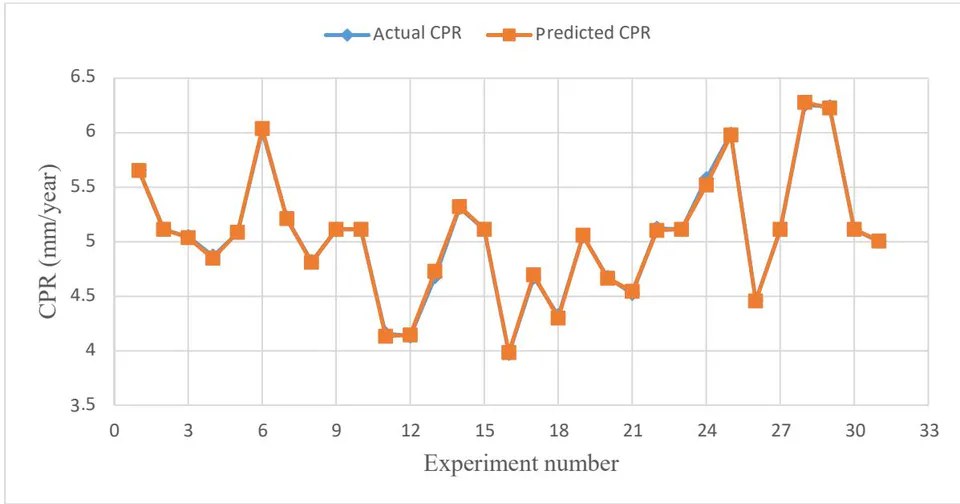
To validate the developed model, the mean absolute percentage error (MAPE) was used to estimate the variation between the actual and predicted CPR. The value of the MAPE is , compared with the actual values of Corrosion Penetration Rate, as plotted in Figure 2. The Nash-Sutcliffe Efficiency (NSE) was calculated for the model by Eq.2. The value of the NSE is 0.999, which indicates that the model is very good.
Where:
- A: Actual value for CPR.
- A: Average actual value for CPR.
- P: Predicted value for CPR.
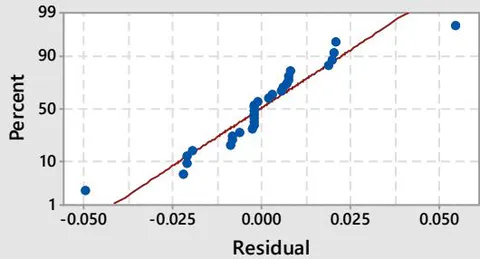
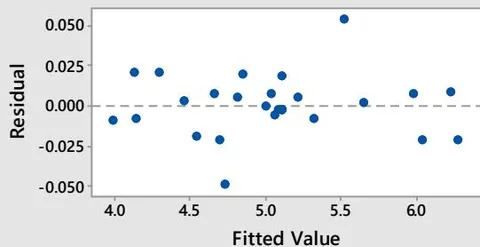
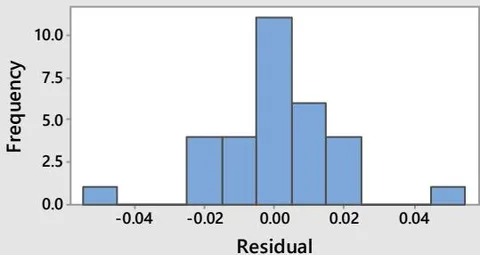
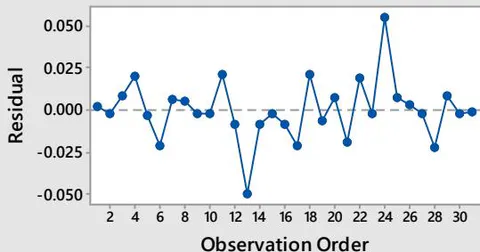
In addition, a probability plot is also used to identify the appropriate distribution. The Normal probability plot has some points that do not lie along the line in the upper and lower region. This may indicate potential outliers in data. Various fits, histograms, and order distributions are shown in Figure 3. It can be seen from the probability plots, that the data are from a normal distribution is the best one since all data fall within the confidence interval.
Residual Plots for CPR
c) Optimization of Corrosion Penetration Rate
As can be indicated from Figure 4, for a simulation model of one year, the minimum corrosion penetration rate conditions were determined as, temperature (100 °F), pressure (360 psig), flow rate (150,000 bbl/day), and pH (5.65). Accordingly, the minimum corrosion penetration rate is 3.98 mm/year.
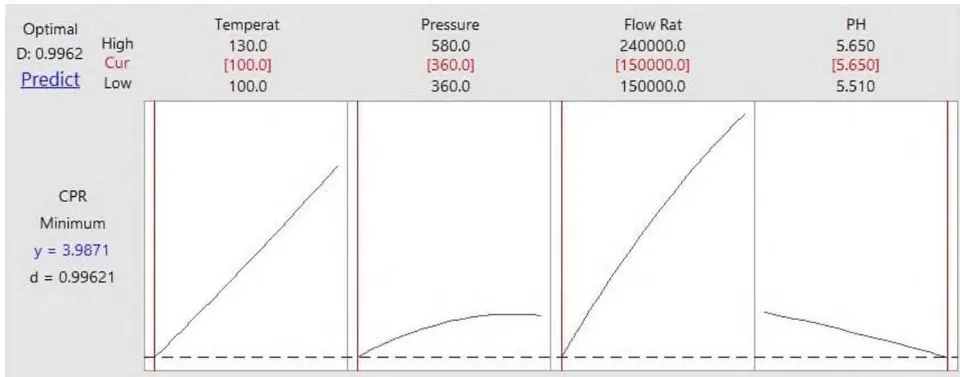
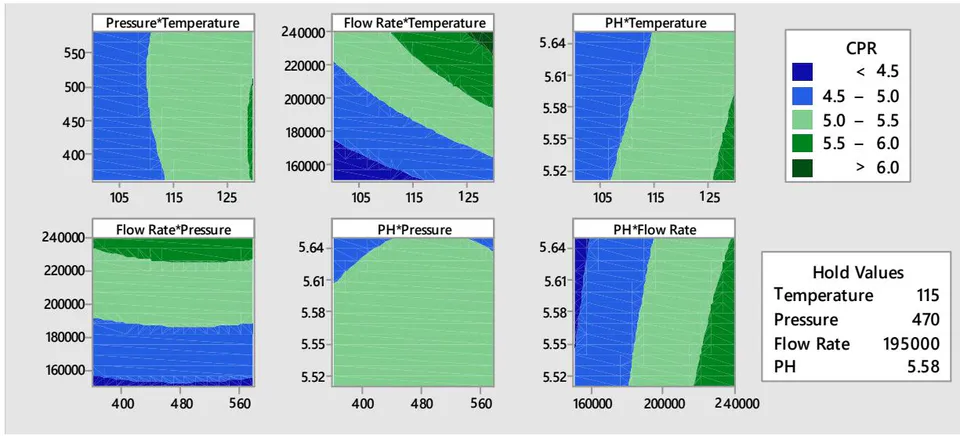
Figure 5 illustrates the contour plots that represent the simultaneous effect of two variables on response, with the other variables fixed to the mean value in the range of factors. As the stronger the effect, the color in the drawing is green, and the weaker the effect, the color is blue. As an illustration, this figure shows a contour plot that represents the simultaneous effect of flow rate and temperature at pressure and on CPR, the larger values of the factors (flow rate 240,000 bbl/day and temperature giving the greater value of the corrosion penetration rate, and the smaller values of the factors (flow rate 150,000 bbl/day and temperature ) giving the lower value of the corrosion penetration rate.
V. CONCLUSIONS
In this study, attempts were made to predict the corrosion penetration rate of the pipelines that are used for transporting crude oil between Sarir-Tobruk stations. The corrosion penetration rate values were determined by using Aspen HYSYS V10 software.
The following points summarize the conclusions of the study:
Based on ANOVA analysis, the four factors considered had significant effects on the corrosion penetration rate, as well as the quadratic effect for pressure and flow rate were significant, while temperature and pH were insignificant. However, the interaction between (temperature and pH), and (pressure and pH) had no significant effect on corrosion penetration rate. Also the interaction between (temperature and pressure), (temperature and flow rate), (pressure and flow rate), and (flow rate and pH) had significant effects.
Based on the comparison between the actual values of corrosion penetration rate calculated by using Aspen HYSYS software and the predicted values of corrosion penetration rate by using the RSM technique, it can be concluded that the RSM model could be used to predict the values of corrosion penetration rate, under the specified parameters ranges, with a mean absolute percentage error of .
The optimal value for the numerically calculated corrosion penetration rate using the RSM model, was found to be 3.98 mm/year, with operating parameters values of temperature (100 °F), pressure (360 psig), flow rate (150,000 bbl/day), and pH (5.65).
ACKNOWLEDGMENTS
The authors would like to thank the engineers at the Arabian Gulf Oil Company's Corrosion Department for giving the data and allowing them to publish the research.
- Mechanical Engineering and Robotics Research, Vol. 8(3), pp 374-379, 2019.
Lahrash, M., "Optimizing Crude Oil in Transportation Pipeline using Response Surface Methodology", M.Sc. Thesis, Eastern Mediterranean University, Turkey, September 2017.
Elrifai, A., R., "Modelling and optimization of corrosion penetration rate (CPR) for crude oil transportation processes by pipeline", M.Sc. Thesis, University of Surface Methodology",