
I. INTRODUCTION
During the development of oil and gas fields, the fluid produced is subjected to several conditions. As they travel from the reservoir, up to the pipelines, and then through surface facilities, the system's pressure, and temperature change (Cosse,
Author 0: Dodageo Integrated Energy Limited, Nigeria. 35 Chief Nwuke Street, Trans Amadi Industrial Layout, Port Harcourt, Nigeria.
Author ¥: The Nigerian Institution of Petroleum Engineers (A Division of The Nigeria Society of Engineers) Lagos State, Nigeria.
1993). Along this process, the fluid composition, oil and gas volumes, and fluid properties such as density and viscosity will also vary.
To study how these volumetric changes will occur, several laboratory experiments are routinely conducted with reservoir oil samples in a PVT cell, reproducing the conditions that the fluids are subjected to during production (Whitson, 1981). The most common PVT test performed to characterize this reservoir fluid is constant composition Expansion. Petroleum (an equivalent term is crude oil) is a complex mixture consisting predominantly of hydrocarbons and containing sulfur, nitrogen, oxygen, and helium as minor constituents. The physical and chemical properties of crude oils vary considerably and depend on the concentration of the various types of hydrocarbons and minor constituents present (Cosse, 1993). Crude oil reservoirs are classified according to initial reservoir pressure into the following categories:
- Under a saturated oil reservoir; in which initial reservoir pressure is greater than the bubble point pressure of reservoir fluid
- Saturated oil reservoir; in which initial reservoir pressure is equal to the bubble point pressure of reservoir fluid
- Gas-cap reservoir; in which initial reservoir pressure is below the bubble point pressure of
A reservoir fluid, so reservoir is termed a gascap or two-phase reservoir since the gas or vapor phase is underlain by an oil phase. Petroleum hydrocarbons exist as gaseous or liquid phases depending on reservoir temperature. If it is higher than the critical temperature of the fluid, the reservoir fluid is gas (Whitson, 1981). Otherwise, the reservoir fluid is oil. The black oil reservoir is considered as one of the most precious reservoir fluids. It constitutes many oil reservoirs and exists in every basin. An accurate description of the physical properties of crude oils is of considerable importance in the fields of both applied and theoretical science and, especially, in the solution of petroleum reservoir engineering problems. Some of these physical properties are of primary interest in petroleum engineering studies and detected through PVT tests which aim to determine reservoir fluid behavior at simulated reservoir conditions. Data on these fluid properties is usually determined by the laboratory (Vasquez and Beggs, 1987).
Experiments were performed on samples of actual reservoir fluids. In the absence For experimentally measured properties of crude oils, it is necessary for the petroleum engineer to determine the properties from empirically derived correlations. However, correlations are approximations and may be useful only in regional geological provinces.
Crude oils cover a wide range of physical properties and chemical compositions and are classified into black oils and near-critical or volatile-oils depending on their phase behavior (Moses, 1986).
The aims and objectives of this research work is to validate PVT parameters in a saturated black oil reservoir using Correlation. This research work will cover basic PVT parameters such as oil formation volume factor , solution gas/oil ratio , oil compressibility factor (Co), Oil viscosity , and liquid/gas ratio of vapour phase (RV) (Tariq et al., 2021).
This research work will not cover the general PVT report as in analysis of constant composition expansion test (CCE).
Oil prospecting is a high-risk business and as such thorough investment decisions must be based on quantifiable and verifiable facts. PVT analysis is a tool that helps bring to the fore the likelihood of recoverable hydrocarbon fluids in a reservoir before proper capital mobilization and infrastructure planning can be made for the reservoir (Hemmati, 2016). The final investment decision is needed for any oil reservoir development to commence but this decision cannot be made if the reservoir has not been economically evaluated and PVT studies offers a good platform to economically evaluate the reservoir (Fattah and Lashin, 2018). According to Standing, (1947) the PVT analysis helps in properly guiding the planning and installation of the production and transportation facilities for any producing reservoir. (Standing, 1947).
PVT studies also acquaint us with the volume of gas that is dissolved in the crude and API gravity of crude oil so that gas facilities and pipelines can be designed for that reservoir. This is because every reservoir is unique, so the uniqueness of each reservoir must be established by using the PVT analysis. PVT studies are highly desirable to properly evaluate crude oil reservoirs (Udegbunam and Owolabi, 1983).
II. MATERIALS AND METHOD
a) Materials
Most of the experiments and measurements in this chapter are carried out using RUSKA instruments (Note: RUSKA is an American Engineering firm that manufactures high precision instrument for measuring reservoir fluid properties). RUSKA research precision instruments when properly calibrated, can measure fluid properties to percent accuracy. The three main parameters measured are pressure, volume, and temperature of the reservoir fluid (Tohidi-Hosseini, 2016).
The RUSKA dead weight gauge or the Heise gauge is used to measure pressure. RUSKA gasometer is used to measure gas volume, RUSKA visual liquid phase PVT cell is used to carry out PVT experiment, pod distillation column is used for low temperature distillation of the reservoir fluid, temperature (Jones and Roselle, 1978). Other equipment and accessories used in the analysis are viscometer, barometer, mercury pumps, gas chromatograph, and low- and high-pressure gauges. The key material for analysis is a "sample" of reservoir fluid, and the different sampling techniques of the reservoir fluid are discussed below. (Fattah and Lashin, A. 2018).
b) Method
- Sampling of Reservoir Fluid
There are basically two ways of collecting oil sample from a reservoir.
i. Direct subsurface sampling, and ii. Surface separator sampling, followed by recombination of oil and gas phases to produce the desired gas/oil ratio. Whichever, technique is used, the same basic problem exist; that is, to ensure that the ratio of gas-to-oil in the composite sample is the same as that existing in the reservoir.
Conditioning a well is a prerequisite in obtaining a representative fluid sample from the well. Well conditioning is the process whereby the well is produced for a sufficient length of time by flowing the well through test separator for about 24 hours or more to bring about stable condition, with an opening (choke size) small enough not to cause appreciable pressure drop in the vicinity of the well bore but large enough to clean out mud filtrate and liquid accumulation in the tubing (Mahdiani and Kooti, 2016). Well conditioning is most critical when the reservoir fluid is saturated (that is, the oil and gas phase co-exist is the reservoir pressure and temperature). A reduction in pressure around the well bore, which occurs as the well is being produced, alters the composition of the fluid before it enters the well bore; the objective of well conditioning is to remove this altered fluid in and around the well bore, by replacing it with a representative or unaltered fluid from the formation.
The following general facts should be noted when obtaining a representative reservoir fluid sample for laboratory studies:
There is no assurance that any sample obtained from one well is representative of the fluid throughout the reservoir.
There composition of the fluid can vary due to gravity segregation in thick pay zones or due to movement of fluid from different formations (fractures, faults) to form the same reservoir with the same structural elevation over geologic times.
Sufficient number of samples should be taken from different wells soon after discovery of the reservoir. This will define the average fluid properties of the reservoir.
Complete analysis of all the samples taken may not be necessary.
- Subsurface or Bottom Hole Sampling
Since there is pressure drop as a result of flowing a well for a considerable period of time (24 hours or more) during well conditioning, it is necessary to shut in the well after conditioning for pressure to build up to the reservoir pressure before taking sample. In most cases, bottom hole sampling is always associated with pressure measurements in the well to estimate the bubble point at various depths, often prior to sampling. If the well has been shut in for a long time and the pressure at the lowest oil level in the well is above estimated bubble point pressure, the well should be flowed at a "bleed" rate to introduce fresh reservoir fluid into the well bore. If the pressure is close to the bubble point pressure, the well should be shut in for sampling. If the estimated bubble-point pressure at the lowest oil level is above the existing pressure at that point, the use of another well must be considered because sample taken from such well will not be representative of the reservoir fluid (Kanu and Ikiensikimama, 2014). If
Sample taken from such well will not be representative of the reservoir fluid. If the well is making any water-cut during production, the well should be shut in and tested for water.
The best place to obtain the sample is the lowest point in the well bore with uniform pressure gradient. To identify this point, a pressure gradient is run just prior to sampling. The oil pressure gauge is lowered to perforation, if possible, to record present bottom hole pressure and temperature. These pressures are translated to pressure gradients and the gradients plotted as a function of depth. Oil gradients vary from 0.2 psilft to 0.38 psi/ft for high gas content to low gas content crude respectively (Mahdiani and Kooti, 2016). The water level is located by plotting pressure gradient against depth. The oil-water contact is at the depth where the gradient changes from one representative of the oil to that of water (water gradient is about 0.4 psi/fl or greater). The sampling point should be picked at about 50 feet above the oil-water contact point if this point is well defined on the plot. If the contact point is not well defined, the sampling point should be picked from the lowest oil level with a defined pressure reading. The sampler shown in Appendix B (Fig. B 1) is prepared and run into the hole (borehole) on wire line to the reservoir depth as shown in Fig. B2, and a sample of the reservoir fluid is collected from the subsurface well stream at the prevailing bottom hole pressure (Mahdiani and Kooti, 2016). Details of the preparation of the sampler and sampling procedure are given below (Reservoir Fluids Laboratory Nigeria Limited).
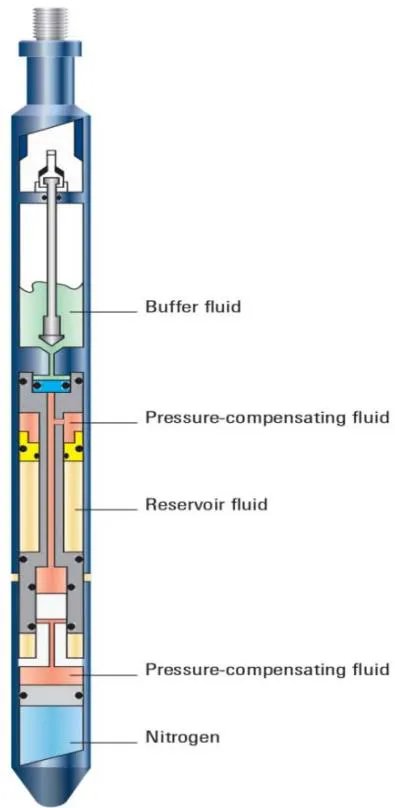
- The Advanced System for all your Subsurface Sampling Applications
The single-phase reservoir sampler (SRS) is a specialized system that maintains the sample in a single-phase condition above reservoir pressure as the tool is retrieved from the hole. This reliable technology provides truly representative samples—which is essential for measurements requiring samples in unaltered conditions, such as pressurized pH measurements in formation water or asphaltene deposition analysis in oil.
Regardless of your sampling application, the SRS enables controlled, uncontaminated reservoir sampling without sample flashing. The unaltered sample is retrieved at the surface in its single-phase state, requiring no recombination before transfer. Eliminating sample recombination at the surface means your sample transfer takes only minutes instead of hours. The mercury-free, pressure-compensating SRS can be run in strings of up to eight tools on slickline, wireline, or electric line, coiled tubing, or sucker pump rods (Hashemi et al., 2020). Each SRS has its clock, giving you complete flexibility in deciding when and at what depth it takes a sample.
- Summary of Bottom Hole Sampling i. Check the operation of the sampler and tools before leaving for the field. ii. Pressure gradient should be run before sampling. iii. Preferably, the well should be shut in while sampling. iv. When sampling with a clock system, leave the sampler in the hole for at least 10 minutes past the set time. v. Make sure two samples from the same point have the same bubble point pressure. vi. Shear-pin method should only be used if there is an uncorrectable failure of clock systems in the field.
- Surface Sampling
Here, separator oil and gas samples are taken separately. The method employed in sampling separator oil is the method of displacement, where the separator oil displaces a mixture of glycol and water in a cylinder (Hashemi et al., 2020). The objective of this method is to obtain a sample of the separator oil with no loss of dissolved gas or contaminating gas. The general procedure for obtaining separator oil and gas samples is as follows:
i. Connect sampling lines (tubing) from the separator gas outlet to a gas cylinder and from the oil outlet to an oil cylinder (the gas cylinder is prepared by vacuuming, while the oil cylinder is prepared by filling the cylinder with a mixture of glycol and water). ii. Open the separator outlet valve to fill the sampling lines. iii. Check for leakages iv. Open the cylinder inlet valve for filling v. Then shut and isolate the cylinder after filling vi. Disconnect the cylinders and lines from the separator
vii. Label the cylinders appropriately.
c) Quality Check
All black oil samples arriving in the laboratory from the field after sampling are kept in a single phase by compressing them to at least 2000psi above reservoir pressure and subjected to quality check before deciding on which sample or set of samples to use for analysis.
Subsurface Samples
All subsurface samples are heated to the temperature condition in the reservoir, and bubble- point pressure is determined in the laboratory and compared to field bubble-point pressure. A portion of the sample is also "flashed" and the liberated gas is run through gas chromatograph to determine any air contamination (Hashemi et al., 2020). (Note: flash in this context means the process of passing a portion of the oil from a condition of higher pressure and temperature to a condition of lower pressure and temperature so as to liberate gas from solution). The sample with the least or no contamination and a representative bubble-point pressure is picked for the study. For bottom hole gas samples, flashing and contamination checks are made to determine the most representative sample.
Surface Sample
Surface samples consist of separator gas and oil. In the case of separator gas, the sample bottles are put into an oven at separator temperature for at least two hours. The opening pressure of each cylinder is checked against the separator pressure and the gas is characterised by passing it through gas chromatograph to obtain its composition up to (heptene plus), and to determine any air contamination. The sample with the least contamination and a pressure equal to the separator pressure is picked for study.
For the separator oil, a portion of the oil sample is transferred to a PVT cell at separator temperature, and the bubble-point pressure is determined (later explained in detail). A portion of the separator oil is later flashed from separator condition to atmospheric condition to determine shrinkage, and the gas from the flash is analysed to obtain the level of air contamination (Foster and Beaumont, 1987).
- Summary of Quality Check on Subsurface and Surface Oil Sample
Bottom hole samples are brought to the laboratory and their bubble-point determined at either room or reservoir temperature. The values are compared with the field data and the most representative sample is chosen. The composition of the sample is determined by low temperature distillation (Foster and Beaumont, 1987).
Surface separator samples are brought to the laboratory after sampling from the field; the separator gas composition is analysed by gas chromatograph. The bubble-point pressures of the duplicate or triplicate samples are determined for the separator oil. These values are compared with the field data of the samples and the most representative sample is chosen and is composition is determined by low temperature distillation. (Udegbunam and Owolabi, 1983).
d) Recombination Calculation
Separator oil and gas samples from the field after passing through the quality-control test in the laboratory have to be recombined to the initial producing gas/oil ratio as follows (Moses, 1986).
Actual pump volume of oil required 3.2 Where
- S = Oil shrinkage factor
- V = Volume of gas in the cell,
- G = Producing gas/oil ratio, SC F/STB
- Producing gas/oil ratio,
- K' = Gas expansion factor
III. LABORATORY EXPERIMENT
a) Constant Mass or Constant Composition Expansion
This experiment is carried out at the reservoir temperature using sample 2 and the results obtained are shown in table 1.
| Pressure (psig) | Relative volume (V/Vsat) | Y-function Psat-P/P((V/Vsat)-1) | Liquid Phase Viscosity (cp) |
| 4500 | 0.9730 | 0.5400 | |
| 4000 | 0.9794 | 0.5200 | |
| 3500 | 0.9851 | 0.5000 | |
| 3000 | 0.9916 | 0.4800 | |
| 2575 | 0.9964 | 0.4630 | |
| 2435 | 1.0000 | 0.4600 | |
| 2000 | 1.0820 | 2.6530 | 0.5000 |
| 1600 | 1.2174 | 2.4000 | 0.5600 |
| 1200 | 1.4796 | 2.1460 | 0.6300 |
| 800 | 2.0796 | 1.8930 | 0.7500 |
| 400 | 4.1021 | 1.6400 | 0.9200 |
| 100 | 17.1034 | 1.4500 | 1.2500 |
| 15 | - | - | 1.3800 |
b) Constant Composition Expansion (CCE)
The CCE experiment also is called the Constant Mass Expansion (CME) or simply a pressure volume (PV) test is performed on black oil.
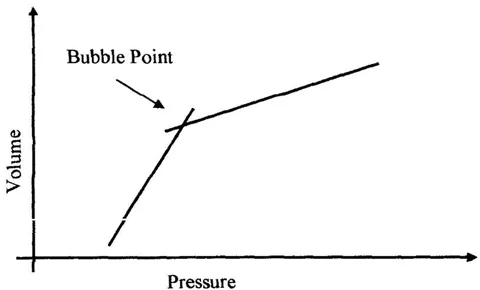
The CCE experiment is used to determine bubble-point pressure, undersaturated oil density, isothermal oil compressibility, and two-phase volumetric behaviour at pressure below the bubble-point pressure at reservoir temperature. A RUSKA visual PVT cell is filled with a known mass of reservoir fluid. The sample is initially brought (compressed) to a condition somewhat above initial reservoir pressure ensuring that the fluid is single-phase. The pressure is then decreased in steps by reducing the mercury level in the cell to attain equilibrium and the corresponding volume of the oil at each step is recorded after sufficient agitation as shown in fig. C2 showing the various steps of the CCE experiment (Foster and Beaumont, 1987). To prevent the phenomenon of super saturation or meta-stable equilibrium where a moisture remains as a single phase even though it is below the bubble-point obtained from the quality check (Standing, 1947). The actual bubble-point pressure is obtained by plotting the recorded cell volume against the corresponding pressure, and the point of intersection of the P-V trends in the single and two-phase regions gives the bubble point pressure and volume as shown in Fig. C3. However, in the visual PVT cell (with a glass window), the bubble-point (corresponding to the first bubble of gas that evolves) could actually be observed.
| Pressure PSIG | Separator gas/oil ratio SCF/STB | Stock tank oil/gas ratio SCF/STB | Total gas/oil ratio SCF/STB | Formation volume factor Bosp | Stock tank oil OAPI | Separator gas gravity γgsp | Stock tank gas gravity |
| 400 | 551 | 232 | 783 | 1.456 | 30 | 0.698 | 1.306 |
| P(PSTg) | TR (OF) | RS | γoAPI | Bofb | γg |
| 400 | 106 | 783 | 0.698 | ||
| 200 | 75 | 759 | 30 | 1.456 | 0.744 |
| 0 | 75 | 919 | 0.808 |
IV. RESULTS AND DISCUSSION
ANALYSIS OF RESULTS/DISCUSSION
a) Corrected Parameters from PVT Report
The following equations are used to validate the correct PVT parameters from a PVT report:
= Solution gas/oil ratio at flash conditions
Solution gas/oil ratio at flash bubble point
Solution gas/oil ratio at differential condition
Oil formation volume factor at flash condition
Oil formation volume factor at different bubble point
Oil formation factor at differential condition
SCF/STB,
at 16000Psi
at 1200Psi
From the solution gas/oil ratio at flash condition is constant. Oil formation volume factor at flash condition
For


\begin{array}{l} \mathrm{B}_{\mathrm{o}}\mathrm{F} = \frac{1.456}{1.460} \times 1.522 \\= 1.518\text{Res BBL/STB} \\end{array}| Pressure (psig) | Formation volume factor (Bod) | Solution gas/oil ratio at diff. (Rsd) | Gas deviation factor (Z) | Solution Gas/Oil ratio (scf/stb) (Rsd) | Liberated Gas/Oil ratio (scf/stb) | Specific Gravity of liberated gas (γg) Air = 1.00 |
| 4500 | 1.482 | 831.0 | 0 | 0 | 0 | 1.478 |
| 4000 | 1.491 | 831.0 | 0 | 0 | 0 | 1.487 |
| 3500 | 1.499 | 831.0 | 0 | 0 | 0 | 1.495 |
| 3000 | 1.509 | 831.0 | 0 | 0 | 0 | 1.505 |
| 2575 | 1.517 | 831.0 | 0 | 0 | 0 | 1.513 |
| 2435 | 1.522 | 831.0 | 0 | 0 | 0 | 1.518 |
| 2000 | 1.460 | 687.0 | 144.0 | 0.695 | 647.3 | 1.456 |
| 1600 | 1.399 | 561.0 | 270.0 | 0.692 | 528.6 | 1.395 |
| 1200 | 1.340 | 442.0 | 419.0 | 0.699 | 416.5 | 1.336 |
| 800 | 1.278 | 331.0 | 500.0 | 0.723 | 311.9 | 1.274 |
| 400 | 1.211 | 214.0 | 617.0 | 0.794 | 201.6 | 1.208 |
| 15 | 1.062 | 0 | 831.0 | 1.936 | 0 | 1.059 |
b) Validation of PVT Parameters using Standing Correlations
(i) Estimation of Bubble Point Pressure
From standing correlations for the reservoir condition
(ii) Validation of Solution Gas/Oil Ratio at Flash Condition Solution Gas/Oil Ratio
(iii) Validation of Oil Isothermal Compressibility at Flash Condition
FOR
(iv) Validation of Oil Formation Volume Factor at Flash Conditions
(v) Validation of Oil Viscosity at Flash Conditions For
For psi
For psi
For

For psi
From
For
For psi
For ,
For
For psi
For
For psi
For psi,
For psi
For psi
Where dead oil viscosity,
3.3 Tables of Value for Complete PVT Report
| P PSIG | Rso SCF/STB | Bo BBL/STB | Co (PSI1) | μo CP |
| 4500 | 1781.5 | 1.041 | 10.12 × 10⁻⁶ | 0.524 |
| 4000 | 1545.9 | 1.041 | 11.39 × 10⁻⁶ | 0.5378 |
| 3500 | 1316.3 | 1.047 | 13.02 × 10⁻⁶ | 0.5604 |
| 3000 | 1093.4 | 1.0514 | 15.19 × 10⁻⁶ | 0.5951 |
| 2575 | 909.7 | 1.057 | 17.7 × 10⁻⁶ | 0.6399 |
| 2420 | 844.2 | 1.0591 | 18.83× 10⁻⁶ | 0.66109 |
| 2000 | 671.03 | 1.0675 | 17.31 × 10⁻⁶ | 0.73767 |
| 1600 | 512.9 | 1.0661 | 26.02 × 10⁻⁵ | 0.8507 |
| 1200 | 362.78 | 1.0645 | 43.98 × 10⁻⁵ | 1.0347 |
| 800 | 222.65 | 1.0630 | 92.18 × 10⁻⁵ | 1.36554 |
| 400 | 96.64 | 1.0617 | 32.66 × 10⁻⁵ | 2.065 |
| 15 | 1.85 | 1.0607 | 13.08 × 10⁻⁵ | 4.1309 × 10¹⁸ |
c) Validating of the PVT Parameters
- (i) The Bubble point pressure
The bubble point pressure has average error of plotted for about 105 data points with the following ranges.
(ii) The solution gas/oil ratio is valid For 20 SCF/STB SCF/STB
The solution ratio is valid with average error of .
- (iii) The oil formation volume factor is valid for the range of RB/STB
- The oil formation volume factor had average error of
- (iv) The oil compressibility value jumps discontinuously from psi above the bubble to psi just below bubble point pressure, because oil is usually much more compressible below the bubble point.
- (v) The oil viscosity had an average absolute error for the standing correlation is in the range
The oil viscosity jumps from 0.737cp at to cp at pressure of 15sig because the oil viscosity is sensitive to pressure charges.
V. DISCUSSION OF RESULT
Crude oil usually contains some dissolved gas when in the reservoir under pressure. As the oil well are drilled and completed and oil begin to flow a time will reach that the gas dissolved in solution in the crude begin to bubble out to form two phase region the pressure at that put is called the bubble point . From the PVT report the usually determine during PVT analysis, the point where the solution gas/oil changes in the analyses. PVT samples most be a representative of the reservoir fluid originally in situ. The PVT report gives a bubble point pressure of 2000 psig while the standing correlation gives a of 1937.371 psi, a difference of 65.7 psi error (Elkatatny and Mahmoud, 2018). The difference is due to the representation of PVT sample. The expansion of the reservoir fluids is a function of the fluid pressure in any particular part of the reservoir, calculations should be made by using different total two phase expansion factor, but to determine the average weighting them by volume to obtained reliable results. The equipment currently used by commercial laboratories in PVT analysis determines volume, with maximum error of less than and temperature within . (Tariq et al., 2021) In many flowing wells, it has been noted that the producing gas/oil ratio is a variable function of the well producing rate, if that is the case no representative sampling procedure is carried out either surface or subsurface even when the representative sample is over duplicated equal GOR can never be obtained. At below
the gas is increasing coming out of solutions as well the free phase expands, but oil is shrinking in volume, the formation volume factor suppose to be unity at standard conditions of 0 psig and , above the understatuated region the formation volume factor increases as the oil compressibility decreases until below the where it decreases as the increases (Egbogah, 1981).
Formation volume factor relate the volume at reservoir condition to the oil volume at stock tank condition and vice versa, therefore it is written Rb/STB the oil compressibility determine how much the oil will expand if the pressure drop by 1 psi, therefore it is in .
Above , the oil compressibility is low and below the oil compressibility is high. First above the , and below i.e. at 1600 psi the and it keeps increasing to the final pressure of 15 psig where it decreased to 13.08 × . That means that the oil compressibility is strongly a function of the reservoir pressure (Curtis and Michael, 2000).
At above the oil viscosity increases with decrease in pressure to the bubble point pressure and below the bubble point pressure the oil viscosity increasing drastically with decrease in pressure from 1.0347cp at 1200 psig to cp at 15 psig oil viscosity is strongly a function of reservoir pressure and reservoir temperature, the reservoir temperature is constant throughout the life of the oil well
(Arabloo et al., 2014). The viscosity of oil measures the resistance of the oil to flow, the higher the viscosity the lower the flow rate and vice versa; therefore the mobility of the oil is inversely proportional to the viscosity at constant temperature. An adjustment in the gravity of the residual oil is not required (Drohm et al., 1998).
VI. CONCLUSIONS
The pressure, volume and temperature (PVT) studies of Black oil reservoir was carried out for the purpose of determining the economic worth of a particular reservoir. This is necessary because, without the PVT studies, the reservoir engineers cannot predict or calculate or calculate or compute the probable hydrocarbon reserves available in the reservoir.
In this research work, we analyzed the black oil samples from the X Field at the Reservoir Fluids Laboratory (RFL) in Port Harcourt, Nigeria using PVT analysis. Basic PVT Parameters for the samples were derived and we validated the report by employing Standing correlations.
The test conducted during the PVT studies is Constant Composition Expansion (CCE) tests and Separator Flash (SF) test with surface and subsurface recombination sample. The analytical test shows that the crude oil is a high viscosity with an average absolute error (AAE) of (i.e. ). Gas began evolving at 2000psig and increased as the pressure decreased. Also, it was noticed that at higher pressure of 4500psig the black oil viscosity was low as 0.54 cp while at a lower pressure of 15psiag the viscosity recorded was 1.38 cp. (Tohidi-Hosseini, et al 2016).
VII. RECOMMENDATIONS
Based on this research work and by opinion the following recommendations can be made for the black oil PVT report analyzed in this research project.
The surface sampling method (surface recombination method) will yield more representative sample of the total fluid regardless of the presence of free gas in the flow string, because when free gas is present in the flow string at the point of subsurface sampling, a representative homogeneous immixture of total fluid will not be found, because when gas appears either static or moving column of oil the bottom home sample will usually be underestimated.
In order to check the quality of the sample, duplicate samples should always be taken if the reservoir contains a greater number of well and it is or has a high structural relief such duplicate samples should be obtained on several wells 4 to 8.
Laboratory result output samples (PVT report) must always be checked against the actual production pressure performance of the reservoir. (Drohm, et al 1988).
A reservoir simulation method should be used to regenerate the require PVT parameters for black oil, gas condensate and other reservoir before the reservoir is put into production.
This project work required the use of standing correlations to validate the basic PVT parameters of a black oil reservoir, other correlations can also be applied such as Vasquez and Beggs, Glaso or Marhran correlations can be used.