I. INTRODUCTION
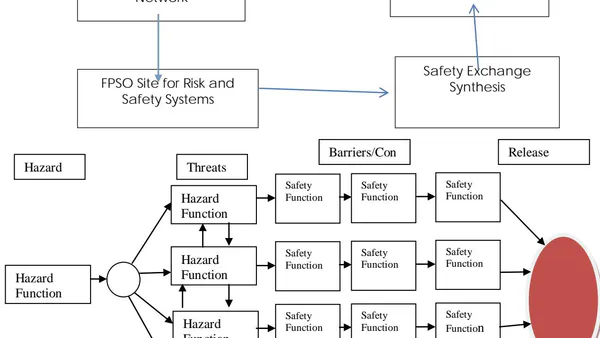
Modern day research work on personnel risk analysis focus on safety of complex production systems to determine equipment, instruments and hazards critical to risk and reliability design (Caoeatal (2010), Suardin et.al (2009), Liuetal, 2004, Abhulimen, 2009, Abhulimen and Susu, 2002). Several risk techniques such as fault tree analysis, bow tie, failure mode effect and critical analysis (FMECA), Layers of protection and safety assessment management techniques are available in technical literature (Yang, JB and Singh, M.G (1994), Khan, F.L and Abassi S.A, 1991, Khan, F.L and Abassi S.A, 1998). Nevertheless, none of these methods address prioritizing equipment and process systems critical to optimizing personnel safety (Caoeatal (2010), Suardin et.al (2009), Liuetal, 2004). The personnel safety analysis framework implemented within any risk model are based on the following criteria 1) Selection of a safety strategy on hazard of different component of the system. 2) Appropriating basis for accessing information on redundant systems not critical to the safety of the process or facility. 3) Allotting measures for the correlation of complexity of risk and safety pair of complimentary hazards and reliability systems to prevent loss in containment. 4) Evaluating performance and effectiveness of safety systems. This paper explores the use of pinch technique to achieve effective planning of personnel safety to minimize threat and optimized crises management on an FPSO operated by a Nigerian Deep water oil and gas operator.
II. RISK ASSESSMENT METHOD USING WEIGHT INDEX
Abhulimen presented a model for analysing safety of series and parallel risk systems which incorporates the weighted safety factors represented below For series systems, risk potential is defined
For Parallel Based Risk Systems
is the risk variable and are the reliability of systems, and are the associated weights to the risk, where risk is defined by eqn. 3
The reliability is obtained by making a subtraction of the risk from 1 to give reliability of the risk component presented in eqn 4.
For parallel risk systems we present hazard function as the algebraic sum presented as eqn.5
For series risk systems we present the hazard function as the product sum of hazard rates of the individual components:
The weight index is given by equation 7:
is a safety factor to different hazard systems, t is the time, is the maximum time for the system to have 66.7% of failure from the weibull classification, and is the hazard shape function.
a) Safety Targeting by Pinch Technique: A new technique based on pinch analysis is presented to model management of safety of personnel resources on complex Floating production and process systems. The method is stated below:
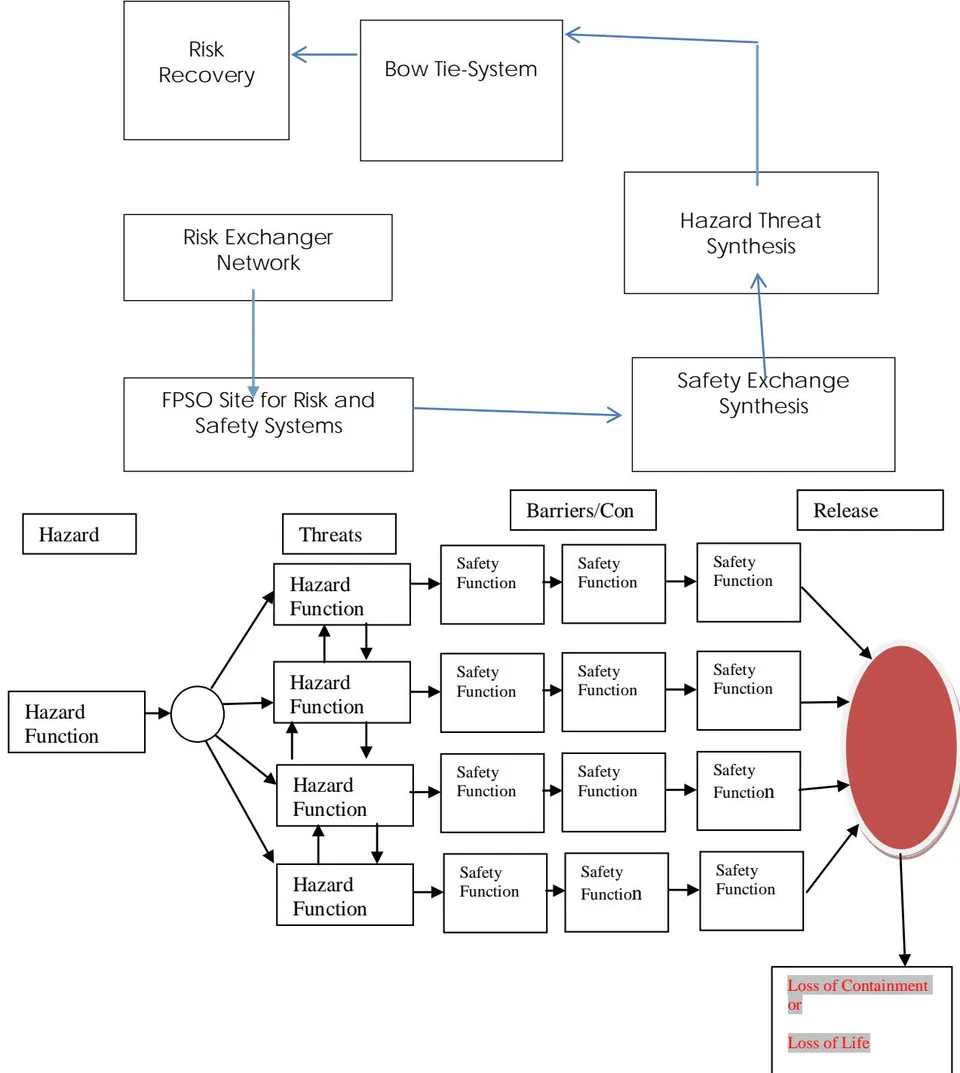
1. Assign three event domains in risk analysis in a typical Bowtie:
Event domain 1: Primary hazards system's generating threat streams:
Event Domain 2: Secondary threat streams from the hazard events Domain:
Event Domain 3: Safety controls strategy to contain threats from releasing containments for credible accident scenarios.
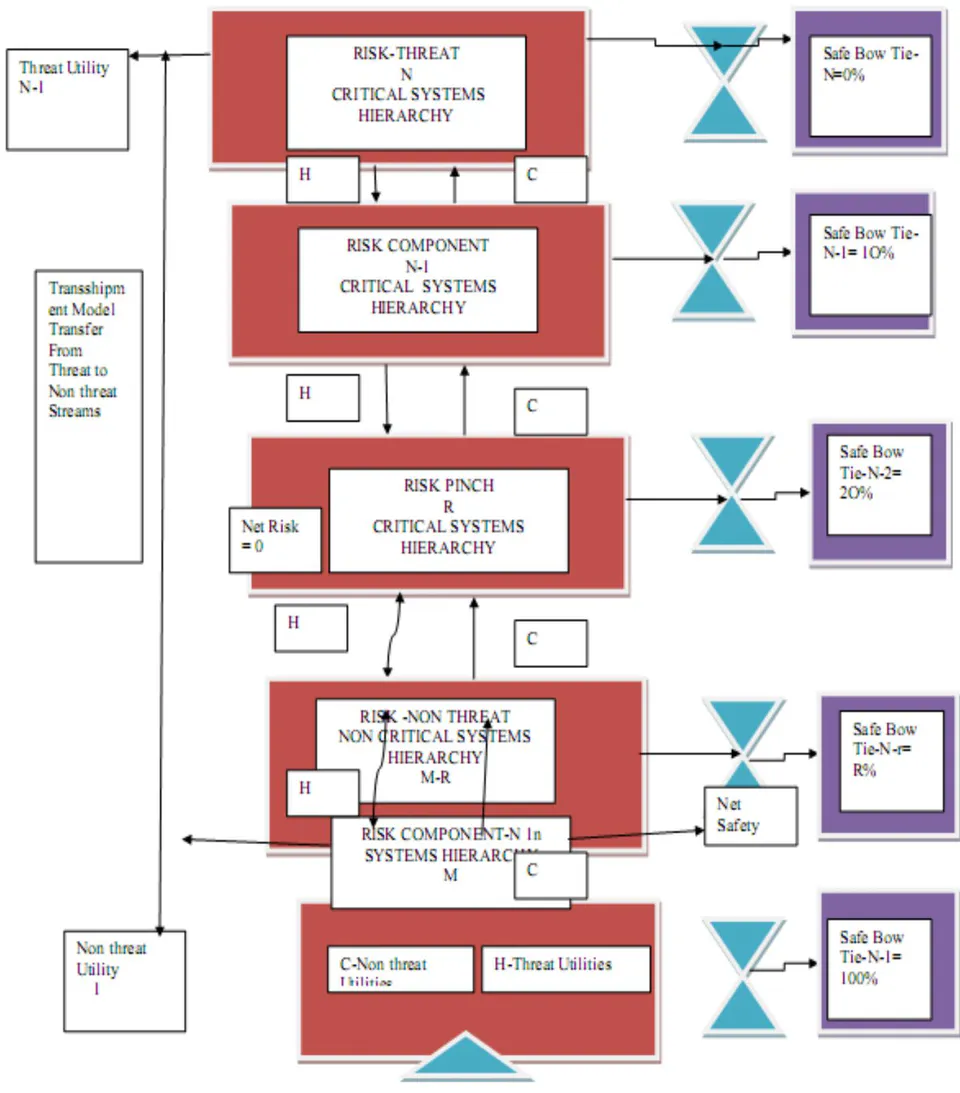
2. Define a transshipment model as in a hierarchy. See Figure 1
Deploy pinch method to resolve personnel safety without compromising the risk and threat domain matrix
The pinch point is located at the point when net risk transfer is zero based on the cascaded design.
Figure 1 is a Bow Tie Transshipment model. is a risk-threat stream and is the risk-non threat streams between and added to the risk-non threat stream and . The safety utilities are used to protect that is:
Therefore, threat in step 5 is transferred across boundaries to reduce its risk-threat load such that, and safety utilities are added as
Step 1 to Step 6 establishes a transshipment model design to achieve risk reductions in complex production risk process which can be determined in two domains- Level 1 and Level 2 below:
i. Level 1
The systems and subsystems in a Bow-Tie are arranged in order of the risk hierarchy with riskier systems located at the top of the transshipment superstructure and less risky systems place at the bottom of the transshipment superstructure and labeled in that order representing the risk-threat utilities and representing the risk-non threat streams with the pinch point located r.
ii. Level 2
A) The e-Learning tableau tracks plant, process hazard or accident history, risk structure in variables, age, and asset integrity in a defining linear programming tableau.
B) The e-Learning database program receives series of instructions to optimize archiving of hazard data and lessons learnt from previous threat events.
C) The e-Learning model analyzes data output by a key factor within a database e-Learning module using a neural network training program.
b) Safety Targeting-Pinch Criteria
Pinch methods assume the following:
1. There are no non threat (safety) utilities/systems above the pinch point
There are no net risk at the pinch point, the net risk is zero
There are threat (threat) utilities/systems below the pinch point.
Transshipment Model of the Bow Tie System H- Threat Stream (Riskiest) C- Non threat Stream (Safest) N -Risk Components- Unprotected 1- Safest System well protected
| Hazard | Linguistic Logic | Numerical Constants | |
| -1 | Very Low (Negligible) | (VL) | |
| 0 | Low | (Lo) | |
| 1 | Reasonably Low | (RLo) | |
| 3 | Average | (A) | |
| 5 | Reasonably Frequent | (RF) | |
| 7 | Highly Frequent | (HF) | |
| 9 | Too Frequent | (TF) | |
| -11 | Worst Case | (WC) | |
CS is the numerical ranking of severity of failure effects. The linguistic terms are: negligible (N), marginal (Ma), moderate (Mo), critical (Cr) and catastrophic (Ca).
The linguistic terms describing consequence can be assigned the following Fuzzy Numeric Constant:
| Hazard Class | Linguistic | Numeric | |
| Zero-Fatality | (Negligible) | (1) | 0 |
| Minor | (Marginal) | (2) | 0-1 |
| Major | (Moderate) | (3) | 2-10 |
| Severe | (Critical) | (4) | 11-50 |
| Fatality | (Minor Catastrophic) | (5) | 51-100 |
| Disaster | (Catastrophic) | (6) | 100+ |
FCP is the probability consequences with linguistic qualifications as remote to occur, very unlikely (U), unlikely (RU), likely (L), very likely (HL) and definite (D). Have Hazard Class F [1, 2, 3, 4, 5] defined has numerical value assigned as:
| Hazard Class | Hazard Rate | Fuzzy Class |
| Definite to | [>10]/yr | (0) |
| Very likely | [>1-10] /yr | (1) |
| Likely | [0.01-1] /yr | (2) |
| Unlikely | [0.0001-0.01] /yr | (3) |
| Very unlikely | [0.000001-0.0001] /yr | (4) |
| Remote | [0.00000001-0.000001] /yr | (5) |
III. APPLICATION ON BOW TIE SYSTEM FOR FPSO
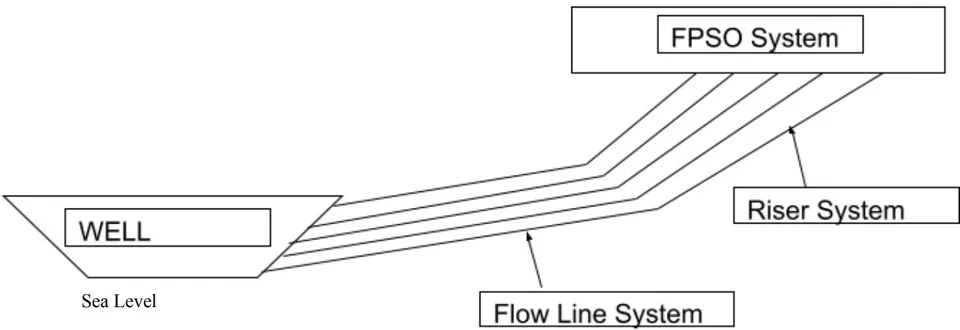
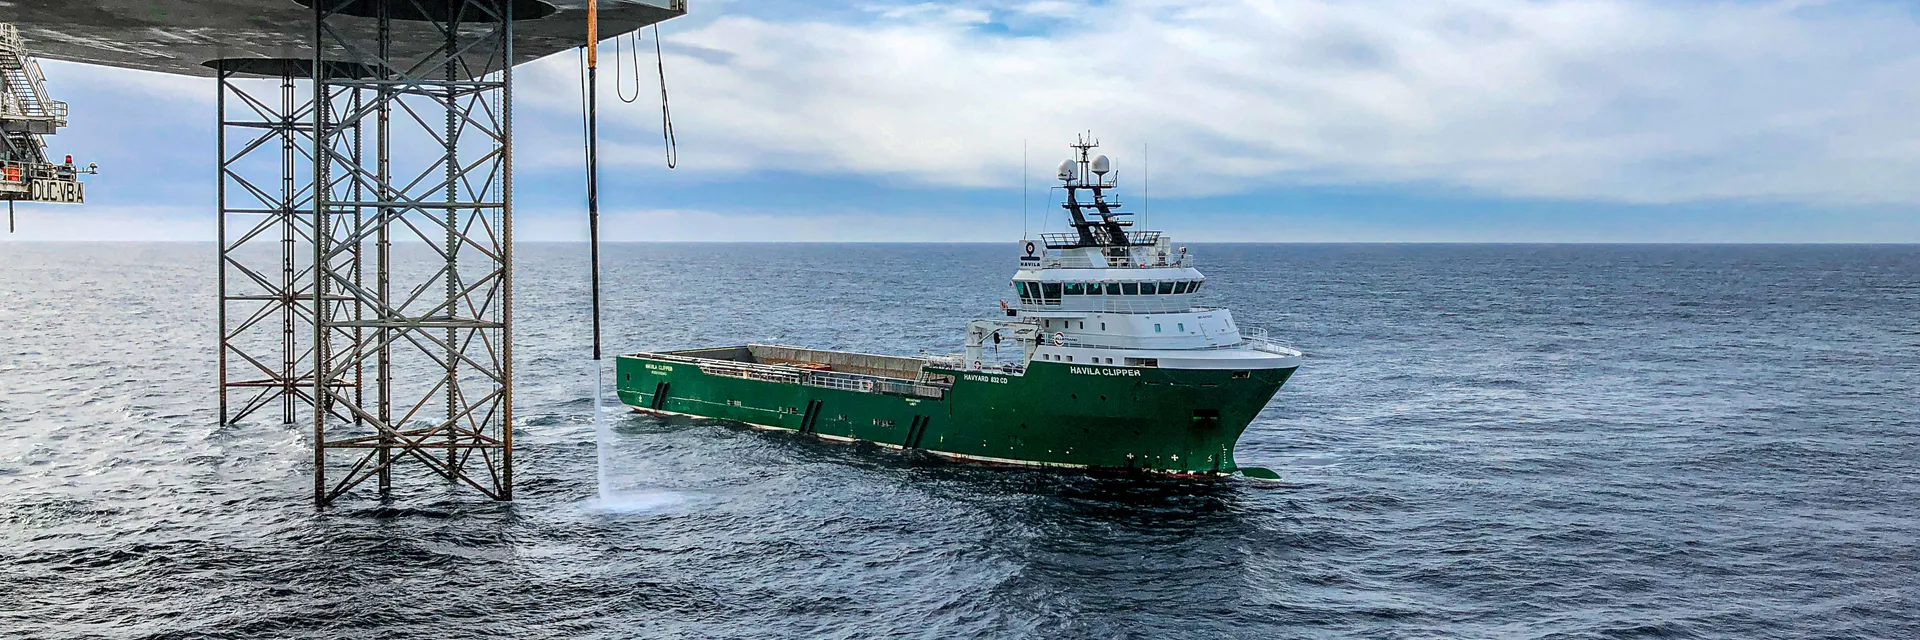
The FPSO above is typically a representative model of one currently operated by Multinational Oil Company in the Nigerian Deep Waters. The major hazards are identified in Figure 3.0 of the Bow Tie System constructed for purpose.
Fatalities
Process Worker on FPSO
5.76x 10 -4 fatalities per year.
-Ship crew worker on FPSO
4.19x 10 -4 fatalities per year.
Accommodation Worker on FPSO
3.70 x 10 -4 fatalities per year.
Process worker on platform
(Overnight on FPSO)
The major accidents leading to loss in containment falls in two classes: 1) Technical and/or operational failure 2) Human and organizational errors such as Man and machine interface, the availability and effectiveness of operational, procedures which directly affects personnel performance (stress, system understanding, tiredness, etc.). Technical and operational failures are products of designs, age, operations, process and environmental failure factors. Human and Organizational Factors (HOF) is based on general industry practices which have the following elements: People, equipment (e.g. hardware), management systems, culture and environment. Equipment, people and management systems are shown as elements within the framework created by culture and environment. Examples of management systems include procedures, communication, training, management of change, risk assessment. Repair or Safety measures considered for FPSO, off-loading to shuttle tanker, supply and cargo vessels.
IV. COMPUTATIONAL ANALYSIS: PINCH TO CONSTRUCT PROBLEM TABLE
The Problem Table, Grand Risk Composite Curves, Safety Targets and the Transshipment Model. The HAZARD data associated with the FPSO is computed from an Excel Programming provided in Table 1.0
a) Design of the Risk Minimization Problem
The basic principles of the pinch method [6] below represents further illustration and its application to risk minimization and safety targeting.
b) Synthesis, Modelling and Design
The Bow Tie diagram of operating FPSO is shown in Figure 1. A feasible design is to analyze the components separately. Nevertheless, we have only presented analysis for the RENS (Risk Exchanger Network Synthesis) and STNS (Safety target network synthesis) of Bowtie system of an operating FPSO.
For the RENS problem, the following data are required (7)
A set of risk-threat streams to be cooled and a set of risk-non threat process streams to be heated.
- The hazard rates and the risk and safety targets of all process streams
The safety weight capacities of each of risk streams versus their hazard rates as they pass through the heat exchange process.
The available safety utilities, and index of performance in risk reduction and their costs per unit of heat provided or removed.
For the STNS problem, the following data are required
A set of risk process streams generated and a set of risk targets streams
The hazard rates and their risk status and risk targets
The risk critical systems and risk non critical systems.
◆ Available end pipe treatment facility, their efficiency and cost per unit waste generated.
c) Analysis of the Problem Table FOR Safety targets at 0% to 100%
The objective of the risk management problem is to minimize threats to personnel by applying a safety targeting technique. A typical Bowtie system contains a hazard stream of several threat levels and safety controls required to contain release to the environment. For our analysis, we have two kinds of stream, the risk threat and risk non threat streams. Therefore, the RENS problem for the bow TIE for risk threat and risk non threat streams. The minimized risk simulated for the personnel on FPSO set safety targets are T1 (0%). T2 (10%). T3 (50%) T4 (80%). T5 (90%) from a normal operating target . Change in risk reduction is by altering the operating variables, such that we can achieve 10%, 50%, 80% and 90% risk targets an extended table shown in Table 2, Table 3, and Table 4 can be developed. The target interval is subdivided into sub intervals with a minimum min =0.1.
d) Hazard/Risk/Safety Targeting/Problem Table
The risk management problem table was derived by setting the non threat streams and the threat streams as follows:
THREAT STREAM
| Hazard Class | Hazard Rate | Hazard Class |
| Definite to | [>10]/yr | FCP (0) |
| Very likely | [>1-10] /yr | FCP (1) |
| Likely | [0.01-1] /yr | FCP (2) |
NON THREAT STREAMS
The pinch for safety status for process worker on an FPSO in Table 2 to be γT1 (0.553733), γT2 (0.49836), γT3 (0.276867), γT1 (0.110747), and γT2 (0.055373), for 100%, 90%, 50%, 20%, and 10% safety targets respectively. As the safety targets is increased, the pinch point moves through a maximum. Minimum risk reduction stipulates that any streams above the pinch point represent the risk source, while any stream below the pinch represents risk sinks. As the pinch point, moves upward or as more of risk is reduced, the desired risk target objective. This is represented mathematically as Jacobean. As shown below there are four stream and the safety targets weights are:
RH= Risk Threat
RC= Risk Non threat
There are threat risk streams and two non threat risk streams. The hazards on the process worker on the FPSO Platform were considered for threat risk and hazards on the ship crew and accommodation worker is considered non threat streams
Risk-Safety and Hazard Stream Interval Table
The pinch analysis concept maximize the risk reduction between risk threat and risk non threat streams: There are four hazard classifications
The evaluation of available risk status for any interval can be given by the formula
Where
Rmin is the minimum risk problem that needs to be targeted in our case, the risk on the process worker, accommodation and crew work. R and S are the design risk, and design safety respectively. Rmin minimum risk status respectively. and are the risk and safety interval respectively. The available risk or safety is evaluated as the total risk or safety available within a design interval. Hence, in table 2 for The pinch point for safety status for process worker on an FPSO in Table 2 to be γT1 (0.553733), γT2 (0.49836), γT3 (0.276867), γT1 (0.110747), and γT2 (0.055373), for 10%, 20%, 50%, 80%, 90%.
The Risk Transshipment at any point in Time is given for 100% to 90% safety target interval for a Process Worker on an FPSO
The pinch analysis concept requires maximizing the risk reduction between risk threat and risk non threat streams.
V. RESULTS AND DISCUSSIONS
a) Hazard weight data correlation table
Table 1.0 is a typical safety target table for assessing the complex multifunctional risk systems. The system linguistic class of component uses a weight index to measure multifunctionality and safety systems implemented. The risk index to quantify the levels of threats and the belief index to quantify an expert assignment of the certainty of risk in that systems. These qualifications and quantifications are important to classify the risk.
| Hazard Class Log in No. | Weight index | Safety Index | Hazard Rate | Risk Index | Risk Target |
| j1 | |||||
| j2 | |||||
| j3 | |||||
| j4 | |||||
| j5 | |||||
| j6 | |||||
| j7 |
Table 2.0, Table3.0 and Table 4.0 which are the weight index data for hazard class of type 1, type2 and type 3 respectively has a classification of very likely to occur; for different safety fraction; for different hazard shape constant. We determine that the increase in numerical qualification of safety is significantly related to weight index as measure of such for specific hazard class and hazard shape function.
| Hazard Class 1 | Weights Associated With Each Safety Fraction And Hazard Shape Function Constant | Max Safety | ||||||||||
| Safety Index | ||||||||||||
| 0 | 0.1 | 0.2 | 0.3 | 0.4 | 0.5 | 0.6 | 0.7 | 0.8 | 0.9 | 1 | 0.9 | |
| Hazard Shape | ||||||||||||
| 0.1 | 0.20487 | 0.1843847 | 0.163898 | 0.1434103 | 0.12229 | 0.102436 | 0.0819487 | 0.061462 | 0.0409744 | 0.0204872 | 0 | 0.02049 |
| 0.2 | 0.157793 | 0.1420135 | 0.126234 | 0.110455 | 0.09468 | 0.078896 | 0.063117 | 0.047338 | 0.0315586 | 0.0157793 | 0 | 0.01578 |
| 0.4 | 0.18720901 | 0.1684881 | 0.149767 | 0.1310463 | 0.11233 | 0.093605 | 0.0748836 | 0.056163 | 0.0374418 | 0.0187209 | 0 | 0.01872 |
| 0.6 | 0.296145 | 0.266531 | 0.236916 | 0.207302 | 0.17769 | 0.148073 | 0.118458 | 0.088844 | 0.059229 | 0.029615 | 0 | 0.02962 |
| 0.8 | 0.527031 | 0.474328 | 0.421624 | 0.368921 | 0.31622 | 0.263515 | 0.210812 | 0.158109 | 0.105406 | 0.052703 | 0 | 0.0527 |
| 1 | 1.00045 | 0.900405 | 0.80036 | 0.700315 | 0.60027 | 0.500225 | 0.40018 | 0.300135 | 0.20009 | 0.100045 | 0 | 0.10005 |
| 1.2 | 1.978261 | 1.780435 | 1.582609 | 1.384783 | 1.18696 | 0.989131 | 0.791305 | 0.593478 | 0.395652 | 0.197826 | 0 | 0.19783 |
| 1.4 | 4.023522 | 3.62117 | 3.218818 | 2.816466 | 2.41411 | 2.011761 | 1.609409 | 1.207057 | 0.804704 | 0.402352 | 0 | 0.40235 |
| 1.6 | 8.353799 | 7.518419 | 6.683039 | 5.847659 | 5.01228 | 4.17 | 3.34152 | 2.50614 | 1.67076 | 0.83538 | 0 | 0.83538 |
| 1.8 | 17.6198 | 15.857823 | 14.09584 | 12.333862 | 10.5719 | 8.809901 | 7.0479212 | 5.285941 | 3.5239606 | 1.7619803 | 0 | 1.76198 |
| 2 | 37.62817 | 33.86535 | 30.10254 | 26.339719 | 22.5769 | 18.8141 | 15.051268 | 11.28845 | 7.525634 | 3.762817 | 0 | 3.76282 |
| Hazard Class 2= Likely to occur | Weight Index associated with each safety index | ||||
| 0.553484076 | Safety index | ||||
| Hazard Shape index | Safety index=0 | Safety index=0.1 | Safety index=0.5 | Safety index=0.8 | Safety index=0.9 |
| 0 | |||||
| 0.1 | 0.82422 | 0.741798 | 0.41211 | 0.164844 | 0.082422 |
| 0.2 | 0.50925 | 0.458325 | 0.254625 | 0.10185 | 0.050925 |
| 0.4 | 0.388808 | 0.349928 | 0.194404 | 0.077762 | 0.038881 |
| 0.6 | 0.395803 | 0.356223 | 0.197902 | 0.079161 | 0.03958 |
| 0.8 | 0.4532894 | 0.4079605 | 0.226644712 | 0.090657885 | 0.045328942 |
| 1 | 0.553733 | 0.49836 | 0.276867 | 0.110747 | 0.055373 |
| 1.2 | 0.704619 | 0.634157 | 0.352309 | 0.140924 | 0.070462 |
| 1.4 | 0.922237 | 0.830013 | 0.461118 | 0.184447 | 0.092224 |
| 1.6 | 1.232212 | 1.108991 | 0.616106 | 0.246442 | 0.123221 |
| 1.8 | 1.672506 | 1.505256 | 0.836253 | 0.334501 | 0.167251 |
| 2 | 2.298504 | 2.068653 | 1.149252 | 0.459701 | 0.22985 |
| Hazard Class 4= Very Unlikely to Occur | Weight Index Associated with Each Safety Fraction | ||||
| 5.03E-05 | Safety Index | ||||
| Hazard Shape Index | Safety index=0 | Safety index=0.1 | Safety index=0.5 | Safety index=0.8 | Safety index=0.9 |
| 0.1 | 3.25E-01 | 2.93E-01 | 1.63E-01 | 6.50E-02 | 3.25E-02 |
| 0.2 | 7.92E-02 | 7.13E-02 | 3.96E-02 | 1.58E-02 | 7.92E-03 |
| 0.4 | 9.40E-03 | 8.46E-03 | 4.70E-03 | 1.88E-03 | 9.40E-04 |
| 0.6 | 1.49E-03 | 1.34E-03 | 7.44E-04 | 2.98E-04 | 1.49E-04 |
| 0.8 | 2.65E-04 | 2.39E-04 | 1.33E-04 | 5.30E-05 | 2.65E-05 |
| 1 | 5.04E-05 | 4.53E-05 | 2.52E-05 | 1.01E-05 | 5.04E-06 |
| 1.2 | 9.97E-06 | 8.97E-06 | 4.98E-06 | 1.99E-06 | 9.97E-07 |
| 1.4 | 2.03E-06 | 1.83E-06 | 1.01E-06 | 4.06E-07 | 2.03E-07 |
| 1.6 | 4.22E-07 | 3.79E-07 | 2.11E-07 | 8.43E-08 | 4.22E-08 |
| 1.8 | 8.90E-08 | 8.01E-08 | 4.45E-08 | 1.78E-08 | 8.90E-09 |
| 2 | 1.90E-08 | 1.71E-08 | 9.51E-09 | 3.80E-09 | 1.90E-09 |
b) Analysis of the Problem Table for Safety targets at 0% to 100%
The objective of this study is to minimize the risk to personnel worker on an FPSO platform through a risk targeting technique employing pinch as shown in Table1.
| Typical Data | FPSO Based Production Facility Case study | ||||
| Analysis | Process Worker (PF) on Platform | Process Worker (FP) | Ship Crew Worker (FP) | Accommodation on Worker (FP) | |
| Hazard Class | Very Likely | Likely | Unlikely | Very Unlikely | |
| Hazard Stream | Risk-Threat | Risk-Threat | Risk-Non threat | Risk-Non threat | |
| Hazard Class No | J=1 | J=2 | J=3 | J=4 | |
Table 5.0 is a table of the risk problem, determined as how impact of risk on personnel worker on FPSO can be reduced on minimized. A Bowtie systems contain a hazard stream, which produces several threat streams and safety controls to prevent release on containment. For our analysis, we have two kinds of stream, the risk threat and risk non threat streams. The risk, safety targets, risk targets or risk reduction of a FPSO, ship crew, accommodation worker and process worker on a platform. So, the RENS problem for the bow TIE can be formulated into risk threat and risk non threat. The objective is to minimize the risk on the personnel on FPSO. These can be achieved by setting out safety targets γT1 (0%). γT2 (10%). γT3 (50%) γT4 (80%). γT5 (90%) from a normal operating target. Assuming also it is possible to change risk reduction by altering the operating variables, such that we can achieve 10%, 50%, 80% and 90% risk targets an extended table shown in Table 2,
Table 3, and Table 4 can be developed. The target interval is subdivided into sub intervals with a minimum . The pinch technique was applied to analyze risk to the personnel on FPSO. The pinch point for safety status for process worker on an FPSO in Table 2 was computed to be (0.553733), (0.49836), (0.276867), (0.110747), and (0.055373), for 100%, 90%, 50%, 20%, and 10% safety targeting respectively. The design targets increases, the pinch point moves through a maximum. Minimum reduction, any streams above the pinch point represents the waste source, while any stream below the pinch represents risk sinks. The pinch point moves upward until desired risk target is achieved. The design that achieve minimize risk from the BOWTIE unit is realized when the Jacobean of the pinch point with respect to operating variable hazard rates favors movement such that maximum risk event occurs.
| Hazard Classifications (fatalities/yr) | Stream Type | Safety | Safety | Safety | Safety | Hazard Rate Minimum | Risk Status | Risk Target 50% | Risk Reduction 50% | |
| Target | Target | Weight Load Minimum | SHIFTED | SHIFTED | ||||||
| 0% | 50% | 0% | 50% | |||||||
| Very Likely | Risk-Threat | 1.00045 | 0.500225 | 0.100045 | 0.900405 | 0.40018 | 1 | 0.99591323 | 0.936151201 | 0.059762028 |
| [>1-10]/yr | ||||||||||
| Likely | Risk-Threat | 0.553733 | 0.276867 | 0.055373 | 0.49836 | 0.221494 | 0.01 | 0.42305019 | 0.141249497 | 0.281800692 |
| [0.01-1]/yr | ||||||||||
| Unlikely | Risk-Non threat | 0.005004 | 0.002502 | 0.0005 | 0.004504 | 0.002002 | 0.0001 | 0.00503727 | 1.2635E-05 | - 0.005024635 |
| [0.0001-0.01]/yr | ||||||||||
| Very Unlikely | Risk-Non threat | 5.04 E-05 | 2.52E-05 | 0.00000504 | 0.00004536 | 2.02E-05 | 0.0000001 | 5.0499E-05 | 1.2726E-08 | -5.05E-05 |
| [0.000001-0.0001]/yr |
Table 7.0 is the risk extended problem table. The table shows the minimum safety target (0%) which can be increase to a safety target of 50%. The hazard rate minimum for the process worker on the platform, process worker on FPSO, ship crew and accommodation is 1, 0.01, 0.001, and 0.0000001 fatalities per year based on the hazard classification very likely, likely, unlikely, very unlikely. This is a reduction in risk target as the safety target is increased from 0% to 50%.
The pinch analysis concept allows us to maximize the risk reduction between risk threat and risk non threat streams: There are four hazard classifications
Risk to Process Worker on FPSO 0% safety target
Non threat Stream
Non threat Sink Safety target
Non threat Sink 50% safety target
Risk to Accommodation Worker
Non threat Stream
Risk to Ship Crew on FPSO: 50% safety target
Figure 4: Diagram Design Interval
The risk to the accommodation worker and ship crew are 1.2726E-08 and 1.263E-05 respectively. The level of critical safety systems deployed on these personnel is small and could be referred in our model as non threat sink. The process worker that is exposed to more critical risk is referred as the threat sink on the
FPSO and targets is to reduce the threats from 0.996 and 0.4234 by deploying resources allocated to non threats sink (accommodation and ship crew) to the threat sink (process worker) to minimize the risk and threat levels on these personnel.
| Extended Table Problem | |||||||
| Hazard Classifications (fatalities/yr) | Stream Type | Hazard Rate Minimum | Risk Status | Risk Target 50% | Risk Reduction 50% | ||
| PINCH | Cascade | ||||||
| DESIGN INTERVAL | |||||||
| Very Likely | Risk-Threat J=1 | 1 | 0.99591323 | 0.936151201 | 0.059762028 | 0 | 0.054737393 |
| [>1-10]/yr | |||||||
| Likely | Risk-Threat J=2 | 0.01 | 0.42305019 | 0.141249497 | 0.281800692 | 1 | 0.276776057 |
| [0.01-1]/yr | |||||||
| Unlikely | Risk-Non threat J=3 | 0.0001 | 0.00503727 | 1.2635E-05 | -0.005024635 | (PINCH PT) 2 | 0 |
| [0.0001-0.01]/yr | |||||||
| Very Unlikely | Risk-Non threat J=4 | 0.0000 001 | 5.0499E-05 | 1.2726E-08 | -5.05E-05 | 3 | 0.004974135 |
| [0.000001-0.0001]/yr | |||||||
For the risk target is 50% and 0%, the pinch point is located at interval 2. The risk threat streams are required to cool and the safety sinks is increased, and non threat streams require heat by non critical risk.
There is a risk reduction above the pinch and a reversal below the pinch. The pinch is located for the ship crew that is classified as non threat stream.
| Hazard Classifications (fatalities/yr) | Stream Type | Risk Reduction 100% | Risk Reduction 90% | Risk Reduction 50% | Risk Reduction 20% | Risk Reduction 10% | |
| Threat To: Risk System | |||||||
| Process Worker on FPSO | Likely [0.01-1]/yr | Risk-Threat | 0.16050302 | 0.18330776 | 0.281800692 | 0.36395731 | 0.3930541 |
| Ship Crew Worker | Unlikely [0.0001-0.01]/yr | Risk-Non threat | 0.00501182 | 0.00501453 | 0.005024635 | 0.00503222 | 0.0050347 |
| Accomodation Worker | Very Unlikely [0.000001_0.0001]/yr | Risk-Non threat | 5.0473E-05 | 5.0476E-05 | 5.0486E-05 | 5.0494E-05 | 5.05E-05 |
| Process Worker on Platform | Very Likely [>1-10]/yr | Risk-Threat | 0 | 0.00298088 | 0.059762028 | 0.32861958 | 0.5727203 |
c) Risk Reduction Curve/Risk Status with Safety Targets The safety composite graphs are shown in Figure 4 and Figure 5. Risk target and risk reduction are below the design risk status for the personnel work showing a reduction in risk as the safety sink increases.
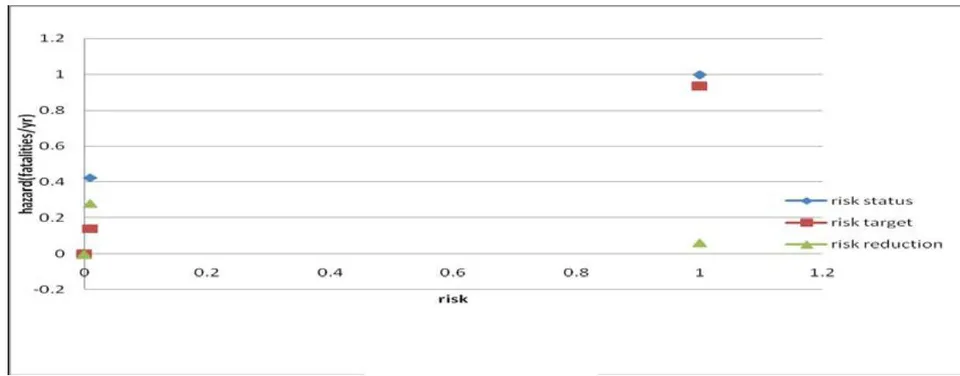
Figure 5.0 show a progressive reduction below the 0% safety classification that is for 10%, 50%, 80%, 90% target, shows a risk target below the design safety for personnel on the platform.
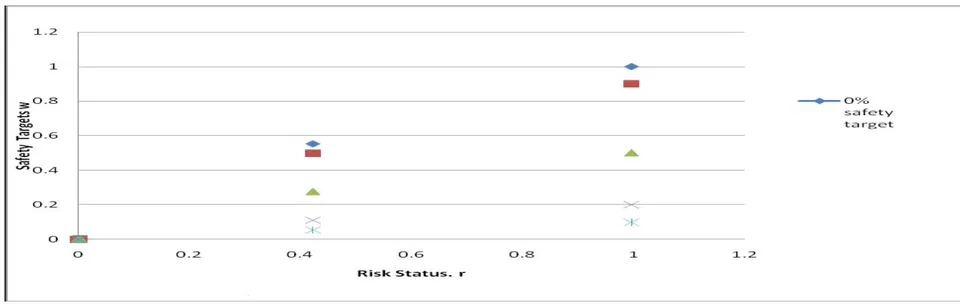
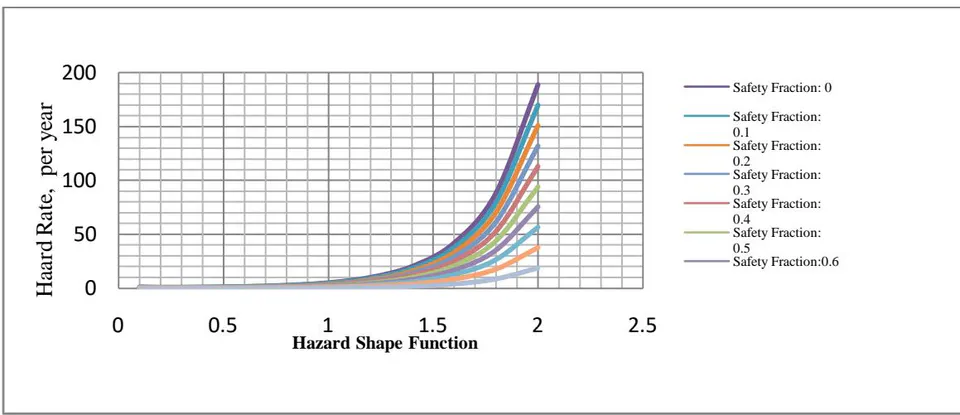
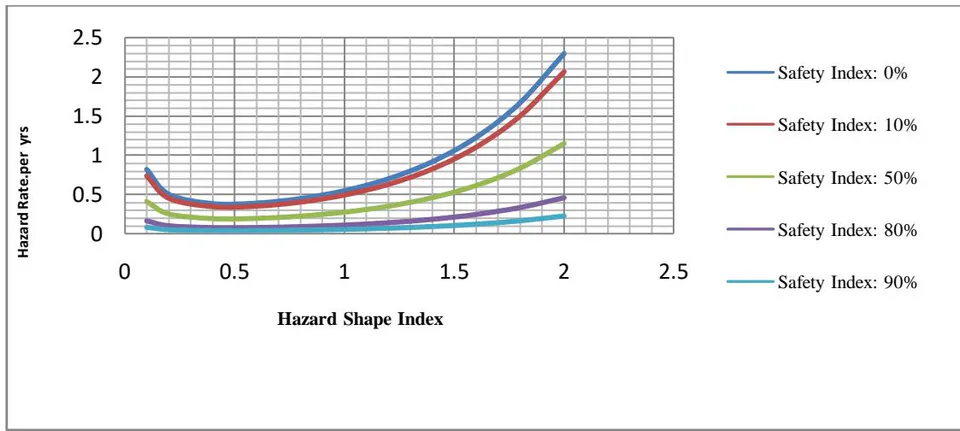
Figure 6 shows the simulated hazard rate for hazard class 1, while Figure 7 shows the simulated hazard rate for hazard class 2 for the personnel worker. The hazard class 1 qualification as unlikely to occur appears to reduced as improve safety index are increased from 10% to 90%.
d) The Plots of Hazard Rate for different Hazard Class and Safety Index
Figure 8 and Figure 9 shows that Risk Status/Risk Reduction Bar Chart. Whereas it is clear from
Figure 8 that the safety is highest for the 90% safety and least for the 0% safety. Also the Process worker on platform and FPSO seem to exhibit the greatest Risk Target, while the accommodation and ship crew worker exhibited lesser risk target.
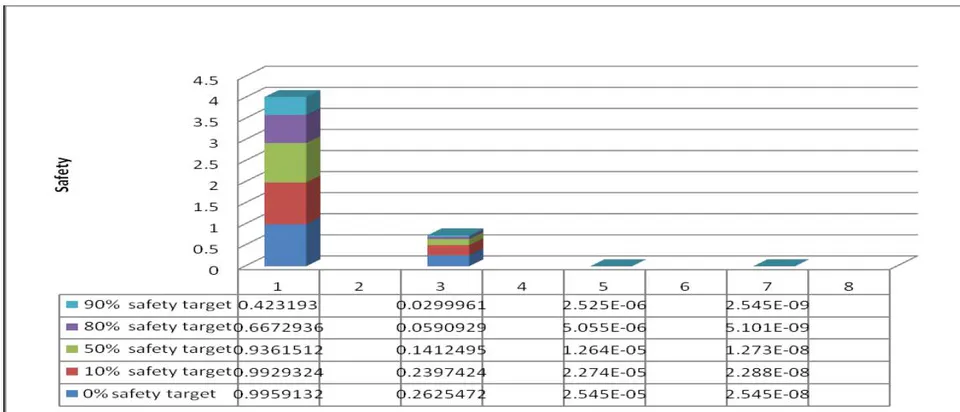
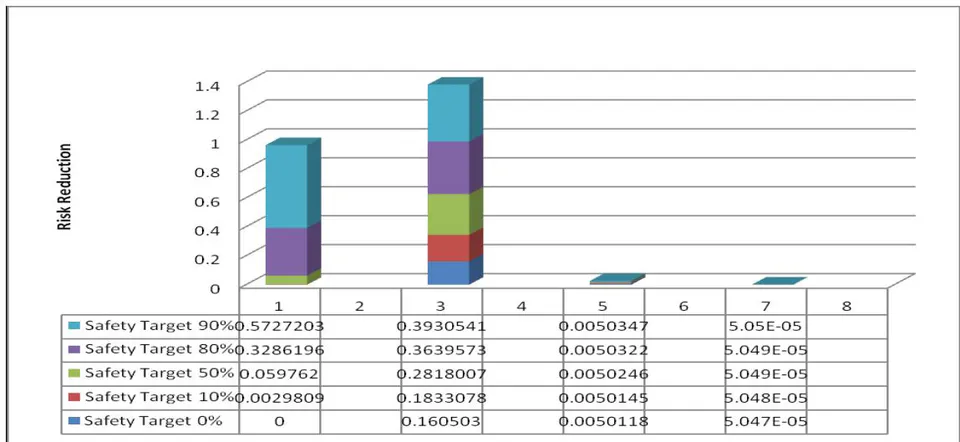
Figure 9 shows that risk reduction bar chart shows that risk reduction for safety index of 0% and highest at the maximum safety index of 90% on process worker on FPSO and Platform are impacted with the most risk threat.
e) Plot of Belief Variable for Hazard class 1 at safety index 0% and safety index 90%
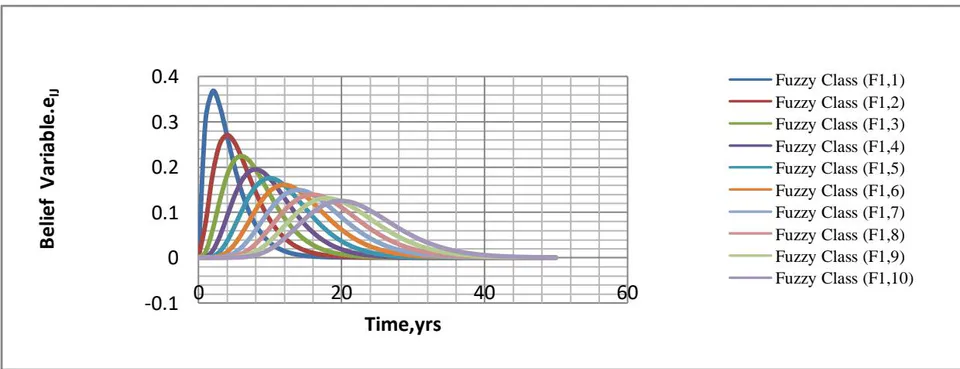
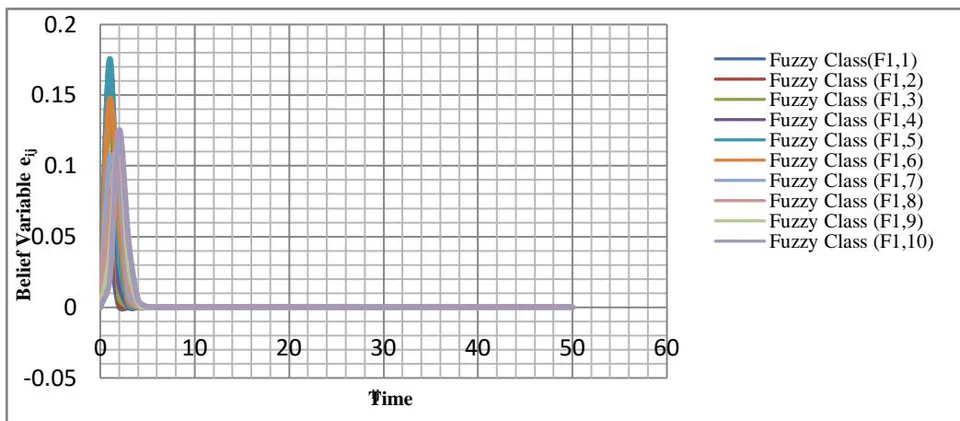
Figure 10 is a plot of the belief index for hazard class 1 with 90% safety index which has a numerical classification as Very likely [>1-10] /yr assigned a value hazard set value . Figure 11 is the plot of belief variable (confidence level) where the safety index is 0% for a number of failures 1 to 10 for a when hazard shape index=1.0. The belief variable is a measure of the index of certainty that within a particular time, the probability of occurrence is high. The belief variable represents the uncertainty an expert associates with an input data. For maximum safety index of 90%, the parabolic profile is more evenly spread with time than for the case with safe index of 0%, clearly indicating uncertainty on personnel worker depending on system would fail is higher for a system with lower safety index than a higher safety index.
f) Risk Variable for different Safety Index
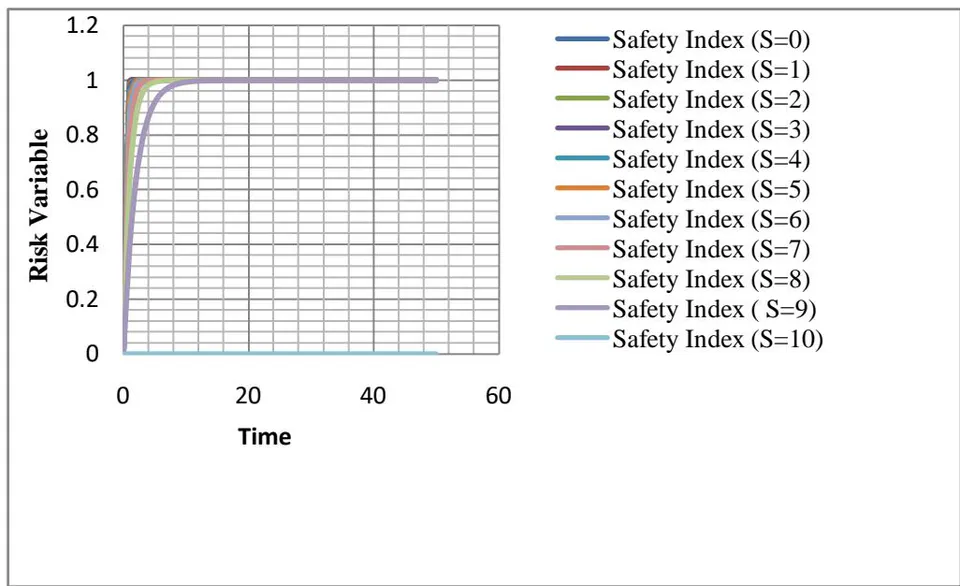
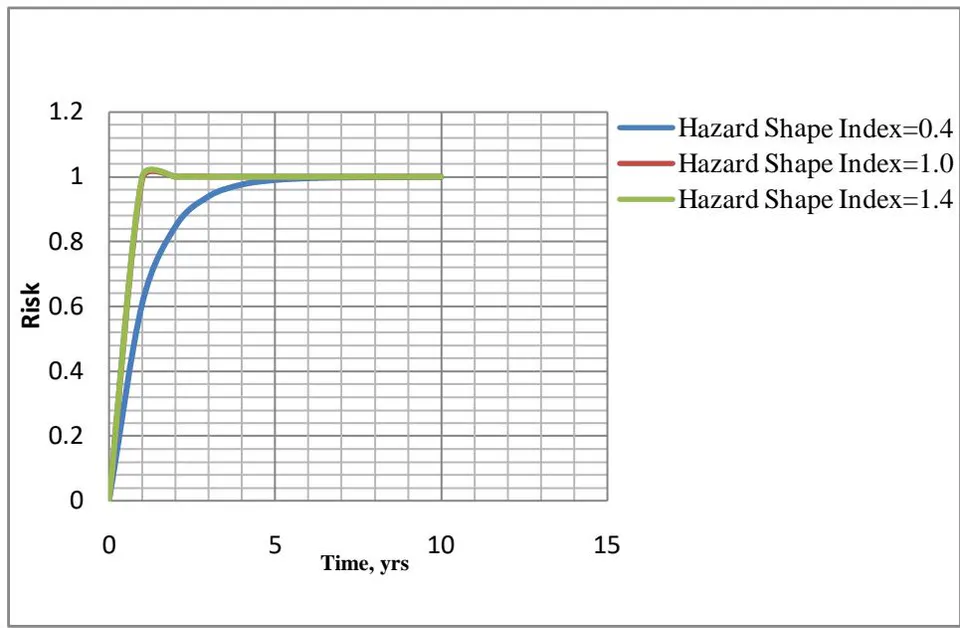
Figure 15 is the plot of the risk in a system with time in relationship to the safety index, for hazards class 1 type. The plot shows that risk of the FPSO's system increases exponentially with time but decreases as the safety index increases. Whereas Figure 16 showed exponentially increase of risk with time for safety that is non-existent 0% for all hazard indexes with the risk taking lesser values for lower hazard shape index.
VI. CONCLUSION
A model is presented to plan personnel safety on FPSO. Data was obtained from a multinational oil company operating in deepwater. Based on data obtained from a deepwater multinational oil and gas operator in Nigeria, personnel risk reduction on personnel is simulated as safety targets index increases from 0% to 90%. The plots of risk reduction /risk safety composite graph for risk target shows a risk reduction below the design risk status thresholds to plan credible threat reductions on personnel of complex process and production systems.
ACKNOWLEDGEMENTS
The author acknowledges the support or SNEPCO (Shell Nigerian Exploration & Production Company Inc.) for access to data Information. The author appreciates colleagues especially Professor Alfred A. Susu at the University of Lagos for valuable contribution. The support of NAPIMS and NNPC staff for the support for this research work is also appreciated.