I. INTRODUCTION
As society continues to evolve and science and technology advance, there is an increasing emphasis on early detection and diagnosis of health issues. Parkinson's disease, as a chronic neurological condition, profoundly impacts the quality of life for affected individuals. Early diagnosis is crucial in providing more effective treatment and care [1]. This paper focuses on exploring a novel approach using IoT technology for early detection of Parkinson's disease [2]. Authors [3] proposed approach to early Parkinson's disease detection on voice analythis base. We will introduce a comprehensive IoT network that collects voice data through mobile phones, extracts relevant features, facilitates data transmission and processing, and ultimately outputs the probability of Parkinson's disease. The implementation of this method holds the promise of providing a more convenient, accurate, and early diagnostic tool for both medical professionals and patients. In this paper, we will delve into the structure and algorithms of this IoT network and discuss its potential impact in the field of healthcare. It is our hope that this innovative approach will be a significant step forward in early intervention and treatment of Parkinson's disease.
Initially, voice data is collected and preprocessed using a mobile phone. This involves capturing speech data from Parkinson's disease (PD) patients for a duration of 5 seconds at a sampling frequency of . To enhance signal quality, the spectral subtraction algorithm [4] is employed to eliminate ambient noise.
Subsequently, features are extracted from the pre-processed speech data after noise reduction. The data is then transmitted to the voice channel an IoT platform. The data is fed into a Matlab analysis function.
The Matlab analysis module plays a pivotal role in interpreting the data by loading a 3-layer FCNN model deployed in the cloud. It processes the data and generates a probability value indicating the likelihood of a possible Parkinson's disease diagnosis.
Finally, the results are relayed from the IoT platform to a mobile phone and the outcomes are displayed on a screen for further examination and evaluation.
II. DATA COLLECTION AND PRE-PROCESSING
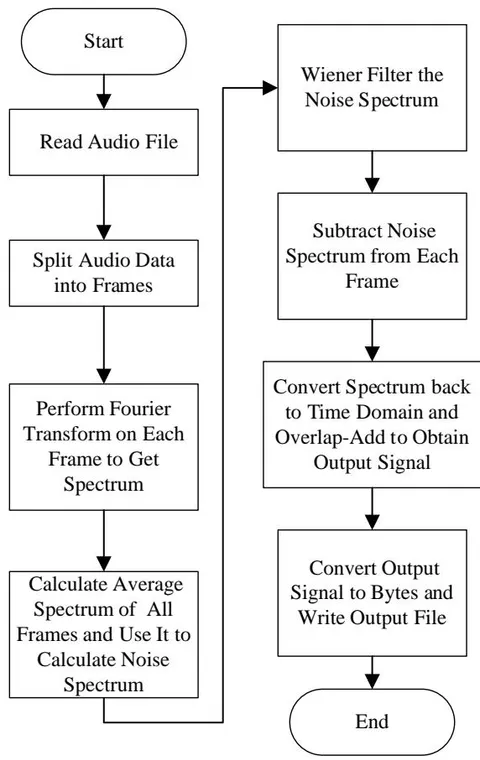
Use the spectrum subtraction algorithm for the voice data, the specific process is as follows:
- Split the original sound signal into frames, the length of each frame is 256 samples, using overlap to split the frames and get a series of frames of signal.
Let the original sound signal be denoted as , where is the sample index. - Let the frame length be samples and the overlap percentage be .
Define the frame index such that the start index of the -th frame is given by:
The k-th frame of the signal is then given by:
- Perform Fourier transform on each frame of signal to get the corresponding spectrum.
Let be the k-th frame of the signal. Apply a window function to the frame to reduce spectral leakage, such as a Hamming window.
Compute the Fourier transform of the windowed frame to get the complex spectrum :
Use spectral subtraction algorithm as the basis to calculate the noise spectrum.
- Wiener filter the noise spectrum to obtain a more accurate noise estimate.
Let be the noise spectrum estimated from .
Apply a Wiener filter to to obtain a more accurate estimate:
where is a smoothing parameter and is the spectrum of the original signal.
- Compare the spectrum of each frame with the Wiener filtered noise spectrum, calculate the signal-to-noise ratio and consider the frequency components with a signal-to-noise ratio lower than 10 dB as noise components [5].
Let be the complex spectrum of the k-th frame of the signal.
Compute the signal-to-noise ratio (SNR) for each frequency component as:
Consider the frequency components with SNR dB as noise components.
- Subtract the noise frequency components by adjusting the coefficient to 0.5 to obtain the noise removed spectrum.
Let be the noiseless spectrum of the k-th frame of the signal.
For each frequency component , if dB, then set the magnitude of to:
To obtain the complete signal after removing noise, we need to convert the noise-removed spectrum back to the time domain and superimpose each frame.
Let be the noiseless signal in the frequency domain of the k-th frame of the signal, and be the corresponding signal in the time domain. Similarly, let be the noise-removed spectrum of the k-th frame, and be the corresponding signal in the time domain.
To convert the noise-removed spectrum back to the time domain, we can apply the inverse Fourier transform to , which gives us :
Then, we can combine the noise-removed signal of each frame to obtain the complete signal without noise:
where is a window function applied to each frame, and the sum is taken over all frames.
The Figure 1 shows the algorithms of data preprocessing.
The voice data after removing the noise is windowed. The main advantage of using the Hamming window [6] to extract the signal window is that it can reduce the oscillation effect at the edge of the window while retaining the main components of the signal inside the window. The window size is 1024 and the frequency of the voice data is 44.1 kHz. The frequency of the voice data is 44.1 kHz and the overlap rate of the window is , so the speech time of a window is about 23 ms.
Let be the original signal in the time domain with a sampling frequency of . Let be the Hamming window of size .
The windowed signal is obtained by multiplying with the window and shifting the window by a hop size of :
where for some integer .
The Hamming window is defined as:
The duration of each windowed segment is , and the overlap between adjacent segments is .
III. FEATURE EXTRACTION
Feature extraction of the voice data [7] is performed within the specified window, as illustrated in Table 1 below.
| nNum | Feature Name | Description |
|---|---|---|
| 1 | MDVP:Fo(Hz) | Average vocal fundamental frequency |
| 2 | MDVP:Fhi(Hz) | Maximum vocal fundamental frequency |
| 3 | MDVP:Flo(Hz) | Minimum vocal fundamental frequency |
| 4 | MDVP:Jitter(%) | Measure of variation in fundamental frequency (percentage) |
| 5 | MDVP:Jitter(Abs) | Measure of variation in fundamental frequency (absolute value) |
| 6 | MDVP:RAP | Measure of variation in fundamental frequency (relative amplitude perturbation) |
| 7 | MDVP:PPQ | Measure of variation in fundamental frequency (pitch period perturbation quotient) |
| 8 | Jitter:DDP | Measure of variation in fundamental frequency (average of absolute differences of differences between adjacent periods) |
| 9 | MDVP:Shimmer | Measure of variation in amplitude (local variation in amplitude) |
| 10 | MDVP:Shimmer(dB) | Measure of variation in amplitude (local variation in amplitude in dB) |
| 11 | Shimmer:APQ3 | Measure of variation in amplitude (amplitude perturbation quotient, 3-point method) |
| 12 | Shimmer:APQ5 | Measure of variation in amplitude (amplitude perturbation quotient, 5-point method) |
| 13 | MDVP:APQ | Measure of variation in amplitude (average amplitude perturbation quotient) |
| 14 | Shimmer:DDA | Measure of variation in amplitude (average absolute difference of amplitudes between consecutive periods) |
| 15 | NHR | Ratio of noise to tonal components in the voice |
| 16 | HNRR | Ratio of harmonics to noise in the voice |
| 17 | RPDE | Nonlinear dynamical complexity measure |
| 18 | D2 | Nonlinear dynamical complexity measure |
| 19 | DFA | Signal fractal scaling exponent |
| 20 | spread1 | Nonlinear measure of fundamental frequency variation |
| 21 | spread2 | Nonlinear measure of fundamental frequency variation |
| 22 | PPE | Nonlinear measure of fundamental frequency variation |
IV. DATA TRANSMISSION AND PROCESSING
To upload the 22 features to Thingspeak [8] IoT for analysis.
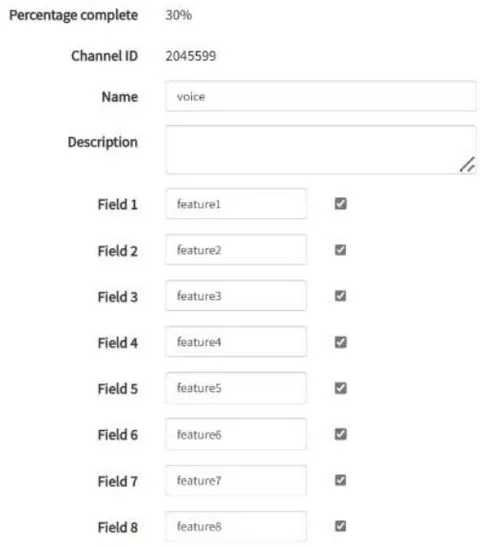
- Creating a Channel. Figure 2 below shows the setup of the VOICE channel.
Channel Settings
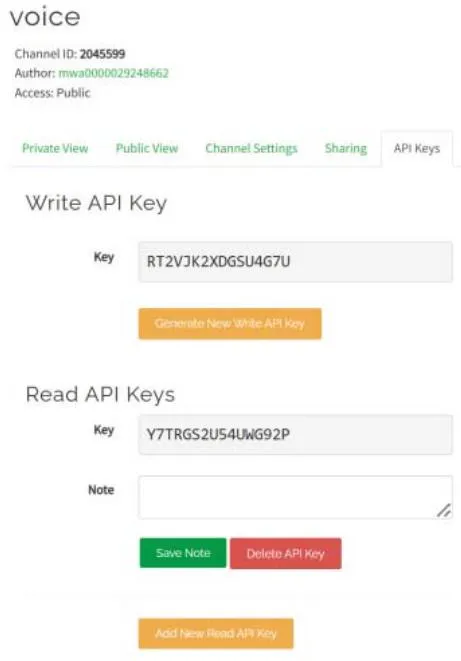
- Getting the voice channel write/read API key and channel ID. The figure 3 below shows the voice channel write/read API key and channel ID.
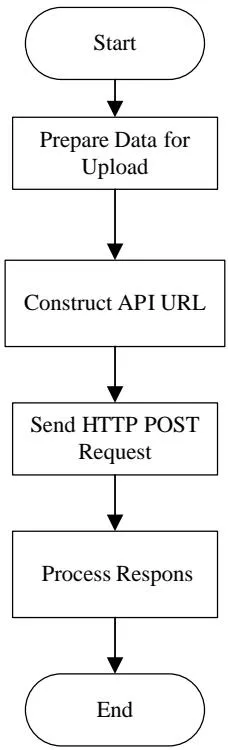
- Using the API in the phone. The API library code uses the HTTP protocol to upload 22 voice features to the voice channel. Figure 4 shows the ThingSpeak API data upload algorithm.
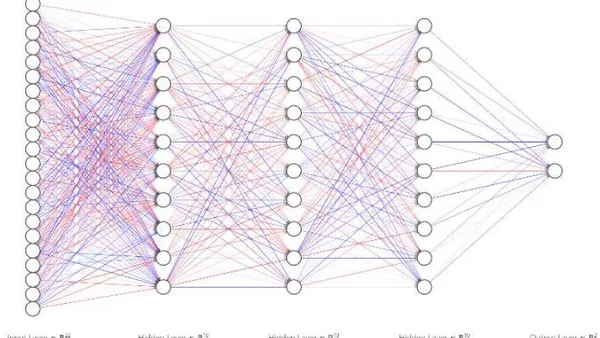
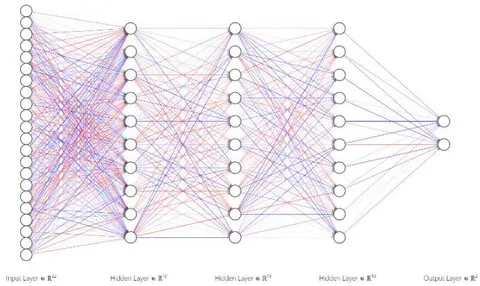
- To load the pre-trained FCNN [9] model in Matlab Analysis module and to input the 22 data into the model for analysis to obtain the results. The model was trained using a publicly available dataset for Parkinson's Disease [10]. The Figure 5 shows the schematics of 3-Layer FCNN. Table 2 shows hyperparameters of 3-layer FCNN.
| Name | Hyperparameters |
| First Layer Size | 10 |
| Second Layer Size | 10 |
| Third Layer Size | 10 |
| Activation Function | ReLU |
| Iteration Limit | 1000 |
| Learning Rate | 0.01 |
| Learning Rate Update Algorithm | SGD |
| Regularization Strength (Lambda) | 0 |
| Standardize Data | Yes |
In Thingspeak, store the result value to file1 in the voice channel, and then the phone reads the value of file1 in the voice channel.
V. RESULTS AND DISCUSSION
The process begins with receiving the initial signal from the microphone, then the signal goes through a number of preprocessing stages, including high-frequency isolation, noise suppression and segmentation of the speech frame using a Hamming window. Key characteristics are then extracted from these processed data and compiled into datasets. These data sets are transmitted to a neural network for training and optimization of the model, visually represented in the figure as a multi-layered structure. The completion of training and optimization is the creation of a model file capable of classifying voice input data. The experiment was conducted on an international dataset [11]. The results of test experiments in the IV network for the diagnosis of PD in patients with speech changes are shown in Table 3.
| Набор данньх/ Показасти | Среедnia Точ�数ь | Среедnia Чувсантуль�数ь | Среедnia F1 оменka | Точ�数ь Тechироваши |
| бли по peчи_ | 92,95% | 92,95% | 92,95% | 94,7% |
The IoT network achieved accuracy in diagnosing Parkinson's disease based on speech data and an F1 score of . On the same data set, one of the best indicators of foreign studies is [12], which indicates both good recognition results and the possibility of implementing an IV network for domestic PD diagnostics.
VI. CONCLUSIONS
In summary, the IoT network efficiently collects voice data from PD patients, processes it to remove noise, extracts essential features, and utilizes a 3-layer FCNN model to provide probability-based diagnostic outcomes, offering a viable solution for the timely detection of Parkinson's disease. Our work underscores the pivotal role of the IoT advancing healthcare. By seamlessly connecting devices and systems, IoT not only enables remote diagnostics but also promotes patient empowerment, personalized medicine, and enhanced healthcare delivery.
An approach using machine learning, neural networks, signal processing, and the Internet of Things (IoT) technologies for early detection of Parkinson's disease is described. A model and algorithms for processing audio signals from patients studied for the likelihood of Parkinson's disease are presented. The Internet of Things network collects voice data from PD patients, processes it to eliminate noise, extracts important characteristics, and uses a three-level FCNN model to obtain probability-based diagnostic results, offering a solution for timely detection of Parkinson's disease.
- This work highlights the role of the Internet of Things in the development of IT diagnostics of patients. Thanks to the wireless connection of devices, the IoT network not only provides remote diagnostics, but also helps to empower patients and doctors, staff and improve the quality of medical care. As a result of experiments on an international dataset in the IV
network, accuracy was achieved in diagnosing Parkinson's disease based on speech data.