I. INTRODUCTION
Peanut (Arachis hypogaea) is the most crucial oilseed crop after soybean and cotton. Being a legume crop, it is rich in protein. This tropical cash crop is often referred to as "The king of oilseeds," groundnut, earth nut, wonder nut, or poor men's cashew nut. India is the pioneer producer of peanuts with a production of 6.48 MMT and contributed more than of world production for 2020 (FAOSTAT 2022)[1]. The chief peanut-producing states in India are Gujarat, Rajasthan, Andhra Pradesh, Tamil Nadu, and Madhya
Pradesh. These five states account for around of the total area under peanut cultivation, mainly as the Kharif season crop (June - September). As a leguminous crop, it is grown in crop rotation mainly to maintain soil health and reduce soil erosion.
Eighty percent of the total peanut produced in India undergoes processing for oil extraction through either mechanical or solvent extraction in a batch or continuous process. The high temperature in most efficient mechanical extractors damages the edible quality of obtained defatted materials and is unsuitable for human consumption (BADWAIK, PRASAD, DEKA 2012)[2]. Residual solvent associated with solvent-extracted defatted peanut meal creates problems in its utilization for various value-added products (BADWAIK, PRASAD, SETH 2014)[3], therefore affecting the loss of valuable resources.
Peanut may be considered a functional food, as it contains numerous functional and health-promoting compounds, including arginine, mono, and polyunsaturated fatty acids, dietary fiber, folate, niacin, vitamin E, and most of the vital minerals (GOPALAN, RAMA SASTRI, BALASUBRAMANIAN 1971)[4] beneficial for human health. The presence of bioactive phenolic compounds provides this valuable biomaterial with a rich source of antioxidants (FRANCISCO, RESURRECCION 2008)[5]. Raw peanut in India is used in a wide variety of forms. The process involved often soaking in water before being used as an ingredient in the preparation of different delicacies. Soaking and grinding in preparation of seasonings are commonly used to garnish the most traditional fermented foods such as idly, dosa, vada, and uttapam with several other breakfast items in the Indian subcontinent (ACHAYA 1984)[6].
The physical properties of peanut kernels, like those of other seeds, become helpful in designing equipment, especially for handling, processing, and storing. The moisture content of grain affects the efficiency of cleaning, grading, and separation processes (YALÇİN, ÖZARSLAN, AKBAŞ 2007)[7]. The author has made investigations the determination of the physical properties of various leguminous splits, such as chickpeas, lentils, black gram, and green gram (BHATIA, SHARMA, PRASAD, PRASAD 2009)[8]; PRASAD, VAIRAGAR, BERA 2010[9]; KAUR, SHEKHAR, KUMAR, PRASAD 2021[10]; KAUR, PRASAD 2022[11]; KAUR, PRASAD 2022[12]; KAUR, PRASAD 2021[13].
Limited studies on water absorption kinetics for peanuts were carried out. The present study aims to investigate the moisture-dependent physical properties of temperature-dependent water absorption kinetics to assess the adequacy of mathematical models in describing the process of water absorption kinetics.
II. MATERIALS AND METHODS
a) Sample Preparation
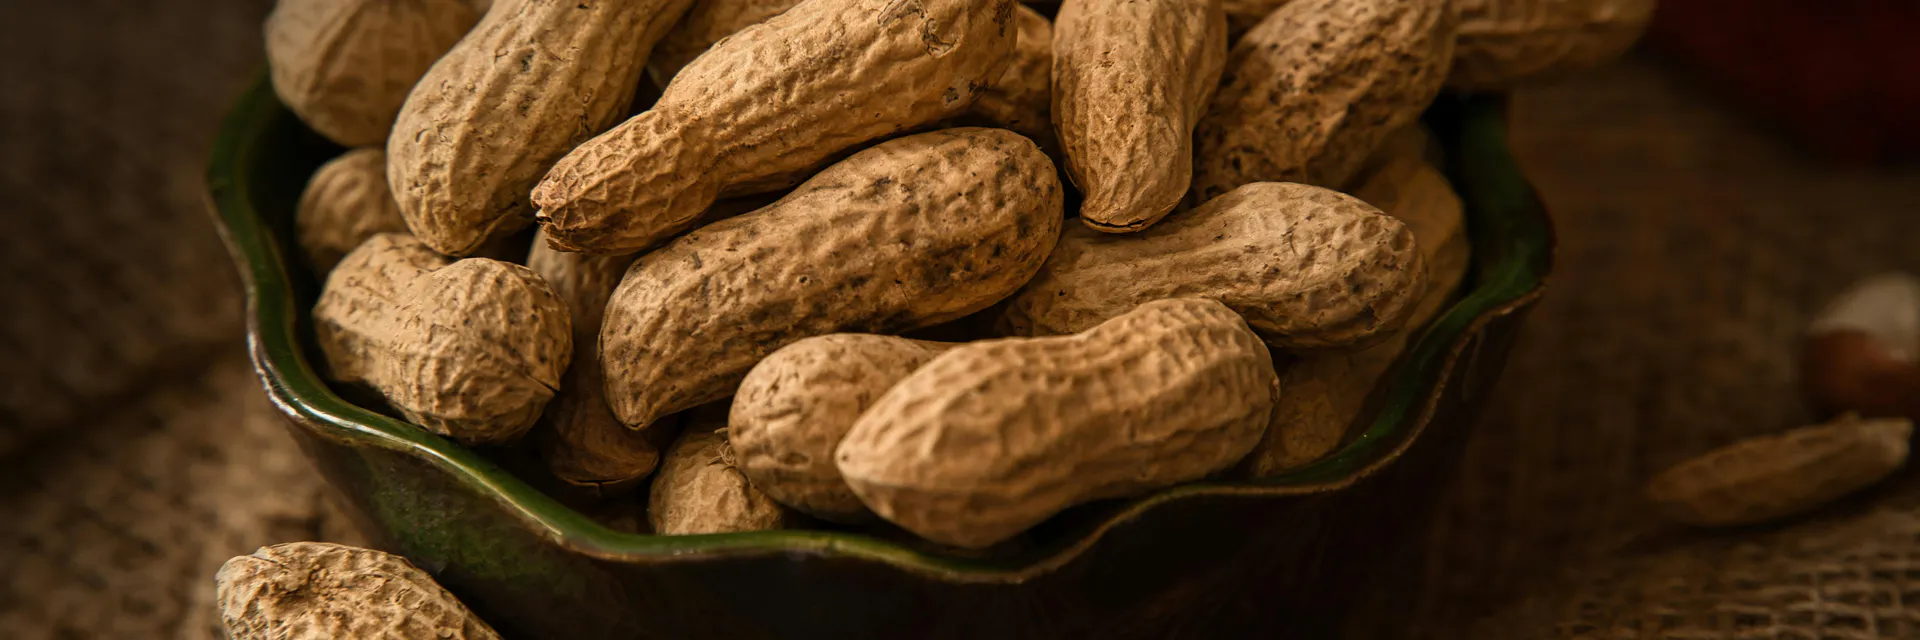
The dried whole peanut pods of genotype GG20 were procured from the Central Institute of Postharvest Engineering and Technology (CIPHET), Punjab Agricultural University Campus (PAU), Ludhiana (Punjab). The whole peanut pods were cleaned and dehulled. The kernels were manually sorted to separate damaged and shrunk kernels. The sorted sound kernels (Fig. 1) were stored in air-tight glass containers and under refrigerated conditions. The samples were taken out as per the experimental requirements. The initial moisture contents of the kernels were determined using the hot air oven method (GUPTA, DAS 2000)[14]. The predetermined weight of moisture was impregnated to obtain the four levels of moisture content for the peanut kernels as , , , and (wet basis), conditioned and stored at . The samples for the study were taken out and kept in the ambient environmental condition in sealed pouches to equilibrate quickly and without any change of moisture content.
b) Determination of Physical Properties
The geometrical shape consisting of a cylinder and two hemispheres at the ends has been found to be quantitative appropriateness for peanuts (AKCALI, INCE, GUZEL 2006)[15]. The physical dimensions were determined randomly measured for three major perpendicular dimensions, length (L), width (W), and thickness (T), of 100 seeds of each variety using a digital vernier caliper (Mitutoyo Corporation, Japan) having the precision of . The geometric mean dimension of peanut kernels was found using the relationship as given (MOHSENIN 2020)[16]:
The criteria used to describe the shape of the seed are sphericity. Thus, the sphericity was accordingly computed (MOHSENIN 2020)[16] as:
The surface area was calculated (Eqn. 3) considering the geometrical properties of the kernel as:
Electronic balance (Ishida Co. Ltd., Japan) was used to measure the weight of the sample to an accuracy of 0.001 g. The true density of a peanut kernel is defined as the ratio of the mass of the seed to the solid volume occupied (DEsHPANDE, BAL, OJHA 1993)[17]. The liquid displacement technique determined the seed volume and its true density. The immersion time was maintained below 10 sec, which was considered too small to absorb water. The amount of displaced water was recorded from the graduated scale of the measuring cylinder (AMIN, HOSSAIN, ROY 2004)[18]. The porosity of bulk seed was computed from the values of true density and bulk density using the relationship (Eqn. 4) given (MOHSENIN 2020)[16]:
To determine the angle of repose , a cylinder of diameter was used. The height and diameter of the formed heap of peanut kernels were measured to determine the angle of repose using the relationship:
Where is the height of the heap (mm), and is the diameter of the heap (mm) at its base.
The static coefficient of friction was determined for three structural surfaces, namely galvanized steel sheets, glass, and plywood. A plastic cylinder of diameter and height was placed on an adjustable tilting flat plate faced with the test surface and filled with a sample of about . The cylinder was raised slightly to ensure complete contact with the peanut kernel and the experimenting surface and to avoid any error being induced by the test cylinder. The setup was then inclined gradually until the cylinder started sliding down. The angle of tilt was noted from a graduated scale (DUTTA, NEMA, BHARDWAJ 1988)[19]; SHEPHERD, BHARDWAJ 1986)[20].
All the experiments were replicated at least ten times, and average values were reported.
c) Water Absorption during Soaking
The hydration behavior of peanut kernel was determined by soaking a 50g sample in cylindrical glass containers containing 250 ml of distilled water (1:5 w/v) (ABD EL-HADY, HABIBA 2003)[21]. Soaking water temperatures were 5, 15, 25, and . Before each experiment, the sample, containers, and distilled water were kept at the desired temperature for a few hours. Hydration behavior was precisely observed for up to 24 hours using an electronically controlled water bath to an accuracy of (RESIO, AGUERRE, SUAREZ 2005)[22]. The moisture content of the sample during hydration was determined based on the sample's weight increase. Soaked kernels were immediately blotted with the muslin cloth to remove any chance of the presence of surface water before taking the reading (VERMA, PRASAD 1999)[23].
d) Modeling of Water Absorption of Peanut Kernels
The kinetics of hydration of peanut kernels was assessed using selected models presented in Table 1. Analysis of absorption behavior through selected models, the time-dependent data of moisture content, and moisture ratio (MR) of peanut kernels is essential. The moisture ratio was calculated as follows:
These parameters can be calculated as follows:
Where , , and are the initial equilibrium, and moisture at any time , respectively. The moisture ratio data were then fitted to the different models (exponential model and Weibull model). The parameters in each model were estimated by using the nonlinear regression analysis. Adequacy of the fitted model was assessed in terms of coefficient of multiple determination , Chi-square , and root mean square error (RMSE) to ascertain the quality fit with a condition of higher value and lower and RMSE values (KASHANINEJAD, MAGHSoudLOU, RAFIEE, KHOMEIRI 2007)[24].
where is the experimentally observed moisture ratio, the predicted moisture ratio, N is the number of observations, and n is the number of constants in the model (YALCSIN, OZARSLAN, AKBAS 2007)[7; TOGRUL, PEHLIVAN 2003][25].
III. RESULTS AND DISCUSSION
a) Physical Properties
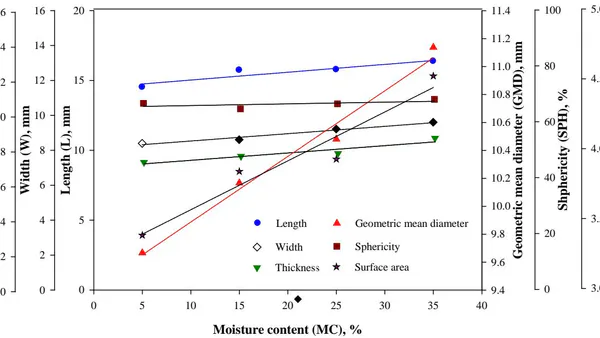
An increase in moisture content from 5 to has shown a linear change in length (L), width (W), thickness (T), and geometric mean diameter (GMD) of peanut kernels (Fig. 2) from 14.52 to , 8.40 to , 7.41 to , and 9.67 to , respectively (Table 2). A linear dimensional increase in peanut kernels with an increase in moisture content was mainly due to the absorption of moisture that resulted in the swelling of peanut cells and thus affected kernel's dimensional properties. The linear increase in width and thickness has also been reported for popcorn kernel (KARABABA 2006)[26] and pistachio nut (KASHANINEJAD, MORTAZAVI, SAFEKORDI, TABIL 2006)[27]. A minor initial decrease in the sphericity ( ) of peanut kernel with further increase as the increase in moisture content is evident (Fig 2). The initial decrease in sphericity may be attributed to the initial higher rate of lateral expansion in comparison to the change in the width and thickness. However, at later stages of moisture gain, the rate of expansion in width and thickness increased more and caused to increase in sphericity. The high sphericity value suggests that the kernel tends towards a spherical shape (OMOBUWAJO, SANNI, OLAJIDE 2000)[28], being cylindrical. The surface area ( ) of peanut kernels increased linearly from 3.38 to with increased moisture content. It was of overall increase (Fig. 2). A surface area is a relevant tool in determining the shape of the kernel and indicating the material behavior on oscillating surfaces during processing (ALONGE, ADIGUN 1999)[29].
The unit mass (UM) of peanut kernel was found to be increased from 0.462 to with an increase in moisture content (Table 2). Differential sphericity, surface area, and unit mass of materials serve in designing aerodynamic cleaning systems. Bulk density decreased from 560 to with an increase in moisture (Fig. 3). This decrease in the bulk density on change of moisture content is probably due to higher volume expansion in kernel in comparison to weight change on change in moisture content (Fig. 3). A decrease in bulk density was found for chickpea seeds from 800 to with an increase in moisture content from 4.9 to (AMIN, HOSSAIN, ROY 2004)[18]. A similar relation between moisture content and bulk density was reported for Soybean (DESHPANDE, BAL, OJHA 1993)[17], sunflower seed (GUPTA, DAS 1997)[30], and popcorn kernel (KARABABA 2006)[26]. Porosity increased linearly from 39.58 to with an increase in moisture content, and similar trends were reported for gram (DUTTA, NEMA, BHARDWAJ 1988)[31], sunflower kernel (GUPTA, DAS 1997)[30], green gram (NIMKAR, CHATTOPADHYAY 2001)[32], chickpea seed (KONAK, CARMAN, AYDIN 2002)[33], and popcorn kernel (KARABABA 2006)[26].
The angle of repose and coefficient of friction as frictional properties are essential in designing equipment for solid flow and storage structures. The coefficient of friction between the seed and wall is an essential parameter in predicting seed pressure on walls (GUMBE, MAINA 1990)[34]. The angle of repose of peanut kernels increased from 39.01 to with an increase in moisture content in the range of 5 to (Table 2). The static coefficient of friction at various moisture levels reflects the increase in moisture content for all the analyzed surfaces (Fig. 4). This is due to the increased adhesion properties between the seed and the material surfaces at higher moisture levels.
b) Soaking Kinetics
The behavior of moisture uptake during time-dependent soaking by peanut kernel at temperatures 5, 15, 25, and is shown in Fig. 5. An early rapid hydration rate in the primary phase with a slower hydration rate in the second phase was observed (Fig. 5). The time needed for the transition of phase was found by applying the creep deformation properties in the water absorption process, observed to be temperature-dependent, and were 2.80, 2.56, 1.89, and 1.24 hrs at 5, 15, 25, and , respectively. The diffusion process governs the rapid initial water uptake in the primary phase was probably due to the filling of capillaries on the surface of the seed coats. A decrease in water absorption rate further in the relaxation phase may be attributed to the reason that water filling decreased the driving force. At any time, the moisture content of the kernels increased with temperature, indicating that the amount of water absorbed during hydration was a function of both soaking time and temperature (Fig. 5). Similar results were found in the case of rice (KASHANINEJAD, MAGHSoudLOU, RAFIEE, KHOMEIRI 2007)[24]. The water gain increases with the temperature increase of soaking water (Fig. 5). This increase is due to changes in diffusion resistance. Higher temperatures are known to expand and soften the material, which has affected the intactness and lowered the diffusion resistance to water transfer. Due to this, water gain cannot follow the pace of increased temperature. Temperature-induced softening has been reported for soybean (SINGH, KULSHRESTHA 1987)[35], chickpea(SAYAR, TURHAN, GUNASEKARAN 2001)[36], and kidney bean (ABU-GHANNAM, MCKENNA 1997)[37].
c) Fitting of the Model Equation
i. Empirical Models
Table 3 presents the fitted Peleg, Exponential, and Weibull models as nonlinear regression models to describe the water absorption characteristic of peanut kernels at hydration temperatures of 5 to . All selected models accurately described peanut kernel's water absorption at the hydration temperatures from 5 to . The selected models gave accurate predictions and satisfactorily described soaking characteristics as values were equal to or higher than , RMSE values were lower than 0.005 with valued lower than 0.005 (Table 3).
Appraisal of the Peleg rate constant reflects a linear decrease in its value from 0.065 to 0.017 hr/%mc (db) with the increasing temperature from 5 to (Table 3). The term "inverse of " is called the initial rate of absorption; thus, at a given temperature, as decreases, the amount of water absorbed becomes greater (PRASAD, VAIRAGAR, BERA 2010)[9]. This resulted in a lower at compared to a lower temperatures depicting a higher initial water absorption rate for peanut kernel. Further, the water absorption process proceeded at a slower pace and ceased attaining the equilibrium water content. The Peleg capacity constant, , as the absorption ability of foods showed a marginal increase with temperature (Table 3), reflecting the property of peanut kernel towards water absorption capacity.
The probabilistic Weibull model describes a system's behavior with some degree of variability (CUNHA, OLIVEIRA, OLIVEIRA 1998)[38]. Weibull shape parameter is a behavior index that depends on the process mechanism, and the higher its value, the slower the process in the initial phase of absorption (CUNHA, OLIVEIRA, OLIVEIRA 1998)[38]; MACHADO, OLIVEIRA, GEKAS, SINGH 1998)[39]. Thus, the inverse of the Weibull shape parameter was thus considered an indicator of the initial rate of the hydration process. An increase in the temperature of soaking thus reduced the value of from 5.609 to 1.546, further justifying the obtained temperature-dependent soaking behavior for peanut kernel (Table 3).
Weibull scale parameter represents the time needed to accomplish approximately of total absorbed water (CUNNINGHAM, MCMINN, MAGEE, RICHARDSON 2007)[40]. Table 3 shows the effect of temperature change on relative rates of moisture diffusion and thus affecting the overall absorption process. This implies that with an increase in temperature from 5 to , the absorption rate in the primary phase of soaking was accelerated significantly (Fig. 5).
Fitting the exponential model to the experimental data at four different temperatures for the hydration process (Fig. 6) depicts an increasing trend of hydration rate constant (K) with the soaking temperature (Table 3). The high observed value of the coefficient of determination confirmed the applicability in the prediction of the soaking process of the peanut kernel.
A large amount of absorbed water is present in the first phase of the process and further reaches equilibrium in the relaxation phase of soaking. However, at lower temperatures, the absorbed water in the primary soaking phase is less, and the absorption continues in the second phase. The values for the parameters , ; , and in Peleg, Exponential, and Weibull models, respectively, supported the findings.
ii. Diffusivity Model and Activation Energy
To predict moisture diffusivity during the soaking of peanut kernels, the second Fick's law solution for diffusion out of an infinite cylinder being length of more than twice the width was used. For this purpose, the assumptions considered were (i) the effective diffusion coefficient is independent of moisture concentration, (ii) the volume of the kernel does not change during water absorption, and (iii) the surface of the kernel reaches the equilibrium moisture content instantaneously upon immersion in absorption media. The general series solution of Fick's second law in the infinite cylinder is given below (CRANK 1975)[41]:
is the effective diffusivity and is the characteristics radius of the cylinder. Eqn calculated the effective diffusion coefficient. (11) using slopes derived from the linear regression of In (MR) against time data. The effective diffusion coefficient during the soaking of peanut kernels varied from to over the temperature range studied (Table 4).
A similar result was also obtained with other agricultural seeds. The effectiveness of diffusivity during soaking of rice varied from to ( .) in the temperature range from 25 to (KASHANINEJAD, MAGHSoudLOU, RAFIEE, KHOMEIRI 2007)[24], in case of soybean, varied from to . in the temperature range from 40 to (HSU 1983)[42], and to ( .) in case of splits chickpea at the hydration temperature range of 40 to (PRASAD, VAIRAGAR, BERA 2010)[9].
The effect of temperature on effective diffusivity is generally described using the Arrhenius-type relationship to obtain a better agreement of the predicted curve with experimental data:
is a diffusivity-constant equivalent to the diffusivity at infinitely high temperatures, is the activation energy (K J/mol), is the universal gas constant (8.314 J/mol. K), and is the absolute temperature. The logarithm of as a function of the reciprocal of absolute temperature ( ) is plotted in Fig.7. The results show a linear relationship between and or an Arrhenius-type relationship (Eqn. 12). The diffusivity constant ( ) and activation energy ( ) calculated from the linear regression is 8.010 ( ) and 32.175 (KJ/mol), respectively. This value is comparable to those reported in the literature for water absorption in some legumes. This activation energy is in reasonable agreement with the data presented by several authors for other grains. Activation energy (Ea) value of 30.0 KJ/mol in the case of whole rice grains (BELLO, TOLABA, SUAREZ 2004)[43] and 22.49 to 22.70 KJ/mol in the case of hydration of chickpea splits of different shapes (PRASAD, VAIRAGAR, BERA 2010)[9].
IV. CONCLUSIONS
The hydration kinetics of peanut kernel (GG-20) in plain water at different temperatures was examined. The soaking process exhibited an initial faster rate of water absorption followed by a slower pace during the secondary absorption phase. The transition from primary absorption phases occurred approximately between 1.23 to 2.80 hrs, depending on the soak water temperature, which may be used as the deciding time for soaking of peanut. The moisture absorption was an endothermic process with heat absorption of 32.175 KJ/mol.
| Model Name | Equation |
| Peleg | M=M0+ t/(K1+ K2t) |
| Exponential | MR=exp(-kt) |
| Weibull | MR=Exp(-(t/∞)β) |
35.07±0.09%
| Parameters | Moisture Levels of shelled peanut (%, wwb) | |||
| 6.57±0.44% | 15.74±0.01% | 25.21±0.03% | 35.07of ±0.09% | |
| Length, mm | 14.52±1.48 | 15.74±1.41 | 15.78±1.52 | 16.37±1.20 |
| Width, mm | 8.40±0.72 | 8.61±0.44 | 9.22±0.49 | 9.61±0.47 |
| Thickness, mm | 7.41±0.43 | 7.76±0.58 | 7.92±0.65 | 8.79±0.70 |
| GMD, mm | 9.67±0.66 | 10.17±0.56 | 10.48±0.54 | 11.14±0.50 |
| Sphericity,% | 66.60±4.20 | 64.61±3.66 | 66.44±4.97 | 68.03±4.56 |
| Surface Area, cm2 | 3.38±0.45 | 3.84±0.50 | 3.93±0.47 | 4.52±0.43 |
| Unit Mass, gm | 0.462±0.161 | 0.565±0.127 | 0.567±0.139 | 0.724±0.143 |
| Bulk Density, kg/m3 | 560.0±10 | 491.0±7.0 | 460.0±12.0 | 496.0±17.0 |
| True Density, gm/ml | 0.927±0.010 | 0.877±0.016 | 0.865±0.019 | 0.932±0.026 |
| Porosity,% | 39.58±0.95 | 43.98±1.63 | 46.81±1.09 | 46.77±0.97 |
| Angle of Repose, degree | 39.01±1.87 | 49.35±1.55 | 50.09±1.06 | 50.48±0.68 |
| CSF (Steel) | 0.248±0.004 | 0.331±0.014 | 0.367±0.008 | 0.406±0.006 |
| CSF (Glass) | 0.158±0.007 | 0.337±0.020 | 0.379±0.010 | 0.409±0.006 |
| CSF (Plywood) | 0.295±0.004 | 0.300±0.008 | 0.320±0.013 | 0.430±0.028 |
| Temperature (°C) | Peleg Model | Exponential Model | Weibull Model | |||||||||||
| K1 | K2 | R2 | χ2 | RM SE | K | R2 | χ2 | RM SE | α | β | R2 | χ2 | RM SE | |
| 5 | 0.0 | 0.0 | 0.98 | 0.00 | 0.01 | 0.1 | 0.96 | 0.00 | 0.05 | 5.6 | 0.7 | 0.98 | 0.00 | 0.03 |
| 65 | 14 | 04 | 07 | 15 | 83 | 36 | 31 | 46 | 09 | 89 | 54 | 13 | 46 | |
| 15 | 0.0 | 0.0 | 0.99 | 0.00 | 0.00 | 0.2 | 0.98 | 0.00 | 0.03 | 3.6 | 0.8 | 0.99 | 0.00 | 0.01 |
| 42 | 14 | 84 | 01 | 77 | 78 | 63 | 46 | 63 | 83 | 26 | 89 | 01 | 05 | |
| 25 | 0.0 | 0.0 | 0.98 | 0.00 | 0.02 | 0.4 | 0.99 | 0.00 | 0.02 | 2.2 | 0.9 | 0.99 | 0.00 | 0.02 |
| 29 | 15 | 74 | 05 | 04 | 50 | 21 | 08 | 84 | 56 | 05 | 46 | 06 | 34 | |
| 35 | 0.0 | 0.0 | 0.99 | 0.00 | 0.01 | 0.6 | 0.99 | 0.00 | 0.02 | 1.5 | 0.8 | 0.99 | 0.00 | 0.02 |
| 17 | 15 | 05 | 04 | 79 | 62 | 09 | 09 | 94 | 46 | 73 | 47 | 06 | 24 | |
| Temperature (°C) | Effective diffusivity (m2/sec) |
| 5 | 2.905×10⁻¹⁰ |
| 15 | 4.833×10⁻¹⁰ |
| 25 | 8.581×10⁻¹⁰ |
| 35 | 10.753×10⁻¹⁰ |