## I. INTRODUCTION
The situation in the solar wind during the period of maximum solar activity, when the probability of sporadic phenomena (flares, shock waves, etc.) is high, can be defined as "crisis". And therefore it is quite natural to apply the concept of crisis phenomena to describe the process as a whole, namely, to use the "Theory of Continuous Media Failure" or "Reliability Theory". In this case, the highest moments of the distribution function are used in the analysis. More precisely, the generalized three-parameter Weibull-Gnedenko distribution is used [1](Appendix 1). To calculate the PROBABILITY of achieving the critical value of the cosmic ray (CR) count rate, it is necessary to estimate the shape parameter "c" of the Weibull-Gnedenko empirical distribution, which determines the degree of DEVIATION of the approximating function of the empirical histogram from the normal distribution.
The approximating function of the empirical (integral) histogram of the CR count rate is found by the least squares method. The average values of the CR count rate for each bin interval of the empirical distribution function (integral histogram) will be grouped in the vicinity of the fitted straight line, but in a new coordinate grid (after the procedure of double logarithmization and substitution of variables). In this case, the tangent of the slope of the straight line fitted by the least squares method and the free term give the relationships necessary for estimating the sought-after shape and scale parameters. The shape parameter "c" is the key parameter: when it reaches a critical value, the parameter value is determined as a predictor of entering a critical, essentially transient, regime. The scale parameter is determined by the average value of the empirical histogram of the CR count rate distribution.
Thus, the procedure for extracting a useful precursor signal from a noise-like signal is reduced to finding the Risk function (by definition, the CR fluctuation PARAMETER) of the Weibull-Gnedenko distribution describing the experimental (integrated) histograms of five-minute CR count rate values. This allows extracting a useful predictor signal from Gaussian noise: Gaussian noise is contained, simply put, in the "linear" part of the Risk function, and the desired predictor signal is in the nonlinear part. The desired, nonlinear component of the predictor signal is formed when the calculated probability of the CRITICAL value of the analyzed variable (CR fluctuation parameter) is exceeded, i.e. when $P > P_{cr}$.
## II. METHOD
A test calculation of the Risk function, when a whole series of the most extreme events of solar cycle 23 (October 2003) was observed - Appendix 2. The calculation was carried out for 7 solar rotations: first, for 5 rotations 2318-2322 preceding the extreme events on rotations 2323-2324, and then directly during the specified active phase of the solar cycle. From the calculation results it follows that significant $(P > 0.5)$ values of the maximum of the Risk function - predictor, were detected in July-August 2003 (rotations 2320-2321). In this regard, the time interval falling on rotations 2320-2321 during which the predictors were detected is defined as - the transitional regime to the extreme active phase of the solar cycle in October-November 2003 (rotations 2323-2324). Thus, we can conclude that the ideology of crisis situations, in this case, has proven itself to be successful.
An example of calculating the Risk function on a smaller (semi-diurnal) scale of averaging the count rate and the corresponding values of the CR fluctuation parameter is shown in Fig.
1. In the complete absence of spots on the visible hemisphere of the Sun, on January 1, 2008, a CR predictor from a "behind-the-limb" source was registered. According to data from the Stereo-A spacecraft, on December 31, 2008, two large C8-class X-ray flares were observed on the side of the Sun invisible from Earth. Both flares were accompanied by a coronal mass ejection (CME). A possible source of these X-ray flares could be active region (AR) No 978. This was the only source observed during the previous solar rotation (https://spaceweather.com/archive.php? day=01&month=01&year=2008&view/view), which reappeared on the eastern limb of the Sun only on January 2, 2008. The decrease in the CR count rate began from 4.I.2008 to 5.I.2008. The clearly expressed low, in fact - the MARKER of the shock wave, i.e. - the diagnostic value of the CR fluctuation parameter registered from 4.I.2008 to 5.I.2008 (Fig. 1) definitely indicates the registration of the shock wave at the specified time. Thus, the proposed approach shows a fairly high efficiency both on the 27-day averaging scale and on a smaller, semi-daily averaging scale.
## III. RESULTS
At Figure 2 shows the results of calculating the CR fluctuation parameter for the previous 24th and the beginning of the new 25th cycle. A clearly expressed increase in activity was observed in July 2023: medium-term predictors were registered on rotations No. 2590,
2592 and 2597. Of greatest interest is the precursor on rotation 2597 (4-31.01.2024). Taking into account the forecast lead time $\Delta \tau = 2$ ( $\pm 1$ rotation) of the Sun's rotations, an increase in activity should be expected on rotation 2599 ( $\pm 1$ rotation), i.e. in February-April 2024. Rotation No. 2599 corresponds to the penultimate (bottom right) point of the CR fluctuation parameter - a diagnostic or marker in red. From this it follows that the indicator of the beginning of the maximum of the new 25th cycle can be considered rotations No. 2599 (March 2024).
Indeed, starting from the 3rd ten-day period of February 2024, large X-ray flares of class X1.8 (02/21/2024), X1.7 and X6.3 (02/22/2024) were registered in AO 3590. Before AR 3590 left for the solar hemisphere invisible from Earth, on February 28-29 https://spaceweather.com/images2024/28feb24/filament_CME.gif a flare of a long and complex structure of class M was observed, accompanied by a series of CME.
The beginning of the maximum of the 25th solar cycle from late April to May, which began in the 3rd ten-day period of February 2024, is becoming more active: this was manifested in the increased activity of both hemispheres of the Sun simultaneously. An illustration of this is the appearance of so-called (https://spaceweather.com/images2024/05may24/activity teal.gif) "sympathetic" flares. First, "paired" - in the northern and southern hemispheres), and then serial (https://spaceweather.com/images2024/06may24/m4p5 anim_opt.gif) events registered on the entire visible hemisphere of the Sun simultaneously!
Thus, in the first ten-day period of May, a "paired" (in the form of 2 semi-diurnal values) predictor in the CR fluctuation parameter for May 5-6, 2024 was obtained (Fig. 3). The specified predictor was obtained at the beginning of the day on May 6, and already on the 2nd day - May 8, according to the ACE spacecraft (USA), an increase in the flux of low-energy protons in a wide energy range began - "storm" particles Appendix 3, which usually precede the arrival of shock waves in the Earth's orbit. The high power of this event is most likely due to the cumulative effect [2](Appendix 4), according to foreign terminology: "cannibal effect" [3].
High solar activity in May 2024 continued in October-November. This follows from the results of the subsequent medium-term forecast (Fig. 4). The "double" predictor is registered on rotations No. 2602-2603 in May-June 2024. Indeed, after $\Delta \tau = 2(\pm 1$ rotation) of the Sun's rotations, starting in August (rotation No. 2605) 2024, a long and deep decline in the CR intensity began. This is also indicated by the relatively low (markers), diagnostic average-rotation values of the fluctuation parameter on the extreme rotations No. 2607-2608.
The medium-term forecast is confirmed by the results of operative monitoring (Fig. 5). Indeed, the "double" values of the CR fluctuation parameter from October 4 to 5 and from October 8 to 9, 2024 exceed the "cosmic noise" region, thus being predictors of shock waves. On the contrary, the extremely low values of the CR fluctuation parameter on October 5-6 and October 10-11 are MARKERS of the registration of shocks in the Earth's orbit, which is confirmed by the results of modeling in the NOAA Space Weather Prediction Center (Appendix 5-6). It follows that in October-November 2024 (rotations 2607-2608) the MAXIMUM of the new 25th cycle is registered!
## IV. THE NATURE OF ARRHYTHMIA OF SOLAR CYCLICITY
Earlier, in [4], it was established that the higher the cycle amplitude at the maximum, the shorter the duration of the polarity reversal process, after the completion of which the CR restoration begins. And, conversely, the lower the cycle amplitude, the longer the polarity reversal phase. The inverse dependence of the field inversion process duration on the cycle amplitude revealed by the CR indicates the possible presence of the Invariant of the binary relationship of the 11-year cycle characteristics "amplitude-duration".
We analyzed the relationship between variations in the amplitude and duration of the solar cycle using the language of phase portraits on a complex phase plane using an analytical signal - Fig.
6. The area of the "phase portrait" has the dimension of ACTION, with the dimension of "energy x time" (a "phase volume"). In this sense, for a fixed (in time) cycle, its area is a characteristic of energy-capacity, the change in which from cycle to cycle can be traced, for example, by the change in the relative variation in the solar luminosity, i.e. by the relative variation (https://www.sws.bom.gov.au/Educational/2/1/12) 11-year variability of the "solar constant".
Below is an estimate of the areas of the phase portraits of solar cycles 21-24, i.e. the characteristics of their energy-capacity. The analysis was carried out using the average-annual values of the CR fluctuation parameter. The areas of cycles 21 and 22 are practically identical (Fig. 7). The constancy (invariance) of the area, as a characteristic of energy-capacity, indicates the conservatism or constancy of the area of the 11-year cycle in time (time symmetry) during two consecutive cycles 21 and 22. Conservatism or invariance (in the sense of the binary relationship "amplitude-duration") is violated for the two subsequent cycles 23 and 24.
Violation of the conservatism of the system means the presence of 11-year cycles with different energy-capacity, i.e. with different areas. This is observed in cycles 23 and 24. The maximum area occurs in cycle 23, with a subsequent clear decline in area in cycle 24, starting in 2006 (Fig. 7). It is noteworthy that the relative variation in solar luminosity, as a possible characteristic of the energy intensity of the cycle, also began to decrease in cycle 24, in fact, starting in the same 2006. https://www.sws.bom.gov.au/Educational/2/1/12.
On the other hand, averaging the areas of pairs of adjacent 11-year cycles (starting with 21) preserves the invariance of the areas of pairs of 11-year cycles: 21-22 and 23-24, i.e. the invariance of the areas of adjacent 22-year cycles or their energy-capacities is preserved. This means conservatism (time symmetry) of the dynamic system (the Sun) in a broad sense, i.e. the presence of an INVARIANT with a characteristic scale of the duration of the 22-year cycle. In this case, after a failure of the 11-year cyclicity in the 23-24 cycles, the 11-year cyclicity of solar activity in the next 25 cycle should be restored!
In turn, this should mean the fulfillment of the following physical criterion: the level of CR background radiation in the minimum of the current cycle 25 should be significantly lower than the level of background radiation in the minimum of the previous 24 cycle [5]. In turn, this will mean the fulfillment of the Gnevyshev-Olya rule. This is exactly the situation we observe now if we compare the CR count rate minima in 2014 and 2024 (in yellow ovals in Fig. 2 and Fig. 4). In this case, the value of the current data for 2024 is difficult to overestimate. Their comparison with similar data for 2014 indicates that the failure of the 11-year cyclicity in cycles 23-24 can be confidently attributed to a local failure.
It is important to note that the Lorenz system (according to G.V. Kuklin et al. [7]) is capable of describing various stages of the system's evolution: from the emergence of convection - the appearance of self-oscillations (11-year cyclicity) when the critical temperature value is exceeded, to the disappearance of self-oscillations (entering to the chaotic regime of the "strange attractor") when the temperature decreases. As it happened during the "Maunder minimum", essentially a parametric "phase catastrophe". There are, obviously - extremal cases.
There is also an intermediate situation or ARRHYTHMIA in the cyclic activity of the Sun: a "local" failure, when the invariant of the 22-year cycle is preserved (modern cycles 23-24 and 19-20) and a "global" failure, when the invariant of the 22-year cycle is violated ("Dalton minimum" - Fig. 9) and "Gleissberg minimum"). At the same time, both the emergence and violation of cyclicity are organically linked by a common approach to the cyclic activity of the Sun as a mechanism for regulating energy. In this, in our opinion, lies the nature of solar cyclicity, 11-year and 22-year: solar cyclicity is nothing other than a self-oscillating mechanism of "release" - regulation of energy (in the convective zone) of the Sun, stabilizing its temperature.
## V. CONCLUSIONS
- In the parameter of CR fluctuations, a predictor to the beginning of the maximum of the new 25th solar activity cycle was obtained. Taking into account the value of the forecast lead time $\Delta \tau = 2(\pm 1$ rotation) of the Sun's rotations, the beginning of the maximum of the 25th cycle was predicted for the 2597-th rotation ( $\pm 1$ rotation), i.e. in February-April 2024. The indicator - marker of the beginning of the maximum of the new 25th cycle is a significantly low value of the CR fluctuation parameter on the rotation No. 2599, in March 2024.
- This is confirmed by the results of the operative forecast on May 5-6, as well as October 4-5 and 7-8, 2024, the registration of "storm" particles (preceding the arrival of shock waves to the Earth's orbit) and the fact of the passage of shock waves of the Earth's orbit by the registration of the marker - an extremely low, diagnostic value in the CR fluctuation parameter on May 10-11, as well as 5-6 and 10-11, October 2024.
- The failure in the 23-24 cycles can be confidently attributed to a LOCAL failure, i.e. the 11-year cyclicity of solar activity, begin from the 25th cycle, should be restore!
- ARRHYTHMIA in the cyclic activity of the Sun: a "local" failure, when the invariant of the 22-year cycle is preserved (modern cycles 23-24 and 19-20 and a "global" failure, when the invariant of the 22-year cycle is violated ("Dalton minimum" and "Gleissberg minimum").
- The nature of solar cyclicity (11-year and 22-year) from the standpoint of the INVARIANT of the 22nd cycle: solar cyclicity is nothing more than a self-oscillating mechanism of "release" - regulating the energy (in the convective zone) of the Sun, stabilizing its temperature.
1. Ayvazyan S.A., Enyukov I.S., Meshalkin I.D. "Applied Statistics. Fundamentals of Modeling and Primary Data Processing". Moscow: Finance and Statistics Publishing House.
1983. 313 p.
2. Kozlov V.I. Forecasting Extreme Space-Weather Events on the Basis of Cosmic-Ray Fluctuations // Cosmic Research, 2022, Vol. 60, No. 2, pp. 79-88. ISSN 0010-9525, © Pleiades Publishing.
3. Scolini C., Chané E., Temmer M., Kilpua E.K.J. et al. CME-CME Interactions as Sources of CME Geoeffectiveness: the Formation of the Complex Ejecta and Intense Geomagnetic Storm in 2017 Early September // Astrophysical J. (https://iopscience.iop.org/article/10.3847/1538-4365/ab6216) Supplement Series.
2020. V.
247. N° 1. P. 21-27
4. Kozlov V.I., Markov V.V. "Wavelet image of the fine structure of the 11-year cycle based on the study of cosmic ray fluctuations in cycles 20-23" // Geomagnetism and Aeronomy.
2007. Vol. 47, No.
1. P. 47-55.
5. Kozlov V.I. On the Probable Change of the Status of the Current Unusual Failure of 11-Year Solar Cyclicity from Local to Global // Cosmic Research, 2021, Vol. 59, No. 2, pp. 71-79. ISSN 0010-9525, © Pleiades Publishing.
6. Kozlov V.I., Kozlov V.V., Plotnikov I.Ya. Harbinger of the global minimum of solar activity in the "Space Era" // Report at the 8th Conference of the Space Research Institute of the Russian Academy of Sciences PLASMA PHYSICS IN THE SOLAR SYSTEM. February 4, 2013.
7. Vitinsky Yu.I., Kopetsky M., Kuklin G.V. Statistics of sunspot activity of the Sun. Moscow, Nauka Publishing House. 296 p. 1986.
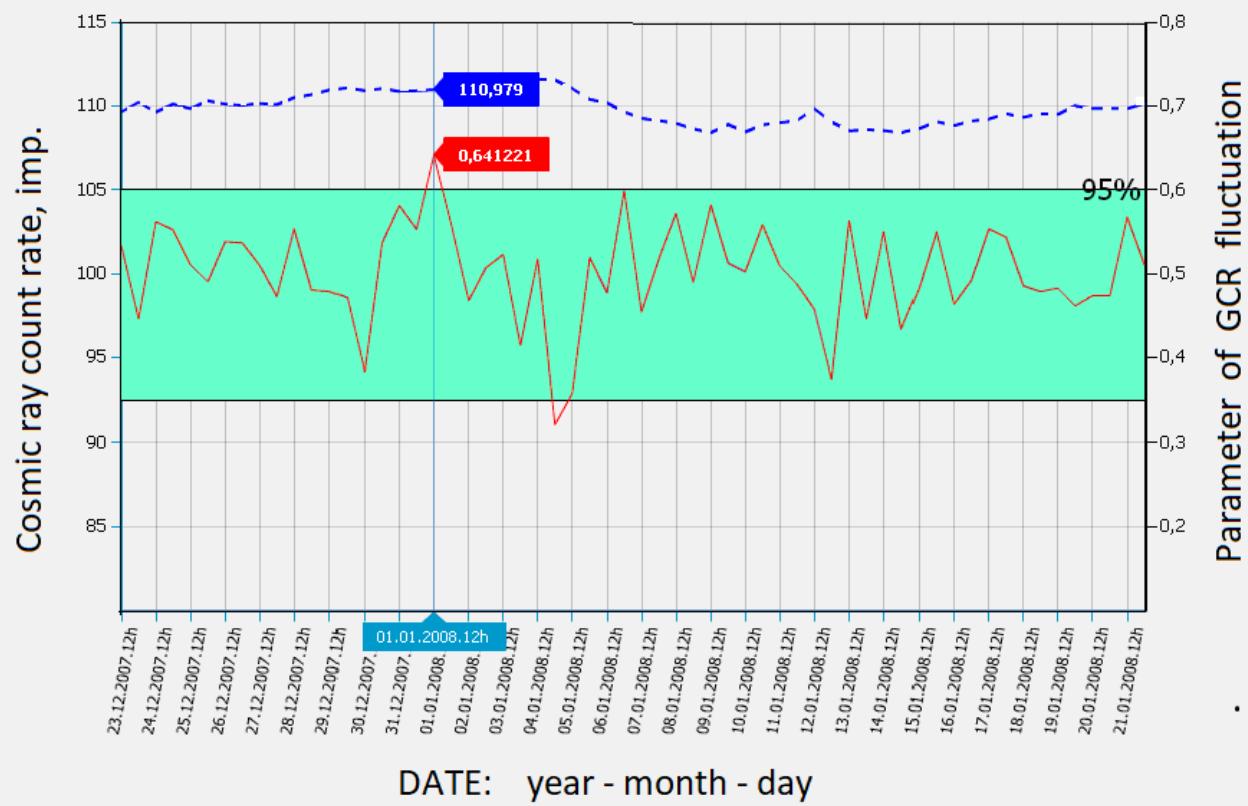
Fig. 1: TEST - calculation of predictor in CR during the appearance on the visible hemisphere of the Sun as the only source of activity. Results of calculation of the CR fluctuation parameter from December 2007 to January 2008 have been obtained using the Cyber-FORSHOCK robotic expert system. The scale on the right corresponds to the values of probability or parameter of fluctuations shown by the(solid curve; the scale on the left corresponds to the count rate in the pulses per 5 minutes (averaged over 12 hours) by data of the neutron monitor at the Oulu station (Finland) shown by the dotted curve. The parameter values placed in the interval: $0.35 < P < 0.60$ - the "cosmic noise" region. On the lower scale the date and time are plotted.
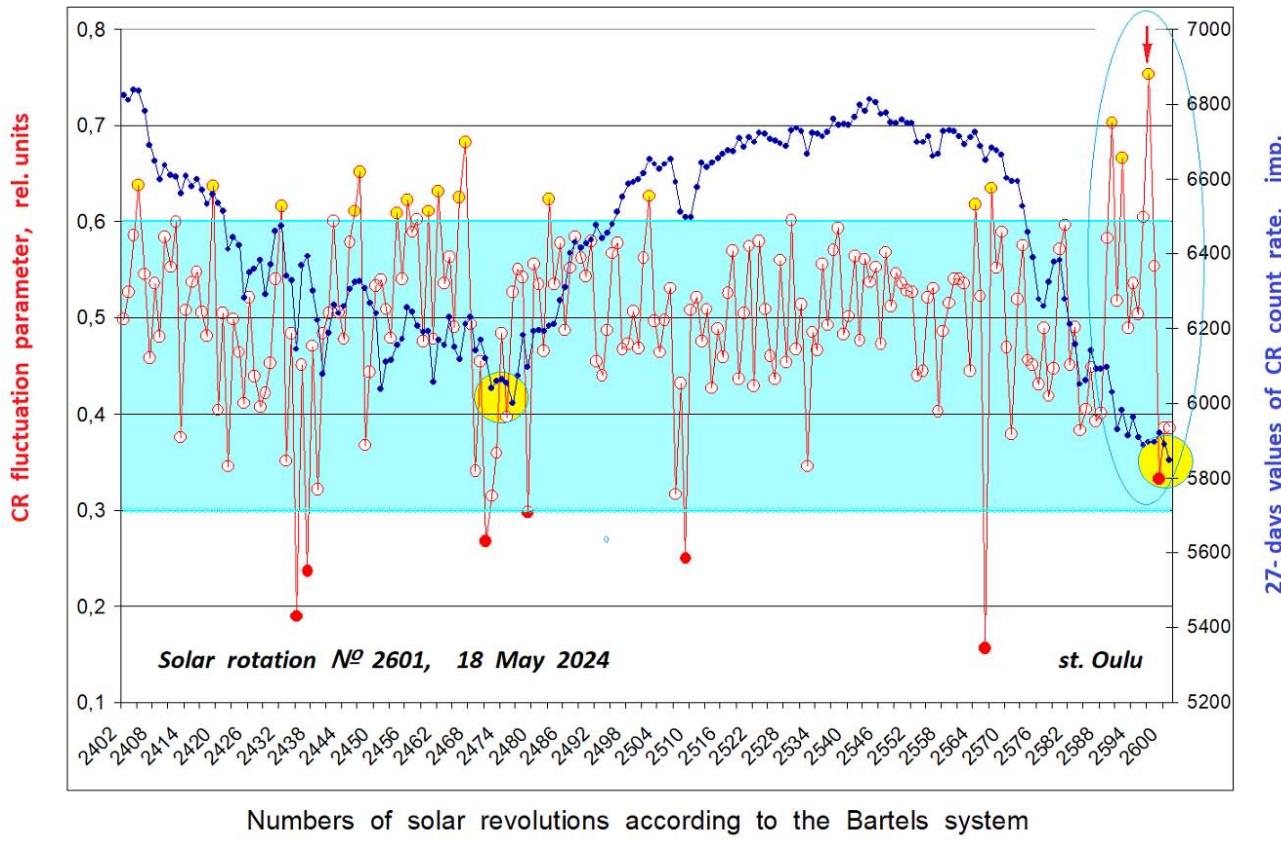
MIDDLE-TERM COSMIC RAY MONITORING Fig. 2: Cosmic ray count rate at the Oulu (Finland) in pulses per 5 minutes averaged over 7776 points of 5-min values during each solar rotation shown by the blue dotted curve, scale on the right. 27-day values of the CR fluctuation parameter in relative units shown by the red solid curve, scale on the left. The $90\%$ significance level is shown. The CR fluctuation parameter values exceeding the "cosmic noise" area (shown by green) are precursors of the increase of solar activity. The precursor of the beginning of the 25th cycle maximum (the late on the right, shown by the vertical red arrow) - is registered on the $\mathsf{N}\mathbb{Q}2597$ rotation. And, on the contrary, a sufficiently low value of the CR fluctuation parameter (the penultimate point in red, the $\mathsf{N}\mathbb{Q}2599$ rotation, March 2024) is defined as - a MARKER of the beginning of the new 25th cycle maximum.
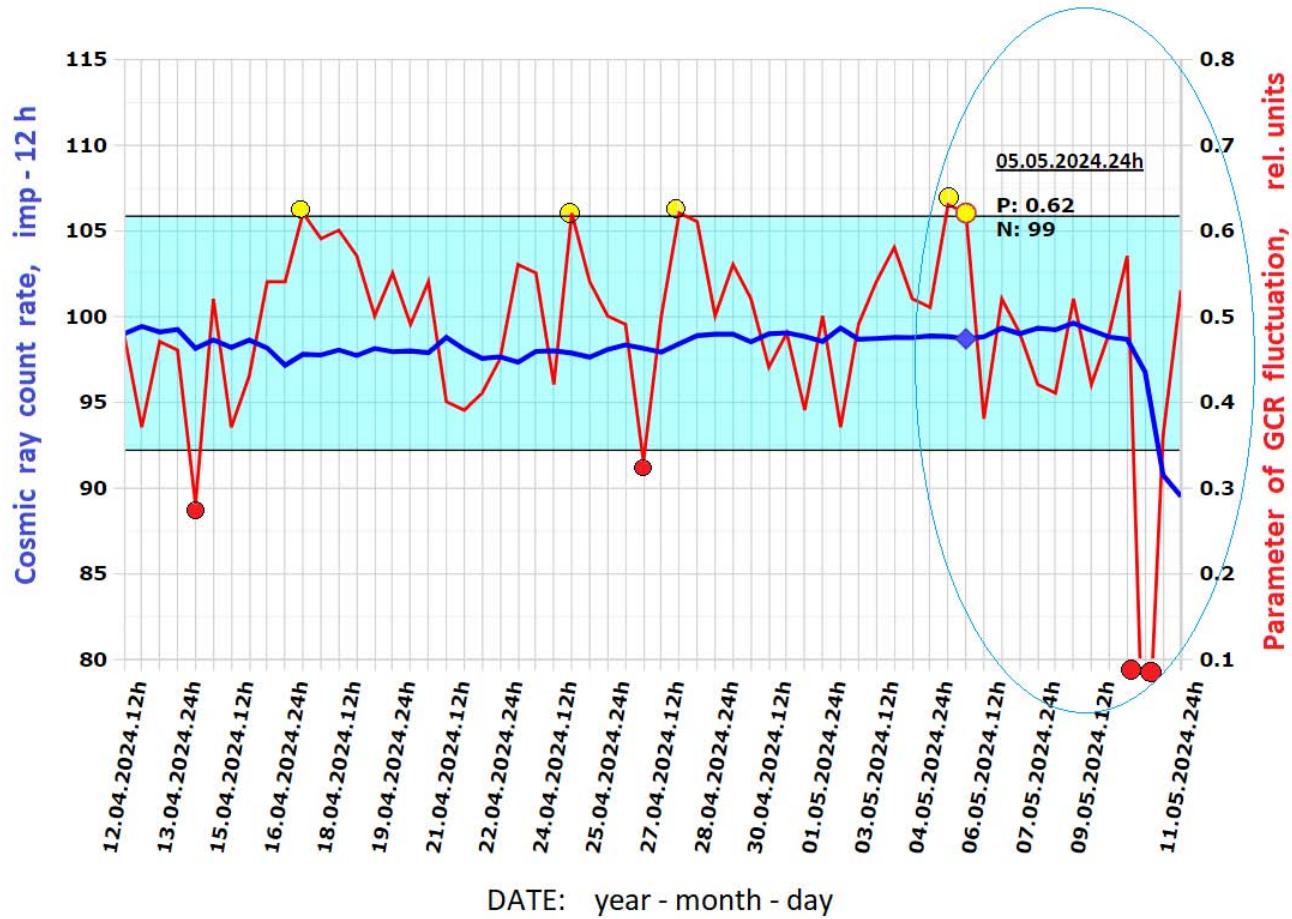
Fig. 3: Results of operational monitoring of cosmic rays in April-May 2024. The scale on the right (the red curve) corresponds to the values of the CR fluctuation parameter; the scale on the left (the blue curve) corresponds to the count rate in pulses per 5 minutes (averaged over 12 hours) by the neutron monitor data from the Oulu (Finland). The parameter values in the interval of $0.35 < P < 0.60$ are the "cosmic noise" area (shown in green). On the lower scale the date and time are plotted. The "paired" values of the CR fluctuation parameter from 5 to 6 May, 2024 exceed the "cosmic noise" region and, therefore, the "paired" parameter of CR fluctuations is a predictor of shock. On the contrary, the extremely low values of the CR fluctuation parameter from 10 to 11 May are a marker of shock registration at the Earth's orbit.
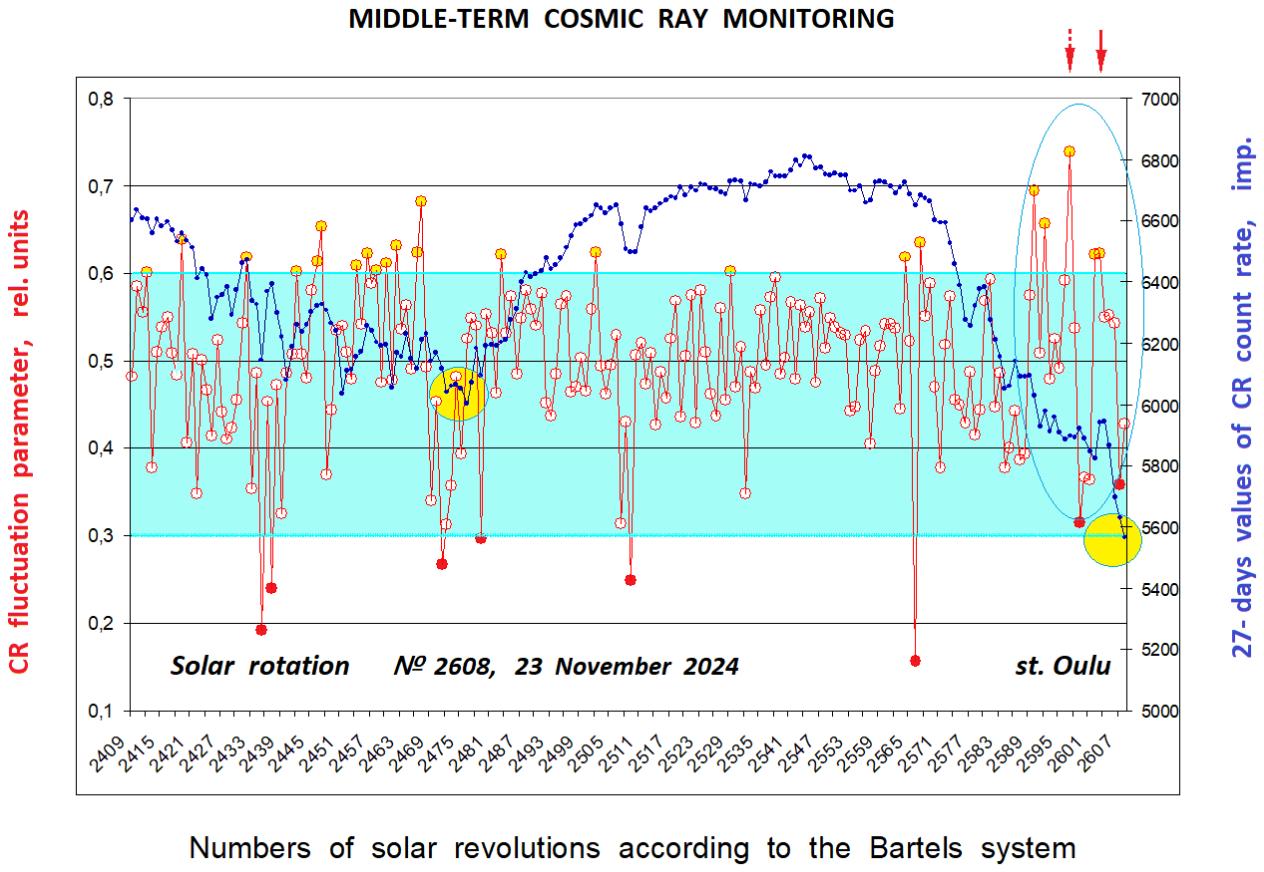
Fig. 4: Cosmic ray count rate at Oulu station (Finland) in pulses per 5 minutes, averaged over 7776 points of 5-min values during each solar rotation - blue dotted curve, scale on the right for the time interval starting from the 2409-2608 rotation. 27-day values of the CR fluctuation parameter in relative units - solid red curve, scale on the left. $90\%$ significance level is shown. CR fluctuation parameter values exceeding the "cosmic noise" region (shown in green) are harbingers of increased solar activity. The precursor of the beginning of the maximum of the 25th cycle - the one on the far right (shown by the vertical arrow - dotted red line) is registered on the rotation $\mathsf{N}^{\mathsf{Q}}$ 2597. The subsequent "double" precursor is registered on rotations $\mathsf{N}^{\mathsf{Q}}$ 2602-2603 in May-June 2024. On the contrary, a fairly low - diagnostic value of the CR fluctuation parameter (the penultimate point in red, rotation $\mathsf{N}^{\mathsf{Q}}$ 2599, March 2024, as well as on the last two rotations 2607-2608), is defined as - a marker of the MAXIMUM of the new 25th cycle.
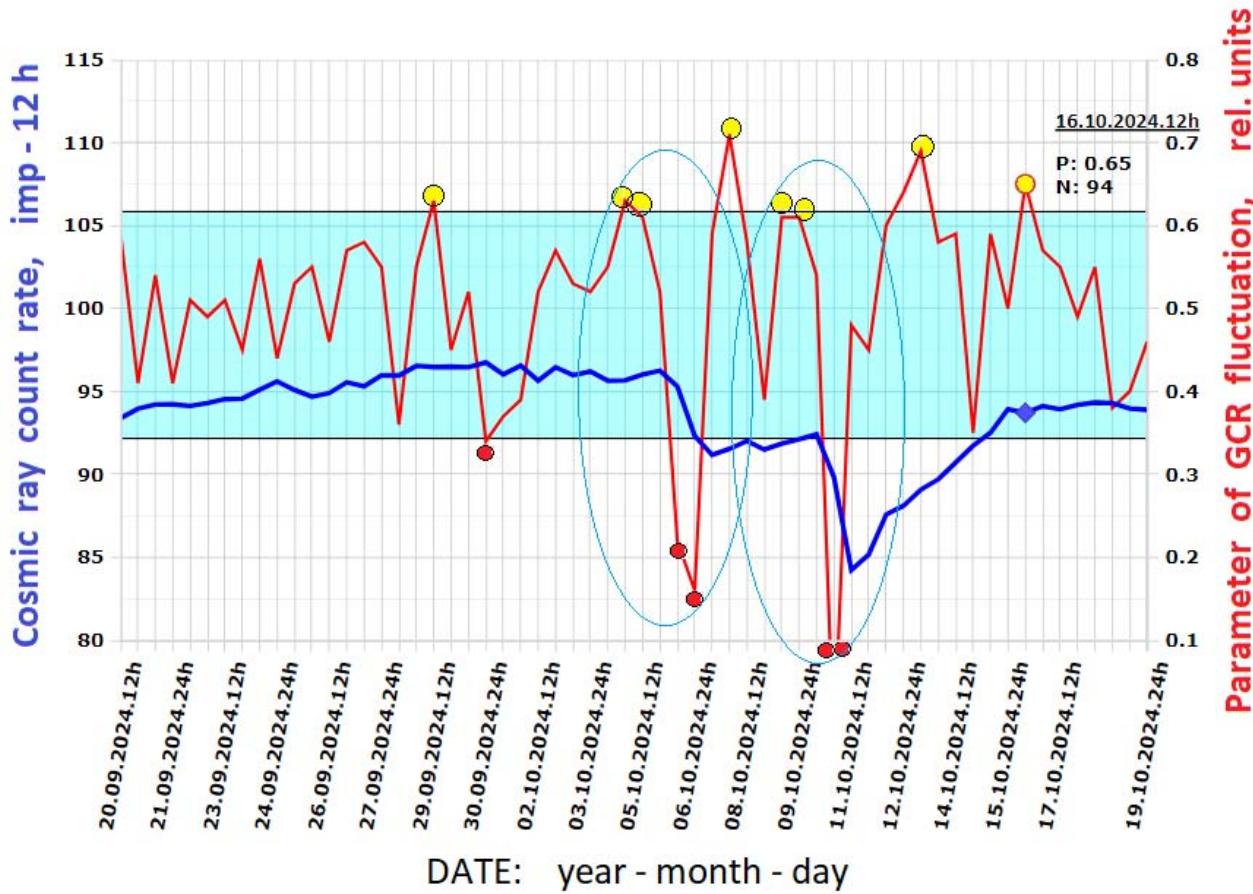
Fig. 5: Results of operative monitoring in September - October 2024. Along the ordinate axis: the scale on the right (red curve) - values of the CR fluctuation parameter; the scale on the left (blue curve) - count rate in pulses per 5 minutes (averaged over 12 hours) according to data from the neutron monitor of the Oulu station (Finland). The parameter values included in the interval: $0.35 < P < 0.60$ - the "cosmic noise" region (shown in green). Along the abscissa axis - date: year - month - day - hour. The "double" values of the CR fluctuation parameter from October 4 to 5 and from October 8 to 9 of this year exceed the "cosmic noise" region and, therefore, the "double" parameter of CR fluctuations is a predictor of shock. On the contrary, the extremely low values of the CR fluctuation parameter from 5-6 and 10-11 October are MARKERS of the registration of shocks in the Earth's orbit.
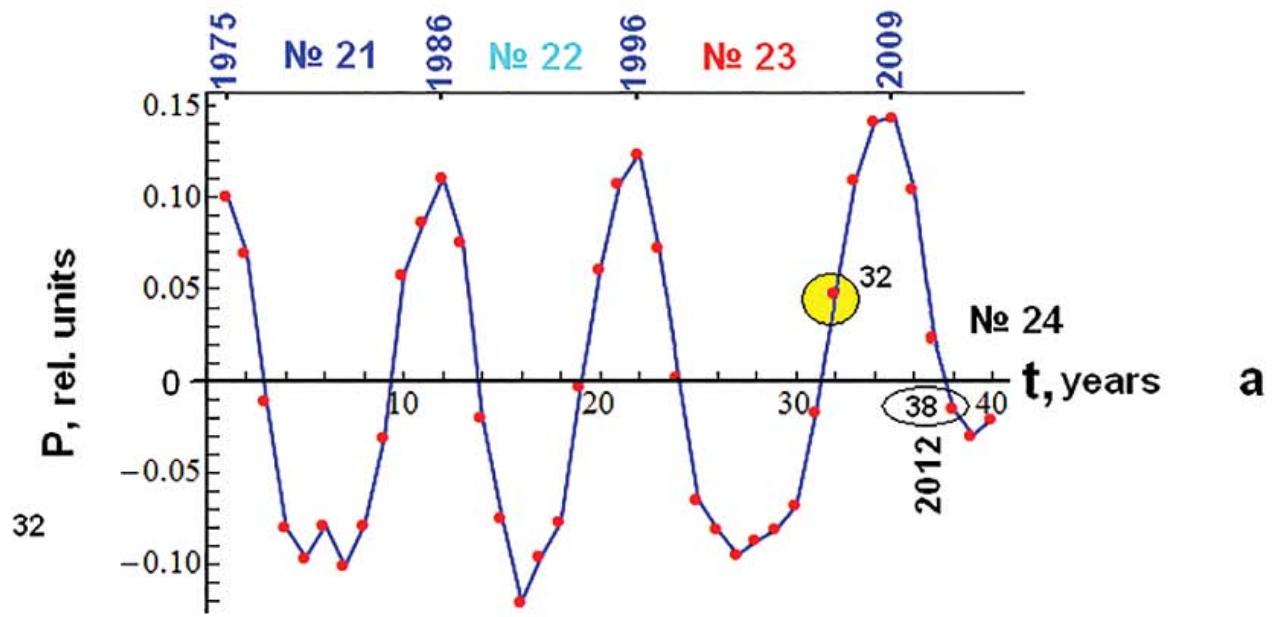
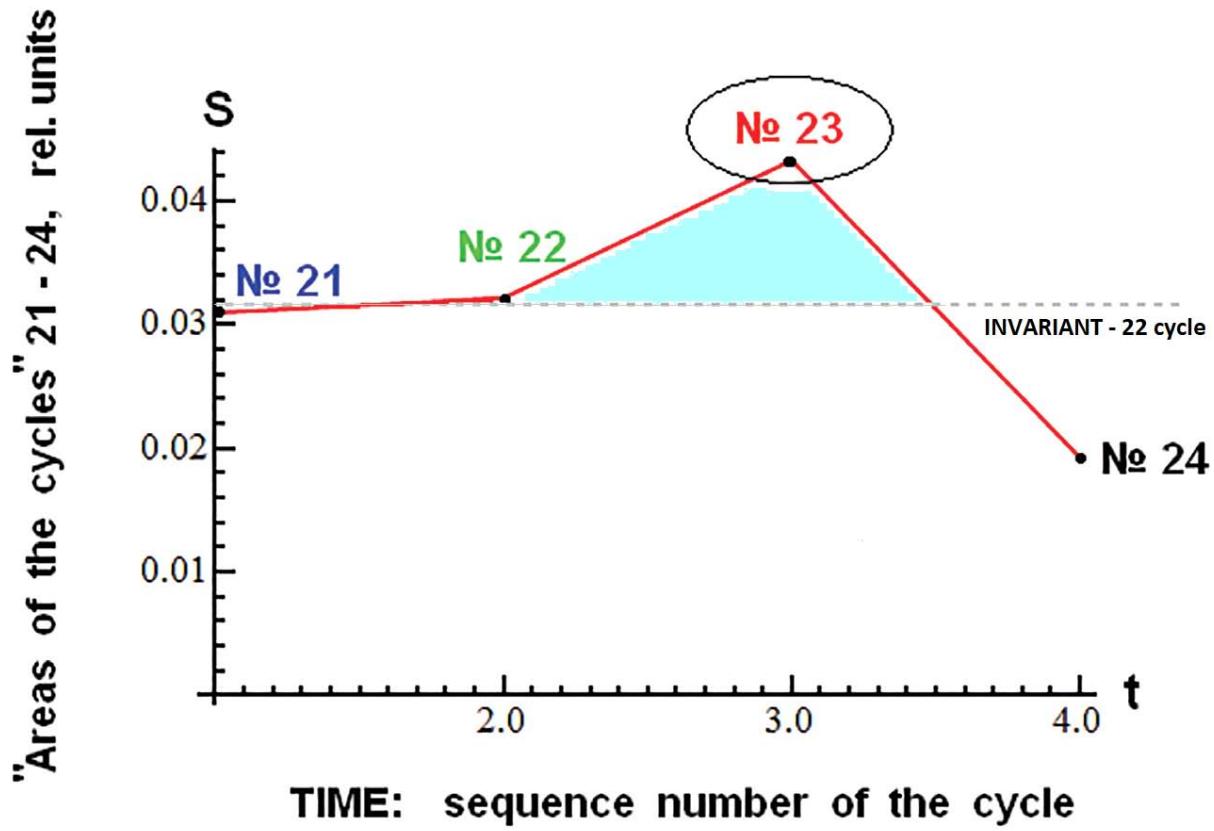
Fig. 7: Estimation of the areas swept under the curves of the 21-24 cycles of 11-year duration (for 1975-2014) by their "phase portraits" calculated by the annual average values of the CR fluctuation parameter. The horizontal line (shown by dots) represents the level of constancy of the average value of the areas of pairs of the adjacent 11-year cycles, i. e. the INVARIANT level of the 22-year cycle. The 23rd cycle has the largest area. The largest area of the $23^{\text{rd}}$ cycle is a predictor of LOCAL failure of the 11-year cyclicity.
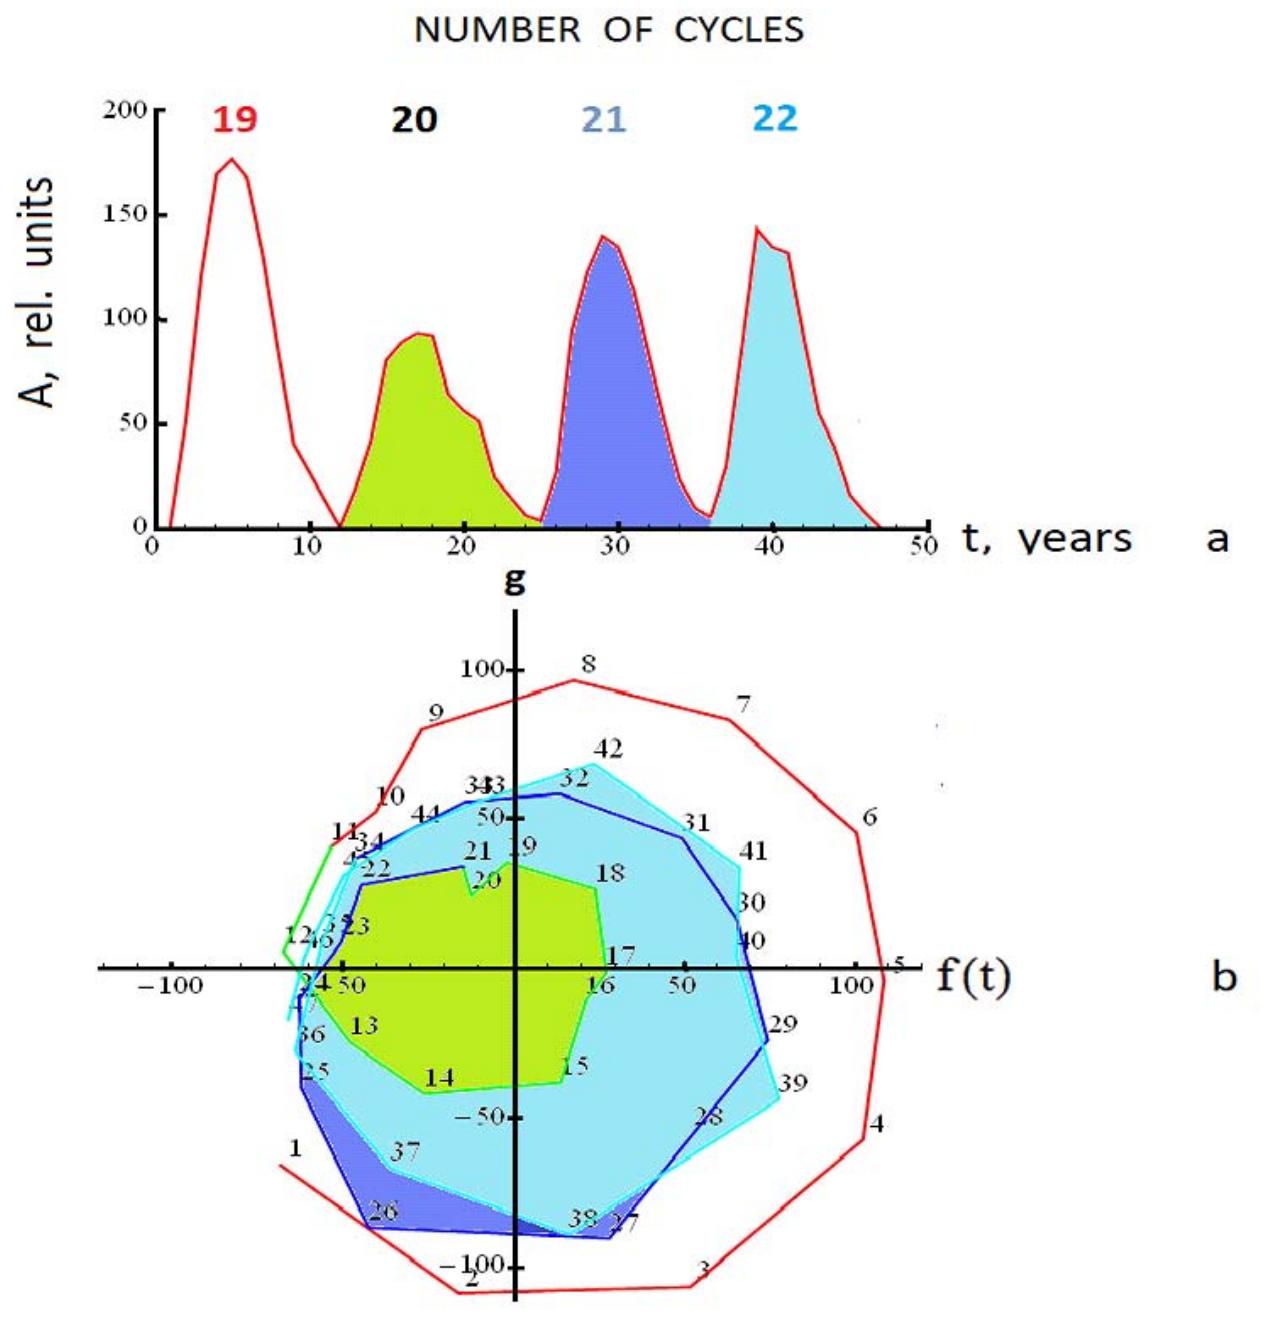
Fig. 8: "Phase portraits" of the 4 cycles
$\mathsf{N}^{\mathsf{0}}$ 19-22, calculated by the annual average values of number Wolf. At the top there is the time dependence of the annual average values of number Wolf. The numbers of the corresponding cycles are shown. The 19 cycle has the largest area. The largest area of the 19 cycle is a precursor of a non-ordinary disruption of the 11-year cyclicity, i.e. a predictor of the LOCAL failure non-ordinary disruption of the 19-20 cycles.
Weibull distribution function:
$$
\mathbf{F}(\mathbf{x}) = 1 - \exp \left\{ - \left[ (\mathbf{x} - \theta) / b \right]^{\mathrm{C}} \right\}
$$
where
$$
\mathrm{e} < \mathrm{x}, \mathrm{b} > 0, \mathrm{c} > 0
$$
- b - scale parameter
- c - shape parameter
- position parameter
Distribution function density:
$$
f(x)=c/b^*\left[(x-\theta)/b\right]^{c-1}*\exp^{\wedge}\{-\left[(x-\theta)/b\right]^c\}
$$
Reliability function:
$$
R (x) = 1 - F (x)
$$
Hazard function:
$$
h(\mathbf{x})=\mathrm{f}(\mathbf{x})/\mathrm{R}(\mathbf{x})=\left[\mathrm{c}\cdot(\mathbf{x}-\theta)^{(\mathrm{c}-1)}\right]/\mathrm{b}^{\mathrm{c}}
$$
h (t)
h (c)
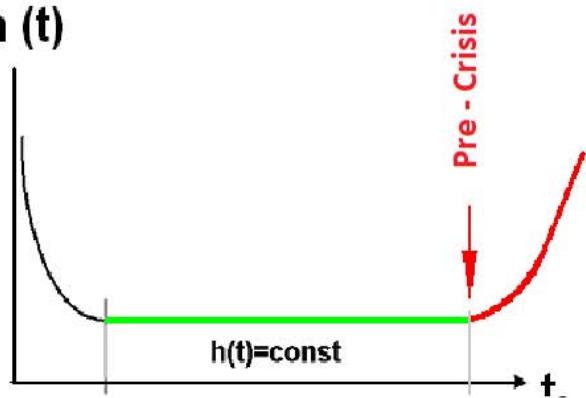
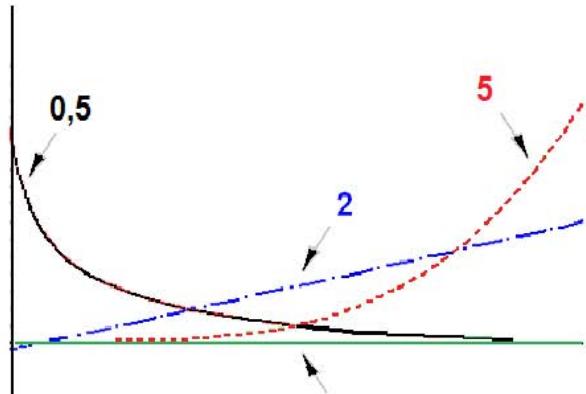
Appendix 1: Mathematical expressions (and corresponding function graphs) used to calculate the CR fluctuation PARAMETER based on the parameter values of the shape (c), scale (b) and shift $(\Theta)$. The rapidly decreasing value of the Risk function at the value of shape parameter $c = 0.5$ corresponds to the "break-in" period of a complex dynamic system. The horizontal line of the Risk function (green) corresponds to the "normal" operation mode of the system. The value of parameter of the shape $c > 3$ and higher $(c = 5)$ is the reaching of pre-crisis state of the dynamic system (a mode before the pre-catastrophe) shown by the red section of Risk function curve.
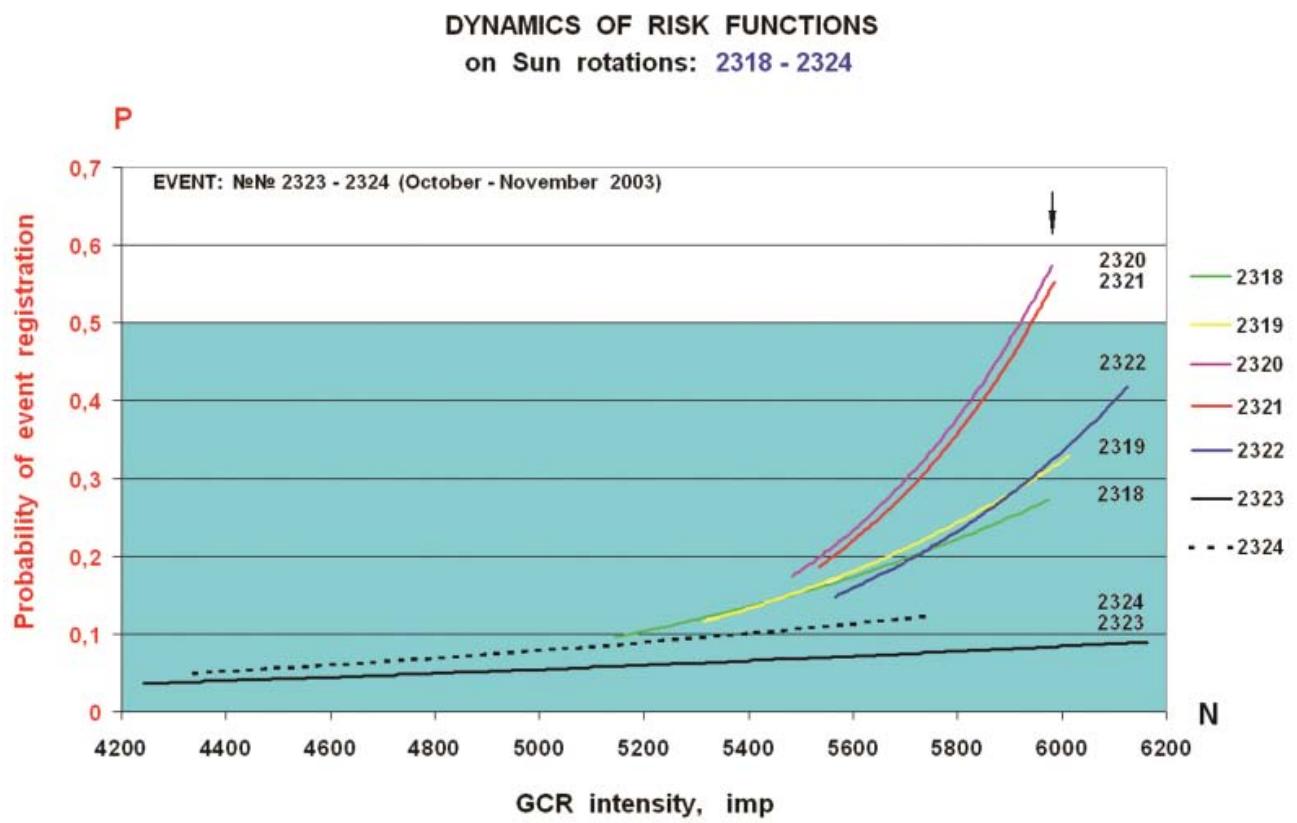
Appendix 2: The calculation of parameter fluctuations CR (function RISK) was carried out for 7 solar rotations: first, for 5 rotations 2318-2322 preceding the extreme events on rotations 2323-2324, and then directly during the specified active phase of the solar cycle. From the calculation results it follows that significant $(P > 0.5)$ values of the maximum of the Risk function - predictor, were detected in July-August 2003 (rotations 2320-2321).
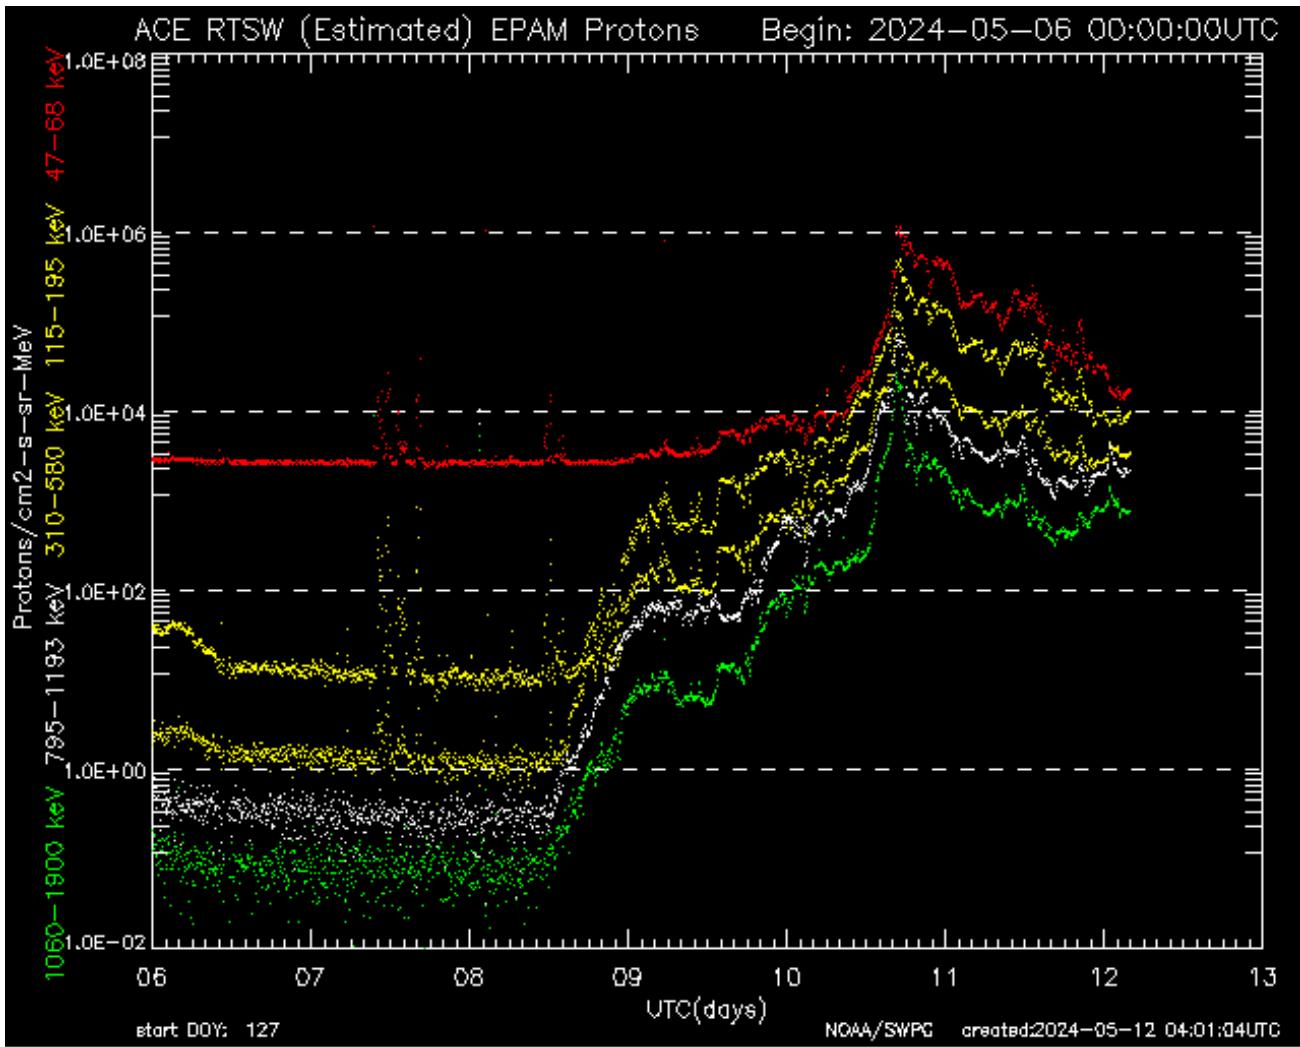
Appendix 3: Fluxes of "storm" particles with the energy $\varepsilon \approx 50 - 2000\mathrm{keV}$ by the data from the ACE spacecraft for May 6-12, 2024
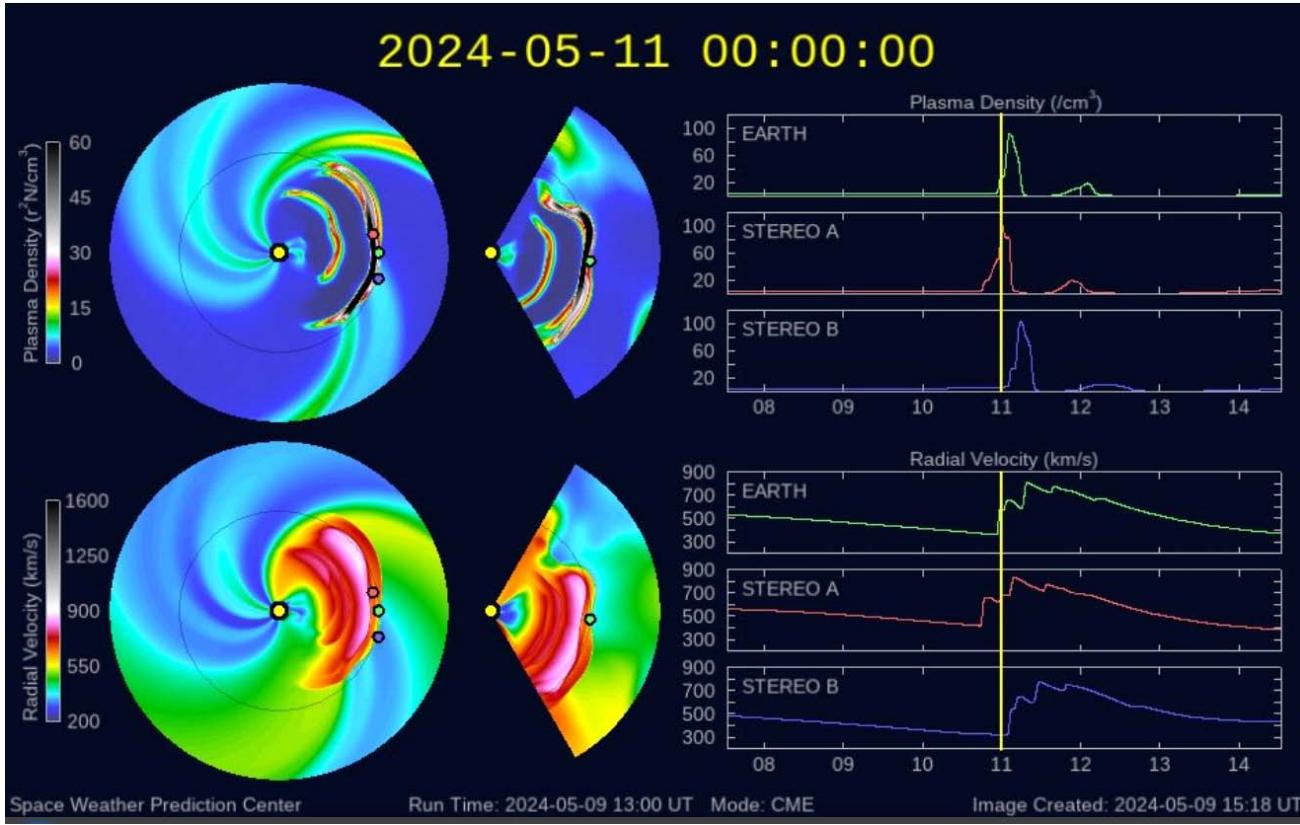
Appendix 4: Results of simulation of the situation on May 8-11, 2024 at the NOAA Space Weather Prediction Center. The shock wave crosses the Earth's orbit for May 10-11 that confirms the presence of marker in the CR. The marker is the extremely low diagnostic value of the CR fluctuation parameter. The simulation results are a good illustration of cumulative effect ("cannibal effect" according to foreign terminology) of the shock interaction.
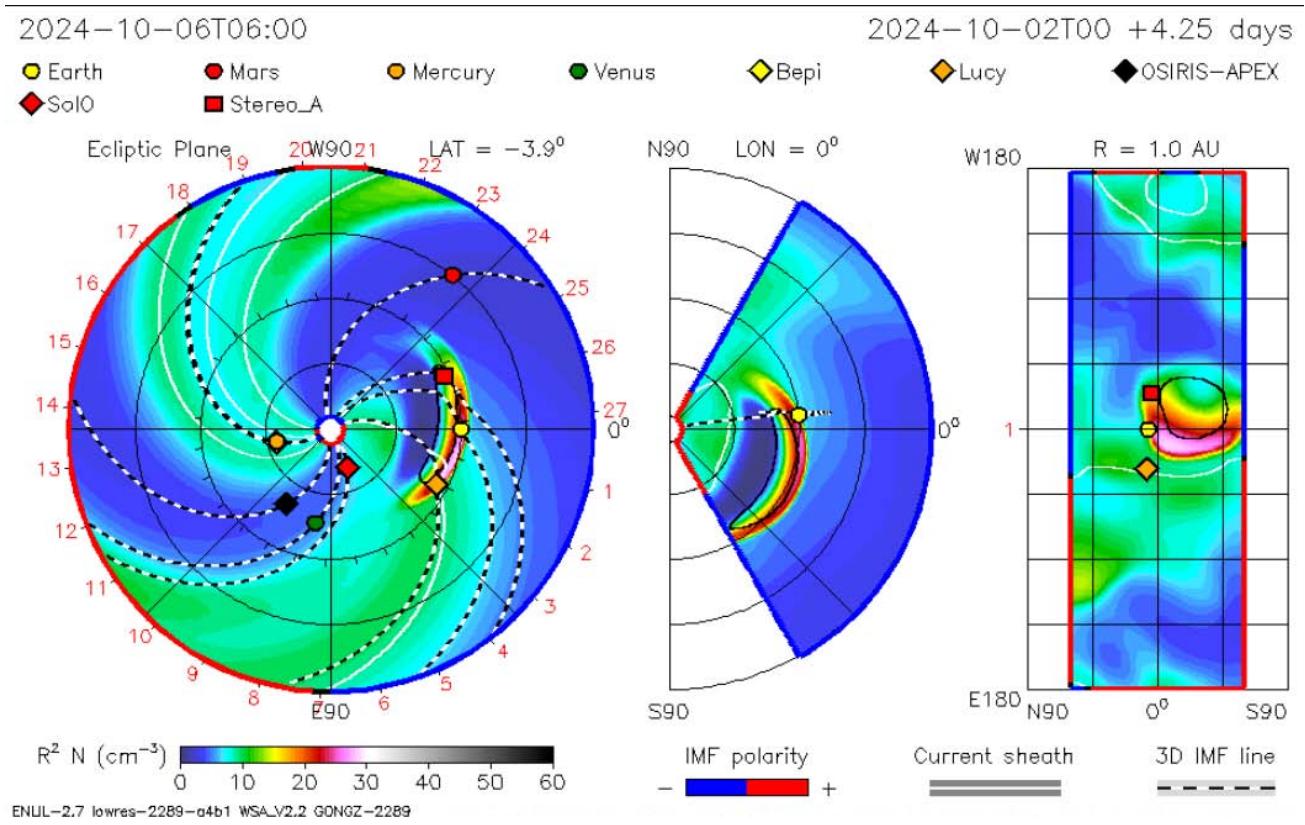
Appendix 5: Results of simulation of the situation on October 4-6, 2024 at the NOAA Space Weather Prediction Center. The shock wave crosses the Earth's orbit for October 5-6 that confirms the presence of marker in the CR. The marker is the extremely low diagnostic value of the CR fluctuation parameter.
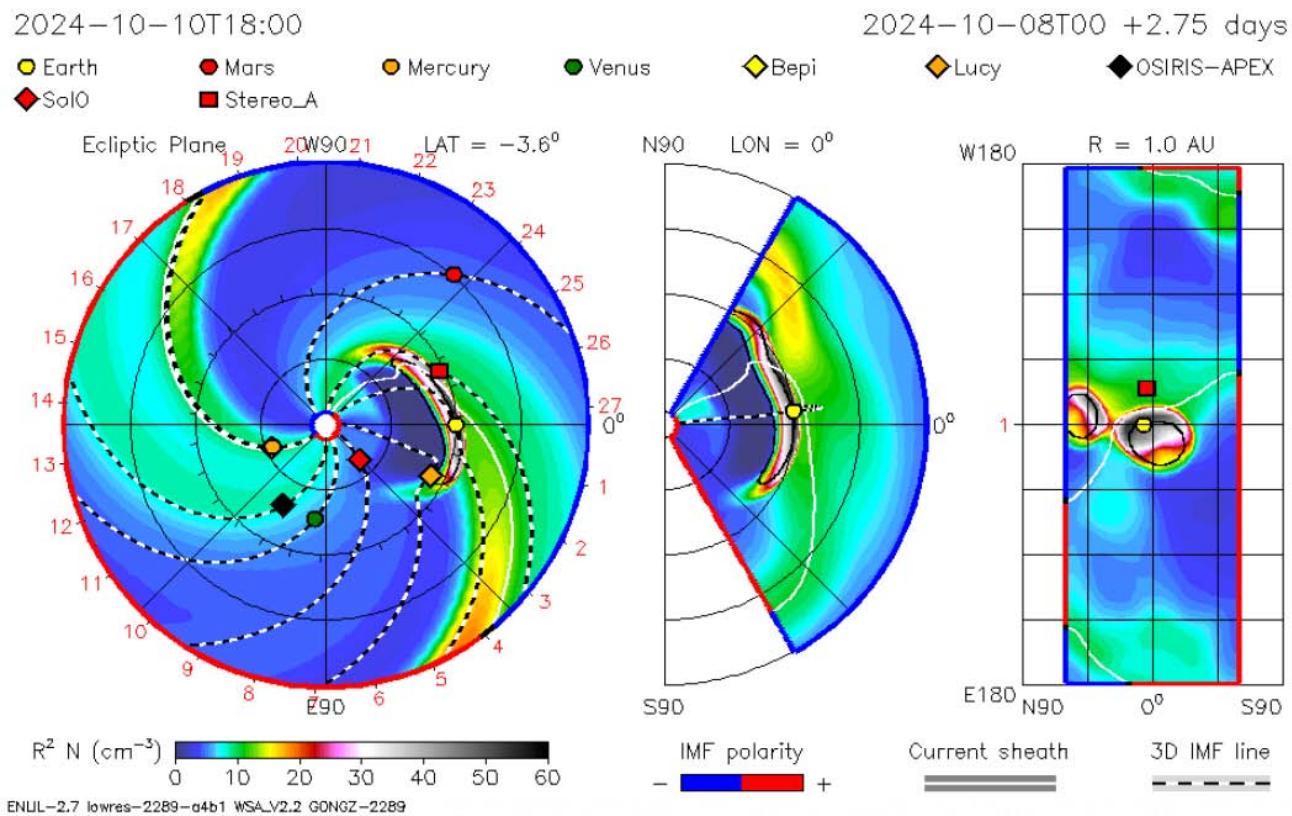
Appendix 6: Results of simulation of the situation on October 8-11, 2024 at the NOAA Space Weather Prediction Center. The shock wave crosses the Earth's orbit for October 10-11 that confirms the presence of marker in the CR. The marker is the extremely low diagnostic value of the CR fluctuation parameter
Generating HTML Viewer...