Introduction
An urban forest inventory is a meticulous compilation of data on trees in urban environments, including street trees, trees in parks and gardens, small or fragmented woodlands, and solitary trees (Konijnendijk et al., 2006; Gala & Boakye, 2020). It involves a systematic collection, documentation, and analysis of information about urban tree species, location, diameter at breast height, height, canopy size, crown condition, health status, structural defects, pest or disease symptoms, and maintenance needs (Morgenroth & Östberg, 2017). Globally, urban tree inventories have been employed to study, quantify, and model the complex ecosystem services of urban forests, thereby driving scientific research in climate change mitigation, urban biodiversity, and public health (Miller et al., 2015; McPherson et al., 2016). It also quantifies the ecological, social, and economic advantages conferred by trees, including biodiversity support, carbon sequestration, pollution reduction, urban heat mitigation, recreational opportunities, and long-term climate resilience (Pataki et al., 2021; Morton Arboretum, 2022). The presence of healthy, well-distributed trees in the neighborhood can mitigate localized flooding by enhancing soil infiltration and reducing stormwater runoff, thereby constituting a vital element in climate resilience strategies (Nowak, 2010; Berland et al., 2017; McKenzie, 2022). The predominant urban tree species in the Midwestern United States include Maple, Honey Locust, and Crabapple, along with smaller numbers of Eastern Cottonwood and Mulberry (Bentrup & Dosskey, 2022).
Chicago boasts one of the largest and most diverse urban forests in the United States, comprising millions of trees distributed across streets, parks, private lands, and remaining natural areas (Nowak, 2010; Morton Arboretum, 2022). The monitoring and management of this forest are crucial for advancing understanding of the city’s neighborhood-scale urban forest structure, canopy inequality, tree health vulnerability, and environmental and green infrastructure planning. Numerous studies (e.g., Nowak & McPherson, 1993; Nowak et al., 2013; Nowak & Greenfield, 2018) have produced varied findings from comprehensive citywide urban tree inventories, with implications for quantifying and analyzing ecosystem services alongside maintenance requirements. For instance, Nowak et al. (2013) estimated that there are approximately 157,142,000 trees in the Chicagoland region, whereas the city itself contains an estimated 17 million trees (Nowak, 2010; Morton Arboretum, 2022). These trees provide an approximate canopy cover of 16% in the Chicago metropolitan area, although this coverage varies substantially across neighborhoods: some highly vegetated areas reach 50%, while others fall below 5%. The Chatham neighborhood was reported to have a coverage rate of 8.5%, placing it at the lower end among Chicago neighborhoods (Morton Arboretum, 2022; Robinson, 2023; Li & Sharma, 2024). The city is documented to comprise approximately 103 tree species, of which 37% are native to Illinois (Morton Arboretum, 2022). In addition, Morton Arboretum (2022) identified a decrease in the city’s canopy coverage from 19% in 2010 to 16% in 2020, primarily attributable to the loss of mature ash trees caused by invasive pests and heightened competition from invasive European buckthorns. Municipal data, including 311 service requests, have further underscored issues such as pest infestations, broken branches, and pruning requirements, thereby indicating potential declines in the health of the existing urban canopy (City of Chicago, 2022). Together, these efforts demonstrate that Chicago’s tree inventories are essential to foster maintenance and management that helps their upkeep for providing services that improve air quality, cool neighborhoods during extreme heat events, and reduce flood risks, services particularly vital in a city vulnerable to climate-related challenges, such as the 1995 heatwave.
Nevertheless, much of the current knowledge is derived from citywide inventories and analyses that yield important averages, which tend to obscure variability across neighborhoods. Localized dynamics, such as those within the Chatham community, remain insufficiently examined in this scheme, despite their significance for addressing equity issues and enhancing neighborhood resilience. For instance, Nowak et al. (2008) developed a ground-based methodology to assess forest structure and services in Chicago, whereas McPherson et al. (2016) quantified the economic and ecological value of street trees throughout the city. These studies have significantly contributed to understanding urban tree benefits at the city scale; however, they offer limited insight into intra-neighborhood variation and the role of trees in mitigating localized flooding risks. Additionally, recent studies have begun integrating advanced technologies, such as high-resolution remote sensing (LiDAR), to map canopy structures (e.g., Alonzo et al., 2016; Li & Sharma, 2024) and yet few studies have combined LiDAR data with comprehensive field inventories at the neighborhood level to transition from citywide averages to a more detailed understanding of how urban forests contribute to climate adaptation and resilience in vulnerable communities.
Therefore, the goal of this study is to develop a comprehensive neighborhood-scale urban tree inventory for the Chatham neighborhood in Chicago using an integrated approach that combines field sampling, trees crown-health assessments, and high-resolution LiDAR data. Specifically, the objectives were to characterize the distribution, species diversity, composition, and structural attributes; assess tree health and crown characteristics; and measure canopy area, tree height, tree density, and canopy density using high-resolution LiDAR data. By addressing these objectives, the study seeks to compile data that may help understand trees contributing to the neighborhood’s climate resilience, environmental quality, flood mitigation, and neighborhood greening strategies, and to support efforts towards urban forest management and planning in a vulnerable South Side Chicago community.
Data and methods
Site Description
The study was conducted in Chatham, one of the 77 community areas of Chicago, on the city's South Side (41°44.36′ N, 87°36.94′ W). The Chatham Community Area covers 7.56 sq. km and was originally a swampy area known as "Mud Lake." This community extends from 79th Street in the north to 95th Street in the south, and is geographically bounded by S. Wallace Street, S. Stewart Avenue, and S. Holland Road to the west, as well as S. Dauphin Avenue and the Metra railway tracks to the east. The area was initially settled by railroad workers and subsequently developed into a middle-class neighborhood featuring a diverse array of housing styles (see Figure [fig:chatham-neighborhood]).
The Chatham neighborhood possesses a significant historical significance as a stronghold of the African American community, with more than 95% of its population identifying as Black (Hunley, 2019; Hunley & Gala, 2020). According to Elwood (2006), the population of Chatham comprises 30,783 residents and 14,957 households. In recent years, the neighborhood has offered opportunities and options for low-, middle-, and high-wage households, supported by 5,373 businesses that employ 28,501 individuals and attract approximately 2 million visitors annually. The number of households in Greater Chatham increased by 0.8%, rising to 47,950 in 2020 from 46,444 in 2015, reflecting a net gain of 1,506 households. This growth aligns with the City of Chicago's overall population increase, which rose by 1% from 2.724 million in 2015 to 2.746 million in 2020. The educational profile of the Greater Chatham area indicates relatively high educational attainment, with 20 percent of residents holding a bachelor's degree or higher. However, the area has a 30% unemployment rate, compared to Chicago's overall rate of 22% (Vasović, 2020). Correspondingly, the area has experienced rising poverty levels, with the percentage of households living in poverty increasing in recent years to over 30 percent, compared with the overall city rate of approximately 10 percent (Toussaint-Comeau & Newberger, 2017).
Chatham Neighborhood, Chicago
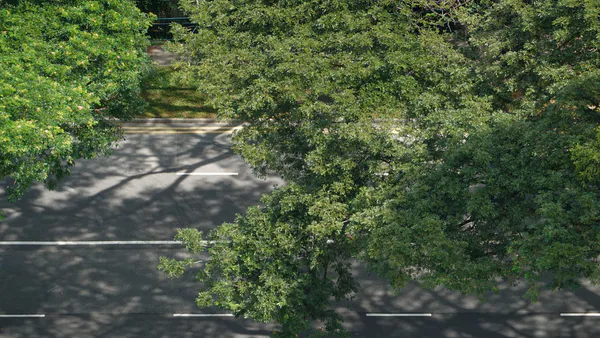
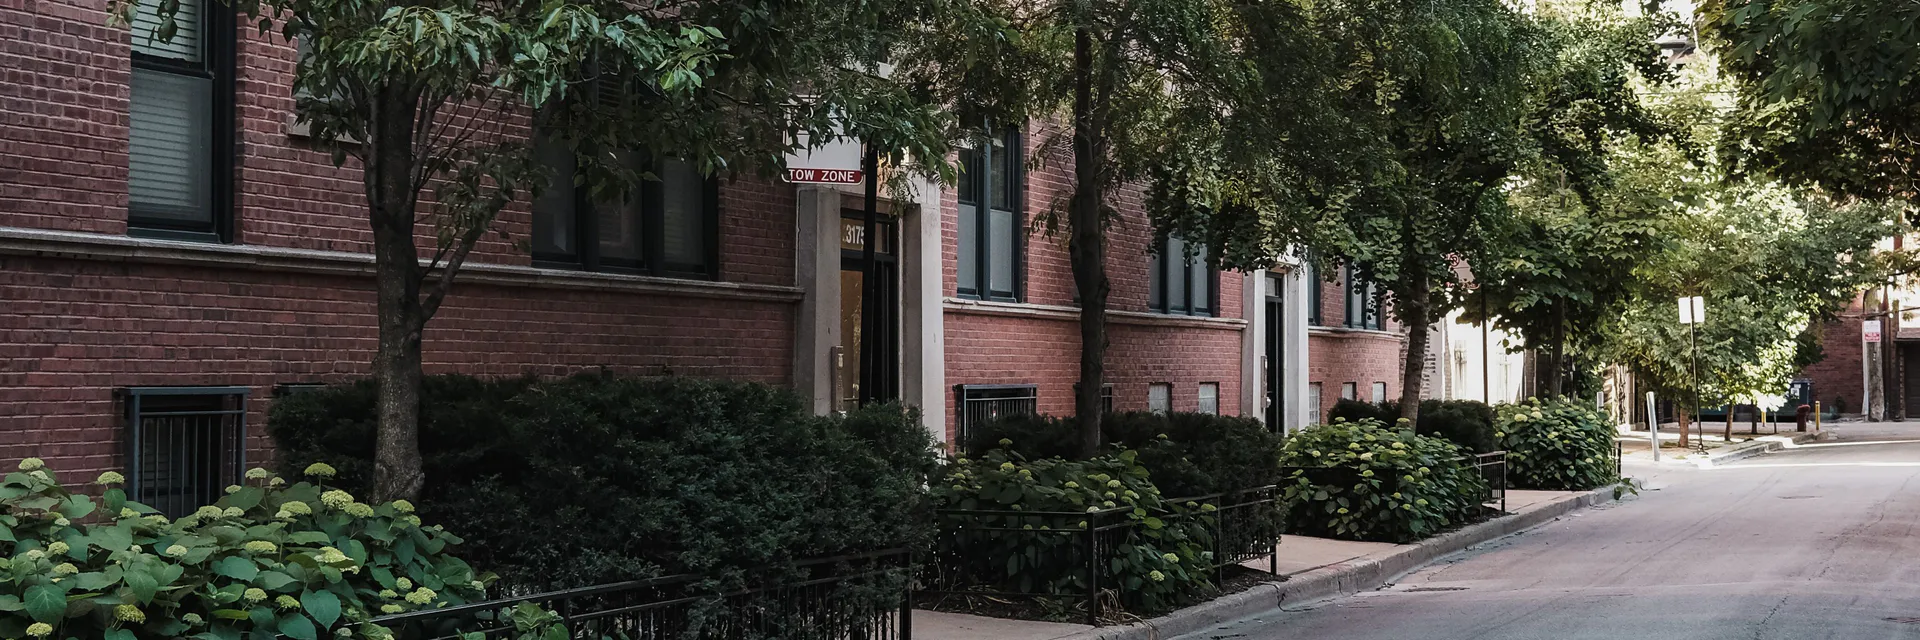
Approximately 36.3% of the land area, corresponding to 684 acres, is designated for transportation purposes. Just 2.2% and 3.4% of the land are occupied by open and vacant spaces, respectively (Chicago Metropolitan Agency for Planning, 2023). Land uses include residential neighborhoods, schools, churches, community gardens, public parks, and open spaces, all of which host a variety of tree species and green space. The region is distinctive in its high proportion of transportation infrastructure (36%) and a comparatively low percentage of open or vacant land (less than 6%), which constrains opportunities for new tree planting (Figure [fig:representative-trees]). Additionally, the area is particularly vulnerable to flooding, owing to its low elevation and a landscape comprising over 50% impervious surfaces (Vela, 2024; Lee et al., 2025). Notwithstanding these challenges, the neighborhood holds potential for greening initiatives, especially within existing open spaces, which could also aid in flood mitigation. Escalating weather phenomena, such as intense rainfall, exacerbate existing flooding, leading to property damage and financial losses for residents (Sinha, 2023; McKenzie & Gala, 2023). In the case of Chatham, the decline of mature ash trees due to disease and pests, amid current tree-planting strategies, may result in the loss of these trees at an irreparable rate (Brandt et al., 2016).
Representative pictures of trees within the Chatham neighborhood
Data Description, Acquisition, and quality control
This study integrated multiple datasets to characterize tree distribution, types, composition, and structure; assess tree health indicators and crown conditions; and quantify canopy area, tree height, and tree and canopy density across the Chatham neighborhood. Data sources included field-based measurements, crown-health assessments, community surveys, and high-resolution remote sensing products. Details of the tools used for the field survey, the specific parameters measured, and their application within the study are provided in Table [tab:measurement-tools].
| Method/Tool | Instruments Used | Measurable Parameters | Application Focus | Notes |
|---|---|---|---|---|
| Field Measurement & | Morton Arboretum field key, USDA Forest Services species sheets, and the HTHC field guide | Tree species, health indicators (disease, dieback, defoliation, discoloration, gulls, pest/insect damage, exudation, bark fissures, cracks, wounds), crown characteristics (vigor, transparency, light exposure) | Standardized digital data collection in the field; Basic tree inventory; tree health assessment | Form allows efficient data storage and consistency |
| Smartphone (iPhone 12 camera) | Survey123 Mobile Form iPhone 12 photo + notes | Crown condition, canopy transparency, and visual risk indicators | Visual documentation; photographic record for later verification | Useful for crown health verification and transparency analysis |
| LiDAR (GIS/Remote Sensing) | LiDAR dataset | Tree height, canopy coverage, canopy area, tree count | Mapping urban forest structure: canopy-flood relationship | Provides large-area coverage, useful for flood risk modeling |
Tree measurement tools, measurable parameters used in the Chatham
LiDAR-based assessment of Tree Structure
The High-Resolution LiDAR was acquired from the Illinois Height Modernization project (ILHMP) (Illinois Height Modernization 2021). The LiDAR scan of the city of Chicago was collected in late spring 2017. At each point, the LiDAR recorded the longitude, latitude, and elevation at every 0.35 m, which were the heights of grounds (bare surface), vegetation, buildings, water, and other infrastructures, which were classified into ground points, which were used to derive the digital terrain model, and maximum elevation points, which represented the digital surface model (DSM). Vegetation and building heights are differentiated using building vector data from the Chicago Metropolitan Agency for Planning (CMAP) and normalized difference vegetation index (NDVI) from multispectral satellite imagery. Detailed processing workflow for LiDAR point cloud data, classification into digital terrain model (DTM) and digital surface model (DSM), and the validation data found in Li & Sharma (2024). The processed LiDAR data was resampled to 1 m × 1 m resolution to estimate tree height, canopy structure, and building height for the entire city of Chicago. The LiDAR cloud point dataset has been widely used for urban tree inventory and canopy structures to study the ecological services of urban green infrastructure (Guo et al 2020; Li & Sharma, 2024). The tree and building height data were generated after validation for quality against Chicago's existing building and tree database.
Mapping Tree Density and Canopy Density Utilizing Kernel Density Estimation in ArcGIS Pro. To analyze tree and tree canopy densities, a GIS-based Kernel Density Estimation algorithm (Wang et al., 2020) within ArcGIS Pro was employed. This algorithm generates an aerial surface illustrating the number of trees or canopies within designated areas (e.g., 1 acre, ~ 4046.86 sq. meters with a dimension of ~ 64 m * 64 m), thus distinguishing areas with higher density from those with lower density. Beyond vegetation analysis, such GIS-based Kernel Density estimation has also been applied to examine the spatial distribution of public services, including schools (Lobban et al., 2025), the dispersion of air quality sensors (Pawlowski, 2025), and environmental hazards (e.g., Li et al., 2025). The following section provides the algorithm used to compute the density of trees and tree canopies.
Where
i = 1,…,n are the Trees and Tree Canopies density. Only include points in the sum if they are within the radius distance of the (x,y) location.
popi is the value of the Trees and Tree Canopies density i, which is an optional parameter.
disti is the distance between the Trees and Tree Canopies density i and the (x,y) location where density would be predicted
Radius = 1000 meters. The distance (area) to which the density is calculated.
The visual evaluation of tree heights, density, and canopy coverage was conducted through map interpretation. First, tree heights, individual trees, and canopy density were interpreted using an image processed with histogram equalization, which adjusts pixel values across the available display range. Subsequently, the canopy area map was produced by classifying the area data into five categories using the Natural Breaks (Jenks) classification algorithm in ArcGIS Pro. This algorithm groups data along the vector to minimize variance within classes and maximize variance between classes.
Field Survey for Characterizing Urban Trees, Tree Health Conditions, and Indicators
The study integrated field-based urban tree measurements with geospatial data collected through ArcGIS Survey123. Tree species documentation for this inventory was conducted during the summer, from July 1 to 30, using stratified random sampling across residential blocks, school lands, and church properties within the Chatham community. Therefore, the study area was divided into strata, and a total of 495 trees out of an estimated 26,152 neighborhood trees (approximately 2%) were randomly surveyed. During the field survey, each surveyed tree was characterized, in accordance with standard forestry protocols and the Urban Tree Monitoring Protocols field guide (2015). Tree species were identified in the field through visual assessment of morphological features, including leaf shape, leaf arrangement, bark texture, and twig characteristics. For this, the Morton Arboretum field key, USDA (United States Department of Agriculture) Forest Service species sheets, and visual references from the HTHC (Healthy Trees Healthy Cities) field guide were consulted. Crown condition and tree health were visually assessed using standardized protocols adopted from the HTHC Reference Guide, the USDA Forest Service Crown Condition Indicators, and guidance from on-site certified arborists. Crown Light Exposure (CLE) was determined by counting the number of sides (top plus four vertical sides) receiving at least one-third direct sunlight, following the official CLE rating procedure. It was categorized into six classes, with Class 0 representing trees receiving no full light on any side and Class 5 representing trees receiving full light from the top and all four sides. Crown Vigor was rated through a comprehensive assessment of four stress indicators: fine twig dieback, leaf defoliation, leaf discoloration, and the presence of large, broken, or dead branches. Each indicator was visually estimated using the percentage classes provided in the Morton Arboretum guidelines and USDA reference guides, and the overall vigor class (1–5) was assigned based on standardized thresholds.
Leaf health, including the total leaf surface area affected by holes, leaf discoloration (chlorosis), wilting, and browning, was estimated using HTHC/USDA class thresholds and indicators. HTHC/USDA class thresholds and indicators, ranging from Class 1 (0–1%, trace) to Class 5 (75–100%), were interpreted in such a way that lower classes indicate healthy trees and higher classes indicate stressed trees. Additionally, health conditions, including exit holes, frass, exudation, egg sites, insect presence, damaged buds or fruits, leaf holes, epicormic sprouts, blonding, S-shaped galleries, bark fissures, cankers, galls, wilted or browning leaves, premature leaf loss, deadwood, and wounds, were documented following the pest and stress indicator categories used in the USDA Forest Health Monitoring manuals. All assessments were made visually and confirmed with guidance from the certified arborist to ensure accuracy and consistency. Tree locations were recorded using an iPhone 12 running ArcGIS Survey123, which integrates GPS to georeferenced each urban tree point directly within the digital form. The Survey123 form, developed with guidance from a certified arborist, was used to store species, DBH, crown metrics, and health indicators, ensuring consistency between field observations and later spatial analysis in ArcGIS Pro.
Results and Discussions
High-Resolution LiDAR-Based (1m*1m) assessment of Urban Trees and Tree Canopies
Figure [fig:lidar-characterization] shows the high-resolution Lidar (1m × 1m) characterization of Urban trees in the Chatham neighborhood, including tree heights, density, canopy area, and canopy density. The height of urban trees in the Chatham neighborhood ranges from 2.5 m to 36 m. The average height of the tree is 19m ± SD 6.2. According to The Morton Arboretum's Northern Illinois Tree Species List, urban trees are classified by height as small (7.5 m or less), medium (7.5-12 m), and large (exceeding 12 m). Therefore, on average, trees in Chatham neighborhoods (i.e., 19m) are tall. Only 5% of the trees in the neighborhoods are small (<7.5 m), 85% are tall (>12m), and the remaining 10% are medium-height trees.
High resolution Lidar (1m *1m) characterization of Urban trees in Chatham neighborhood: a) Tree heights, b) Tree density, c) Canopy Area, and d) Canopy density
The relatively tall trees observed in the neighborhood are concerning for residential areas like Chatham. Typically, medium-sized trees ranging from 9 to 15 meters are recommended for residential neighborhoods to ensure the desired ecological services and environmental benefits (Nowak, 2010). However, Trees in Chatham over 15 meters pose risks of interfering with infrastructure, conflicting with utilities, and damaging buildings with their roots. Therefore, it is very important to conduct regular risk assessments through the City’s Bureau of Forestry under the Department of Streets and Sanitation (DSS) for Safety, Pruning & Maintenance, and Removal of Hazardous Trees.
The trees in the neighborhood have continuous canopy coverage, ranging from a square meter to 15 acres. On average, the canopy area coverage of the neighborhood trees is 48.43 m² ± SD = 4.49 m, indicating significant spatial variability. Generally, 324 acres (i.e., 1.3 km²) of the 1889.8 acres (i.e., 7.6 km²) of the Chatham neighborhood are covered by trees, indicating a 17% tree canopy coverage. This is significantly higher than the Greater Chatham area tree canopy coverage of 8.5 percent reported by Robinson (2023), which is substantially lower than the citywide average of 16.5% (Nowak et al., 2010). However, compared to the earlier American Forests' recommendation of 40% urban tree canopy for Chicago, the Chatham neighborhood's canopy is 59% lower. Additionally, compared to Chicago’s greenest neighborhood, Forest Glen, which has 49% canopy coverage (Morton Arboretum, 2022), Chatham has 65% less canopy coverage. Moreover, considering that some green US cities have more than 50% tree canopy coverage (i.e., Charleston, West Virginia (74.7%), Tallahassee, Florida (56.1%), Little Rock, Arkansas (54.9%), Raleigh, North Carolina (54.7%), and Nashville, Tennessee (53.5%), there is room in Chatham for increased tree canopy goals. Therefore, because of its lower canopy coverage and relatively higher exposure to environmental hazards (floods), noise pollution, and urban heat vulnerability that could have been mitigated by increased urban tree cover, investment in Chatham's green infrastructure is necessary.
The tree and canopy density maps reveal areas of tree desertification, where tree planting can be implemented in the neighborhood to achieve increased canopy coverage. The tree canopy density ranges from 0 (no canopy) to 9 canopies per acre, and tree density ranges from no trees to about 30 trees per acre. On average, there are five canopies per acre, with 14 trees. Low-density areas (i.e., excluding built-up and paved areas) in the neighborhood are treeless and suitable for planting to improve greenery in Chatham. It must be noted that tree deserts emerge in highly paved areas, particularly along major roads where available soil volume is low, and planting strips are narrow. Tree-deficient "desert" areas were also identified along major paved corridors, in open lots, and on vacant land, providing opportunities for strategic tree planting. A strategic urban tree-planting approach involves site selection (placement) and species identification that are believed to enhance the neighborhood's ecosystem services, such as mitigating environmental hazards (e.g., floods), reducing noise pollution, maintaining/increasing carbon storage in vegetation, and improving resilience to urban heat, an approach historically used in Chicago (Berland et al., 2017; Smith et al., 2019; Suh, 2023). It is therefore critical to prioritize these areas for future greening initiatives, thereby simultaneously increasing canopy cover and improving stormwater management capacity.
Characterizing Tree Distribution, Types, Composition, and Structure
Figure [fig:tree-compositions] shows the results of tree species compositions, types, forms, distribution, and growing space. Accordingly, the Chatham tree inventory revealed 58 tree types. Most of these trees were deciduous, accounting for approximately 89% of the total tree population, compared to only 11% evergreen**.** The top five most populous tree types are Honey Locust, White Mulberry, Callery Pear, Common Hackberry, and Colorado Blue Spruce. This composition reflects a typical urban forest profile in the U.S. Midwest, where fast-growing, broadleaf species are favored for shade and cooling (Nowak et al., 2008).
Additionally, Figure [fig:tree-compositions] showed that most trees were single-stem, with multi-stem individuals making up a smaller fraction of the population. Single-stem forms were most common along residential streets and in institutional landscapes, while multi-stem forms were typically concentrated in parks and open spaces. While the dominance of single-stem deciduous trees enhances shading and cooling, it also increases vulnerability to pests and diseases (Roman et al., 2021). The distribution of trees closely reflects land-use constraints within the Chatham neighborhood. Approximately 36% of the neighborhood is dedicated to transportation infrastructure, while only 2.2% and 3.4% of the land are open space and vacant land, respectively. This imbalance restricts opportunities for tree planting and contributes to uneven canopy distribution across the community. Residential parcels provide the bulk of available growing space, while transportation corridors and commercial zones remain sparsely treed.
Chatham tree compositions, types, forms, distribution, and growing space
Figure [fig:crown-characteristics] showed the result of field-based assessments of crown characteristics, indicating that most trees had adequate light exposure (i.e., 81%), while the remaining 19% were not adequately exposed, and only 5% of the trees were either one-sided or two sides of the crowns alone were exposed to the sun. Additionally, crown transparency varied, with 62% of the observed trees having a healthy, dense canopy, and several individuals exhibiting thinning foliage (i.e., 19%), particularly among older maples and cottonwoods. Many observed trees maintained moderate to high crown vigor (83%), with some showing noticeable discoloration and dieback, and others dead or nearly dead.
Crown Characteristics
Crown health directly influences a tree’s capacity to provide ecosystem services such as shading, cooling, and stormwater interception. It is an important part of the tree that directly influences biomass production, and, in turn, the tree's ecosystem functions (e.g., carbon sequestration) and services (e.g., air pollution control) (Zhu et al., 2021). Full, vigorous crowns maximize shade provision and stormwater interception, while thin crowns reduce these benefits and signal declining long-term survival. Monitoring crown transparency and vigor, therefore, provides an early-warning indicator for management interventions, such as soil aeration, pest control, or selective replacement planting.
Assessment of Tree Health Conditions and Indicators
Assessment of tree health conditions and indicators was conducted by examining leaf and twig health, leaf holes, and damage to the trees' woody parts (bark and branches).
Assessing Leaves and Twigs Health
Figure [fig:tree-leaves-health] shows the results of the field observation that assesses the health conditions of tree leaves in Chatham for leaf discoloration, wilting and browning, defoliation, and premature leaf loss. Accordingly, leaf discoloration, also known as chlorosis (leaf yellowing), is noticed on tree leaves with varying degrees of severity. Leaf discoloration was severe in 7% of the trees and moderate in 21%. In contrast, wilting and leaf browning were observed in 81% of the trees. Tree wilting and browning in urban trees are often attributed to moisture and heat stress, pest infestations, and urban pollution. In contrast, leaf discoloration is attributed to physiological stress from nutrient deficiencies, moisture stress, and pathogen infestations.
Leaf defoliation, defined as premature shedding or loss of tree leaves, was observed on 22% of the trees. However, severe and heavy defoliation, as well as premature leaf loss, were observed in only 1% of the trees. Some abiotic factors, such as air pollution, nutrient deficiencies, herbicide exposure, heat stress, drought, flooding, and excessive soil moisture, are often blamed for defoliation and premature leaf loss (Mazurek & Nowik, 2018). Additionally, biotic factors such as insect pests’ defoliators and fungal pathogens can cause defoliation and premature leaf loss. These factors often weaken plant vigor through impaired photosynthesis, stomatal damage, limited root capacity, and crown decline (Mazurek & Nowik, 2018).
Health conditions of Tree leaves in Chatham.
Figure [fig:tree-twigs-health] shows the health conditions of tree twigs in Chatham based on the characteristics of Twigs sprouts, dieback, and injuries or galls. Accordingly, most trees (53%) showed epicormic twig sprouting, whereas the remaining (43%) did not, perhaps indicating stress from physical and physiological factors. Twigs dieback is only observed on 65% of the trees, while the remaining 35% have only a light or marginal mark of twigs dieback, indicating physiological or systemic stresses. Conversely, galls, abnormal growths on twigs caused by pest infestation, are observed on only 9% of the trees assessed, while on the remaining 91%, no signs are observed.
Health Conditions of Tree Twigs in Chatham
Assessing the health conditions of tree twigs, which represent the thinnest and most recent growth supporting branches, leaves, and flowers, is essential for evaluating overall tree health (Camarero et al., 2015). According to Camarero et al. (2015), unhealthy or damaged twigs frequently result from biotic and abiotic stresses or health impacts experienced by trees. Biotic stresses encompass pests such as the Twig girdler beetle (Oncideres cingulate), responsible for girdling stems, and pathogens, including canker fungi (e.g., Cytospora species). Abiotic factors include frost injury and drought conditions. The deterioration of healthy twigs leads to reductions in root absorption, nutrient transport, leaf and flower development, biomass growth, and overall productivity (Asis & Niscioli, 2024). The Morton Arboretum (2022) reports that phenomena such as leaf chlorosis, browning, wilting, premature leaf drop, and defoliation are prevalent among trees, especially in Northern Illinois, necessitating both short-term and long-term management strategies. In the short term, immediate causes should be addressed through pesticide application, nutrient supplementation, foliar treatments, and adequate watering. Conversely, long-term measures should focus on adopting best management practices that enhance the trees' growing environment.
Assessing the health conditions of the woody parts of the trees (barks and branches)
Figure [fig:holes-woody-parts] illustrates holes in the woody parts (barks and branches) and tree leaves in Chatham. Accordingly, holes of varying widths are found on the woody parts (barks and branches) of the trees, although the majority (68%) did not have holes, while the remaining 32% had holes. The trees had round holes (31%) and D-shaped holes (1%). The round-shaped holes ranged from the tip of a pen or pencil (i.e., 0.5 - 0.7 mm, 2%) to the diameter of a pencil (i.e., 7 - 8 mm, 28%). Similarly, holes are also found on the leaves of trees in Chatham. While 30% of leaves did not have holes, the remaining 70% had holes of varying orientations. Holes are oriented near the outer edge of some leaves (i.e., 5%) and along the central vein of others (i.e., 7%). However, on the majority of the leaves, the holes are found both on the outer edge of the leaves and along the central vein (midrib) of the leaf (i.e., 57%). Caterpillars and fungal or bacterial infections are caused by environmental conditions such as hail and wind abrasion. On the other hand, holes in the woody parts of the plant are attributed to emerald ash borer (EAB), Bark beetles and ambrosia beetles, woodpeckers, Sapsuckers, and insects that drill or bore into the trunk and branches (Kirichenko et al., 2017). These pests can weaken trees by causing them to lose structural strength and rotting the woody parts. It also reduces photosynthetic capacity, thereby limiting carbohydrate production, disrupting water transport systems, and ultimately increasing the risk of tree mortality and urban tree failure.
Assessing the holes in the woody parts (barks and branches) of the trees and tree leaves in Chatham
Figure [fig:woody-parts-health] reports field observations for health indicator assessment of bark fissures, S-shaped galleries, dead branches, cankers, and wounds on the woody parts of the trees (barks, branches, and trunks) in Chatham. Accordingly, bark fissures were observed on 54% of the trees, whereas cankers and wounds were observed on 46%. Bark, the protective outer layer of a tree's woody parts, has fissures, wounds, and cracks that expose the vascular tissues and nutrient transport system. As cracks and fissures deepen, pathogens and insect borers may use them as entry points, increasing the risk of structural compromise and failure. The opening can also increase moisture loss, which is critical, especially during drought.
On the other hand, dead branches were observed on 82% of the tree canopies in the order of minor, moderate, and severe damage. Only 18% of the canopies in the Chatham neighborhood showed no dead branches. Dead branches, although most are minor or moderate, can still break under the influence of wind, rain, hail, or snowstorms, posing significant safety hazards to people and the neighborhood's properties and infrastructure. In the United States, an estimated 34 deaths per year are attributed to urban tree failure (Schmidlin, 2011), and in the Netherlands, there is one incident of urban tree failure per 19,000 inhabitants annually, resulting in average municipal costs of €2,244 per incident paid in compensation (Van Haaften et al., 2016). Since neighborhoods like Chatham have a high concentration of people, vehicles, and infrastructure, urban tree failure can cause severe injury or fatalities to pedestrians, break through roofs, siding, gutters, and fencing, damage parked cars, and fall on power lines, causing outages. Therefore, it is important for Chatham that the city adopt proactive urban forest management strategies, which may include regular tree inspections and inventories, the removal or pruning of dead branches, and proper storm preparedness and emergency response.
Health conditions of woody parts of the trees (barks and branches) in Chatham
Besides, on the branches that looked relatively healthy, wood-boring insects such as Emerald ash borer, Asian longhorned beetle, and Bark beetle (Ips), or fungi entering through wounds, cracks, or fissures, have been observed in almost 50% of the trees. Such insects and diseases systematically affect the cambium, phloem, and xylem vessels of the trees, impairing water and nutrient transport and weakening structural integrity, thereby lowering crown vigor, accelerating dieback, and increasing tree mortality (Herms & McCullough, 2014; Smiley et al., 2017). Additionally, pests and diseases can significantly reduce the ecological services of urban trees, including their abilities to filter air pollutants, store carbon, regulate stormwater, and reduce urban heat (Nowak, 2010; Vogt et al., 2015), while their sudden outbreaks create substantial economic burdens for municipalities (Herms & McCullough, 2014; Pfisterer & Beane, 2023).
Understanding these hazards is critical for Chatham residents to implement preventive measures, including investing in early monitoring systems, conducting periodic tree health inspections and regular tree inventories, practicing proactive pruning and removing infested trees and dead branches, and ensuring proper storm preparedness and emergency response. Such prudent activities can extend the lifespan of the existing canopy and reduce replacement costs. The city of Chicago has launched the 2023 Chicago Urban Forest Management Plan, to Chatham’s advantage, to support neighbors with street-tree planting, pruning, hazardous tree removal, pest management, storm cleanup, and participation in canopy-equity programs in an effort to maintain the city’s environmental quality and strengthen the resilience of Chicago’s urban forest (City of Chicago, 2023).
Conclusions
Urban forests play a vital role in improving environmental quality, ecological resilience, and public health in densely populated cities. This study presented a neighborhood-scale urban tree inventory for the Chatham community on Chicago’s South Side, combining field observations, crown-health assessments, community surveys, and high-resolution LiDAR data to analyze tree structure, species diversity, canopy features, and health status. The findings offer a thorough understanding of the ecological condition and management needs of Chatham’s urban forest and emphasize the importance of detailed-scale analyses in tackling environmental issues and promoting urban equity.
The LiDAR-based analysis showed that urban trees in Chatham range in height from about 2.5 m to 36 m, with an average height of about 19 m. This suggests that many trees in the neighborhood are quite large, surpassing the typical height recommended for residential urban landscapes. While mature trees provide key ecosystem services such as shading, carbon capture, air pollution removal, and stormwater management, very tall trees in densely built residential areas may cause conflicts with infrastructure, buildings, and overhead utilities. Therefore, future urban forestry initiatives in Chatham should focus on choosing species that balance ecological advantages with compatibility with infrastructure. Generally, Large trees provide substantial ecosystem services but require regular structural assessment and maintenance in dense residential environments.
Tree canopy analysis indicated that roughly 17% of Chatham is covered by tree canopy, a figure close to Chicago’s citywide average but well below the recommended targets for cities aiming to be resilient to climate impacts. Compared to greener neighborhoods in Chicago and other U.S. cities, Chatham’s tree cover remains relatively sparse. The spatial distribution of trees also revealed areas of “tree desertification,” particularly along heavily paved transportation routes and built-up zones, where limited soil space and impervious surfaces constrain tree-planting opportunities. However, open lots and vacant land within the neighborhood present potential sites for targeted tree-planting efforts.
Species composition analysis identified 58 tree types, mainly deciduous species such as Maple, Honey Locust, Crabapple, Cottonwood, and Mulberry. While this composition reflects typical Midwestern urban forests and provides shade and cooling, the dominance of a few species may increase vulnerability to pest infestations and disease outbreaks. Recent declines in urban canopy due to invasive pests, including the emerald ash borer, highlight the need for diversified planting strategies that improve the ecological resilience of urban forests. Additionally, varying levels of physiological stress and structural defects across the sampled neighborhood trees indicate environmental stress. Notably, a high proportion of trees showed dead branches, which pose significant safety risks in densely populated neighborhoods. Overall, this study shows that neighborhood-level urban forest inventories offer valuable insights often missed in citywide assessments; however, some limitations could be addressed in follow-up studies. Data were collected using field measurements, ArcGIS Survey123 Mobile, citizen reports, and high-resolution LiDAR data. Advanced technologies such as drones equipped with hyperspectral sensors, AI, and machine learning can enhance the accuracy of these findings. Furthermore, this study focused solely on the Chatham neighborhood, one of Chicago's 77 community areas and 33 predominantly African American neighborhoods. Caution is advised when applying these results to the broader city or other demographic areas, and further research across different communities is recommended.
The authors are grateful to anonymous reviewers for this manuscript. Additionally, Chicago State University's (CSU's) Geographic Information Systems (GIS) laboratory provides software, and the Environmental Systems Research Institute (ESRI) provides technical support for the software.