Introduction-Earth has diverse and extreme environments so, for an organism to survive, it is vital that it is able to respond to changes in temperature, availability of food and even other organisms. For organisms to function properly, and adapt to these conditions, gene expression at the right time is essential. Gene expression is the process by which information in DNA is transferred to RNA molecules that create proteins for various functions. The control over the creation of proteins for a situation is essentially what gene expression and gene regulation is1. For instance Himalayan rabbits that were bred at temperatures less than 20 C had black sections of fur, while those bred at 35 C or more had completely white fur, suggesting differentiated gene expression for a changed condition-temperature2. The first step of gene expression is transcription, therefore measuring the levels of transcription of genes in different conditions can be an indicator of the effects of gene regulation. In order for transcription to occur, mRNA segments, named “transcripts”, are copied from DNA, so finding which mRNA transcripts are copied can indicate gene expression for various times and conditions. SAGE and Northern Blot techniques measure mRNA segments to analyze gene expression..
## I. INTRODUCTION
Earth has diverse and extreme environments so, for an organism to survive, it is vital that it is able to respond to changes in temperature, availability of food and even other organisms. For organisms to function properly, and adapt to these conditions, gene expression at the right time is essential. Gene expression is the process by which information in DNA is transferred to RNA molecules that create proteins for various functions. The control over the creation of proteins for a situation is essentially what gene expression and gene regulation is[^1]. For instance Himalayan rabbits that were bred at temperatures less than $20^{\circ}\mathrm{C}$ had black sections of fur, while those bred at $35^{\circ}\mathrm{C}$ or more had completely white fur, suggesting differentiated gene expression for a changed condition-temperature[^2]. The first step of gene expression is transcription, therefore measuring the levels of transcription of genes in different conditions can be an indicator of the effects of gene regulation. In order for transcription to occur, mRNA segments, named "transcripts", are copied from DNA, so finding which mRNA transcripts are copied can indicate gene expression for various times and conditions. SAGE and Northern Blot techniques measure mRNA segments to analyze gene expression.[^3] Another method can be using the transcription levels themselves, with the use of native elongating transcript sequencing or NET-seq, which purifies RNA-polymerase complexes and sequences the $3^{\prime}$ end of nascent RNA to reveal the strand-specific position of RNA-polymerase at each nucleotide[^4](fig (1)). The signals from NET- seq show the presence of RNA polypeptides at that area of DNA, thus showing more transcription at that site. Similarly, another method is micrococcal nuclease sequencing or MNase-seq. The enzyme essentially "cuts" the linker region between nucleosomes and then digests the free DNA ends toward the core nucleosome. Since the nucleosome limits further digestion, as it is blocked by histones, the resulting DNA fragments reflect nucleosome placement[^5](fig (2)). This paper will focus on analysis from NET-seq and MNase seq methods onS. cerevisiae.
The organism analyzed in this paper is yeast, more specifically the Saccharomyces cerevisiae species, or baker's yeast. This organism is well studied in the genetics field, due to its similarity to human cells, as it is eukaryotic and has homologous proteins to that of mammals. It is also the first eukaryotic organism to be fully DNA sequenced $^6$, having 16 chromosomes and 5331 actual protein coding genes $^7$. It is also very cost effective and easy to acquire, since it can be found in almost any store both scientific and general. This paper will focus on the changes in the yeast's gene response and such when presented with a changing environment- in this case to have a different source of food. This test could be significant because yeast can utilize glucose better than galactose, which they need to add enzymes and such to modify as a viable food source. One such change can be the gene expression of the GAL group that regulates the metabolism of galactose that is not activated in a glucose environment. When galactose is the sole carbon source, the galactose-metabolizing enzymes are expressed at 1000 times their level in glucose $^8$.
This paper will measure the overall effects on gene expression in S. Cerevisiae with the addition of a galactose environment.
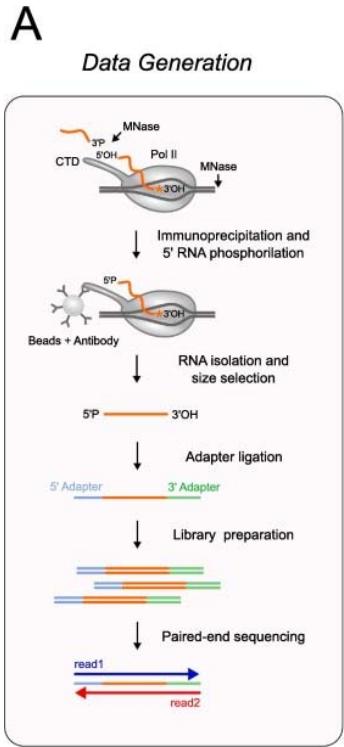
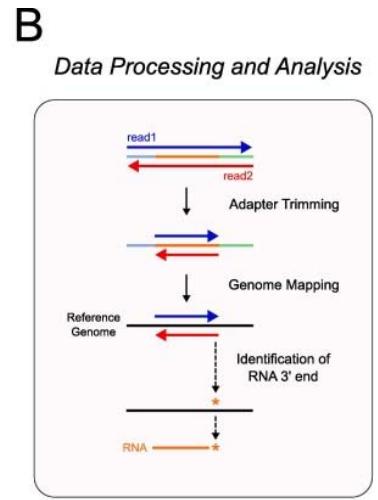
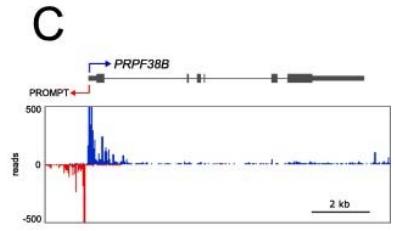
Figure 1: The schematic diagram of the NET-seq method. Reference: See Figures section of References
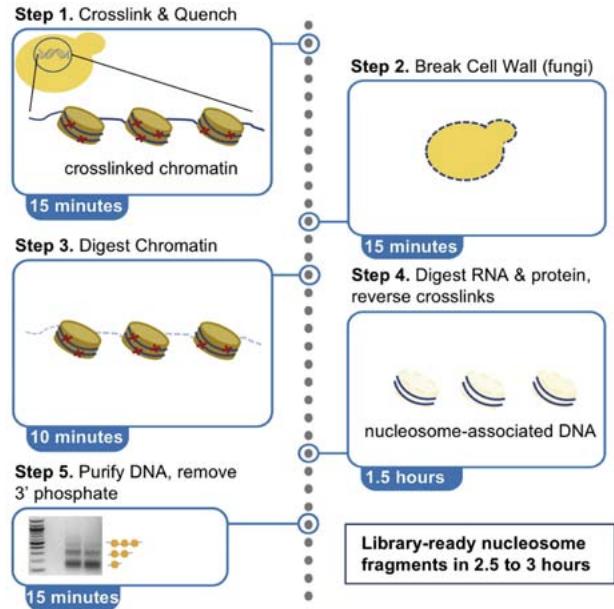 Figure 2: The schematic diagram of MNase seq method Reference: See Figures section of References
## II. METHOD
### a) Preparation of Saccharomyces Cerevisiae
The yeast were originally placed in a glucose environment to be intended as the control group. Yeast was then cultured in the glucose environment for two hours under a constant temperature of 37 deg. C. Then samples of S. Cerevisiae were transferred into the galactose environment, for 5,15, and 60 minutes to see the changes in gene expression when a change in environment and food source was presented, with each of the time periods in which the samples were collected to be the experimental groups.
### b) Acquiring Data
Saccharomyces cerevisiae was prepared for and NET sequenced, for when the samples were in glucose, and sequenced periodically when the yeast was placed in galactose for 5 minutes, 15 minutes and 60 minutes. MNase sequencing was also prepared for and performed on the yeast when they were originally in a glucose environment and when they were in the galactose environment for 60 minutes.
### c) Analyzing the Data
The sequencing data was analyzed in MATLAB. First, an average gene profile was created to show the typical behavior of all the genes, named metagene. This allows for greater insight about the overall trends across all the base pair positions, in order to find the genes that have had a significant change from switching to galactose environment, a t-Test with significance of 0.05 was performed on each of the meta gene datasets. The gene profiles of genes that responded to the change of environment (category: responsive genes) were compared to the genes that did not (category: non-responsive genes). The chromatin and promoter information of these two categories of genes was further investigated using the MNase sequencing dataset.
### d) Antisense Transcription
Antisense transcription was also considered and the transcription levels for responsive and nonresponsive genes were graphically represented, in both sense and antisense genes, for both NET-seq. The antisense transcription levels were compared with the sense transcription levels, in the responsive and non responsive genes. The promoter regions of the sense and antisense transcriptions were also analyzed for differences. To find the promoter region, only the first 100 genes were graphed as the data started from a position of about -1000 bp to 500 bp of the transcription starting site (TSS). Therefore, the promoter would be somewhere in the region from -1000 to 1bp.
## III. RESULTS AND DISCUSSION
A glucose environment is S. Cerevisiae's natural environment, as it is their primary and most efficient source of energy. The presence of glucose suppresses metabolic activity to perform gluconeogenesis, or to synthesize glucose from other carbon compounds, with the use of signaling. These processes control the transcriptional and translational activities, especially with the Snf3/Rgt2 glucose-sensing pathway and the Snf1 signal transduction[^1]. Galactose was chosen for the experimental group because the yeast cells cannot directly perform glycolysis to gain energy like in glucose, but S. Cerevisiae and other species of yeast utilize GAL genes, which are activated only in the presence of galactose to regulate transport and metabolism of the sugar, and have to modify galactose using enzymes to use as food[^2], thus opening the potential to see varying degrees of gene expression changes with the difference in environment.
Out of S. Cerevisiae's 5331 genes, the t-test of the meta-genes resulting from the NET-seq data of the S. Cerevisiae (Appendix section 1,2) with a significance level of 0.05 showed 4849 genes responded to the change in environment from glucose to galactose in 5 minutes. 4918 genes responded to change in environment in 15 minutes and in 60 minutes 4756 genes responded to changes. There were 4141 genes that responded in the above 5-minute, 15-minute and 60-minute groups, therefore about $78.7\%$ of the total genes were considered to be active to the environment change. Figure 3 shows the mean NET-seq levels of all the genes, regardless of the activity levels. The similarity of the graphs of the galactose mean NET-Seq levels to that of the glucose graph across all the genes decreases as more time is spent in the galactose environment- this change is most apparent at the beginning of 15 minutes of being in the galactose environment, indicating approximately the time when the genes started to respond to galactose. Figure 3 further demonstrates that the genes located between -200bp to -100bp relative to TSS and 700bp to 750 bp relative to TSS have increased transcription the most.
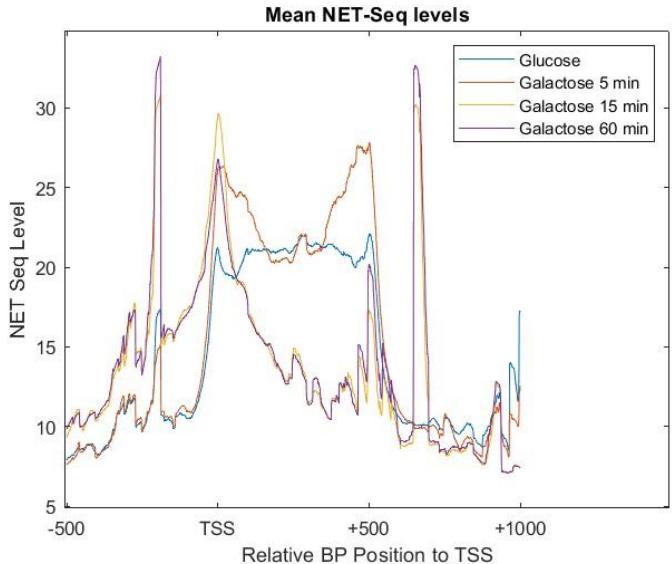 Figure 3: The average NET seq levels for S.Cerevisiae inglucose and galactose environment for all time intervals
Focusing the transcription differences between the glucose and galactose 60-minute group, Figure 4 suggests that the responsive gene showed a higher NET-seq level consistently than when it was in a glucose environment, thus it was activated and more transcription had occurred when it was in galactose. This gene in particular helps to control lipid and amino acid metabolism in the yeast $^{3}$, thus it being activated will help the yeast get such nutrients from the galactose environment.
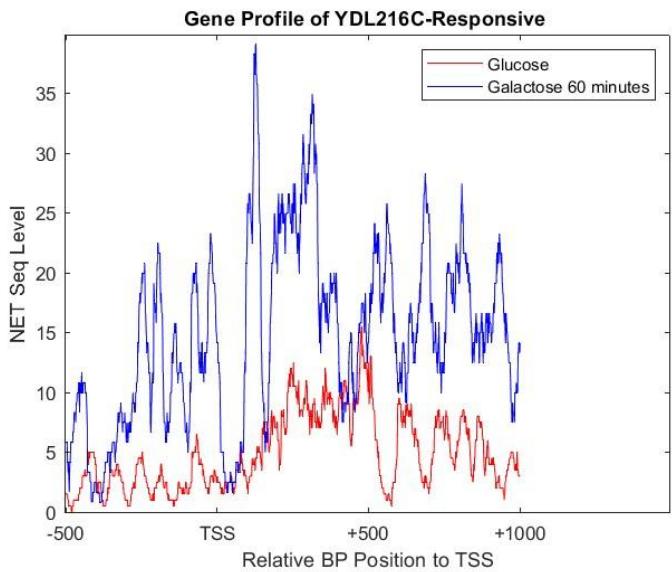 Figure 4: Gene profile based on NET-seq levels of YDL216C,which responded to galactose in 60 minutes of exposure
On the other hand, as shown in Figure 5, the gene YOR255W was a nonresponsive gene that had a very low net seq level when it was in a glucose environment. It does not show consistently high net seq levels when exposed to the galactose environment, even having no NET-seq levels periodically, such as between 0-200 and 600-800. This gene is responsible for helping create protein for the outer spore walls for the yeast during mitosis[^4]. Therefore, it logically, does not have that much of an active role when the yeast is transferred to a galactose environment, as it only activated in some stage of mitosis, but it's periodic rise and fall in net-seq levels does indicate when the yeast is undergoing mitosis, especially seen between 800-1000bp.
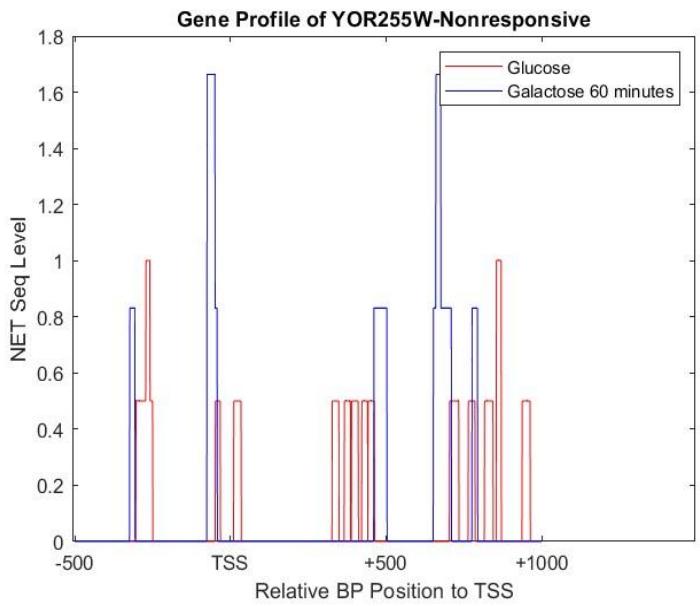 Figure 5: Gene profile based on NET-seq levels of YOR255W,which responded to galactose in 60 minutes of exposure
Antisense transcription is generally lower than the sense transcription due to promoters of the antisense strand being less noticeable and less transcript able than the sense promoters[^5]. It still is important to gene expression as they can quickly respond and integrate with various stimuli, and variate quickly sending the genes into on or off positions[^6]. They thus can allow for greater survivability of an organism in different environments overtime due to evolution, and must be studied further due to their relative uncertainty over why they function the way they do. The levels of transcription for sense and antisense genes in the 60 minute interval for the galactose environment were compared in Figure 6. According to the acquired NET-seq data, the levels of transcription of responsive genes are inverse of each other, where a high level of transcription in the forward strand corresponds to a lower level of transcription in the reverse strand. This is apparent especially in the 200-800 region.
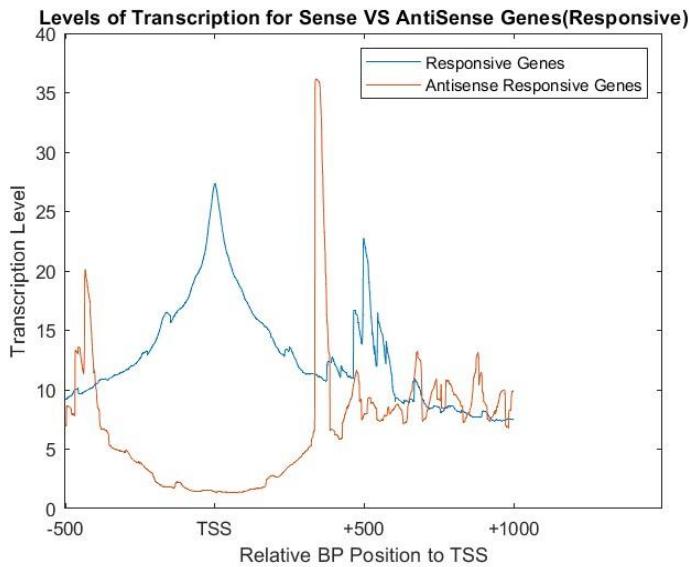 Figure 6: Levels of transcription in genes that responded to galactose in 60 minuteinterval in both sense and antisense direction using NET-seq data
Figure 7 shows the levels of transcription for sense and antisense genes in the 60 minute interval for the galactose environment. These genes generally have a lower transcription level than the responsive genes, and generally even less antisense transcription levels. This was hypothesized since the nonresponse genes remain dormant as they are not affected by the change in environment.
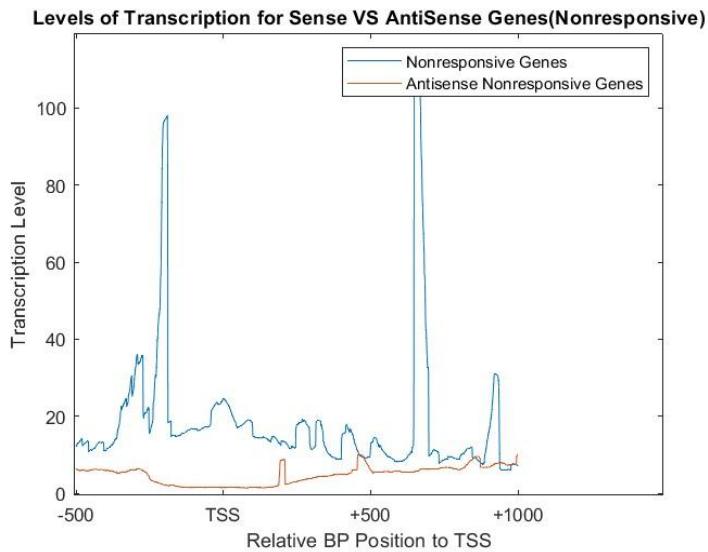 Figure 7: Levels of transcription in genes that did not respond to galactose in a 60 minute intervalin both sense and antisense direction using NET-seq data
Figure 8 shows the MNase seq levels of the responsive and nonresponsive genes. The promoter is approximately between -355 to -400 bp relative to the TSS, as it is indicated by lower than usual MNase seq levels. The overall MNase seq levels are very consistent with the responsive and non responsive genes. The location of the histone proteins are also evident, beginning at about relative to 500bp to the TSS, where there is a regular sinusoidal pattern where a higher MNase-seq signal indicates less transcription, blocked by the DNA being wrapped around the histone, and lower levels are where DNA strands likely will be transcribed, as the region is between the histone proteins.
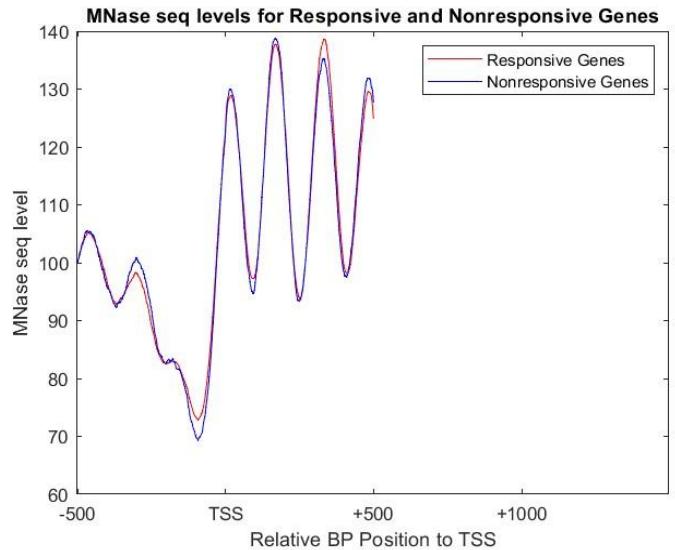 Figure 8: MNase seq levels for both responsive and non responsive genes when exposed to 60minutes of a galactose environment, in order to identify the possible promoter region
Additionally, histone modifications can also play a role in gene regulation in yeast- specifically for those genes that did respond to galactose. These processes can affect various chromatin related activities like DNA repair and can do this by repressing or activating transcriptional activity. The exact effects depend on the type of histone modification under question, the organism and the genes that have been affected. However, various studies describe that histone methylation, a type of histone modification, does correspond with increased gene expression along with histone acetylation, along with DNA acetylation. In S.cerevisiae specifically, the histone acetylation depends on the transcription levels of the yeast by targeting the nucleosomes where RNA polymerase II accumulates, but in some instances the process itself is needed to facilitate transcription in yeast- by regulating bonds between histones and DNA.
## IV. CONCLUSION
The transition from a glucose to a galactose environment has various effects on S. Cerevisiae, especially on a genetic level, with various aspects of gene expression such as activation of genes, transcription levels and antisense activity all have changed. Overall, the results point out that there is more of such gene expression when the yeast has switched to a galactose environment, and these levels have increased as more time was spent in the galactose environment, indicated by the number of genes (nearly $80\%$ ) that have responded to the galactose environment, the average net-seq levels and the gene profiles. Antisense transcription has been higher for responsive genes than in non-responsive genes. These results are logical as the galactose environment forces the yeast to perform gluconeogenes is and other processes that require many of the genes to be activated to carry out regular functions that do not need such higher levels of activity in its natural glucose environment, which does not need modification.
Further research can be done on this organism's gene expression, for instance utilizing various other techniques such as CHip-seq data to gain more information about histone modifications, and RNAseq for final transcript levels. There can also be more environments in which the S. Cerevisiae can be placed in, such as sucrose or lactose, or a combination to find how gene expression changes. The amount of time spent in these environments could also be changed. Such analysis can provide various insights into the changes larger, eukaryotic organisms, especially people can respond to on a genetic level. This can further the understanding of how genes regulate human function, and how problems with the regulation in the presence of a changing environment can create better health treatments such as more accurate and individualized diet plans, better screening techniques that can detect genetic irregularities with various stimuli and predict risks for patients.
### Limitations of the Study
Our research was limited due to time and resources for data analysis, which resulted in no CHIP-seq test analysis and also testing of histone modification behavior with transcription. It is recommended to run tests using these parameters to increase data collection range.
#### Ethical Approval
No ethical approval was needed for this study.
#### Informed Consent
Informed consent form was submitted to the journal.
#### Results/ Discussion
10. Martin, Benjamin J. E., et al. "Transcription Shapes Genome-Wide Histone Acetylation Patterns."
11. Nature News, Nature Publishing Group, 11 Jan. 2021, https://www.nature.com/articles/s41467-020-20543-z.
### Figures:
1. Prudência, Pedro, et al. "Analysis of Mammalian Native Elongating Transcript Sequencing(Mnet-Seq) High-Throughput Data." Methods, Academic Press,
5 Sept. 2019, https://www.sciencedirect.com/science/article/pii/S1046202318304845.
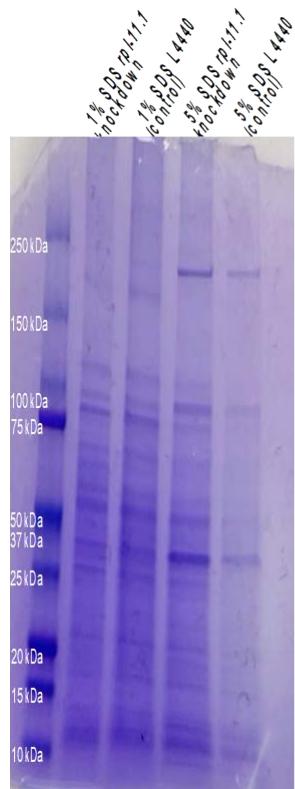
Figure 1. $1\%$ and $5\%$ SDS-PAGE of proteins collected from rpl-11.1 knockdown and L4440 (control) C. elegans PP563. The gel was imaged by smartphone 48MP camera at ISO 200. Contrast has been adjusted for presentation clarity.
L4440 GFP+mCherry (merged) fluorescence
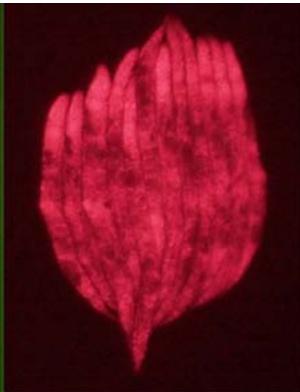
L4440 mCherry fluorescence
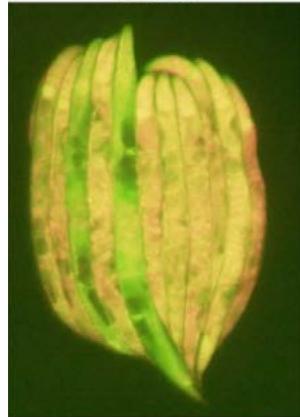
Figure 1: $1\%$ and $5\%$ SDS-PAGE of proteins collected from rpl-11.1 knockdown and L4440 (control) C. elegans PP563. The gel was imaged at ISO 200. Contrast has been adjusted for presentation clarity
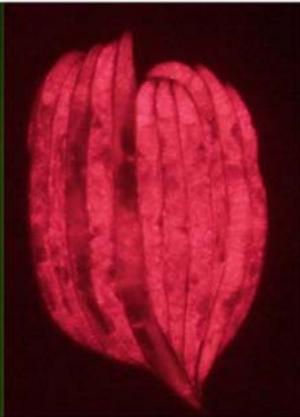
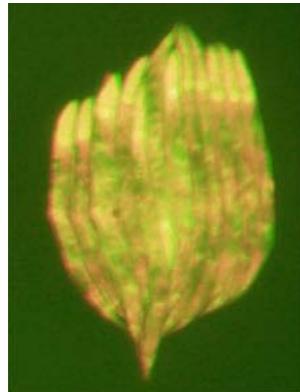
Figure 2: rpl-11. 1 knockdown in MAH215 via RNAi in comparison with L4440 control. Micrographs taken at 31.6ms exposure time and 2.0x gain.Merged fluorescence images are acquired by combining coloured images (GFP signal and mCherry signal) in silico
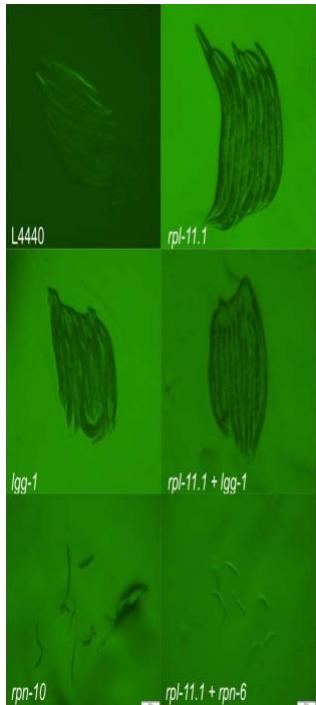
Figure 3. Micrographs of double-gene knockdown C. elegans PP563. Micrographs were taken at $31.6\mathrm{ms}$ exposure and $2\times$ gain.
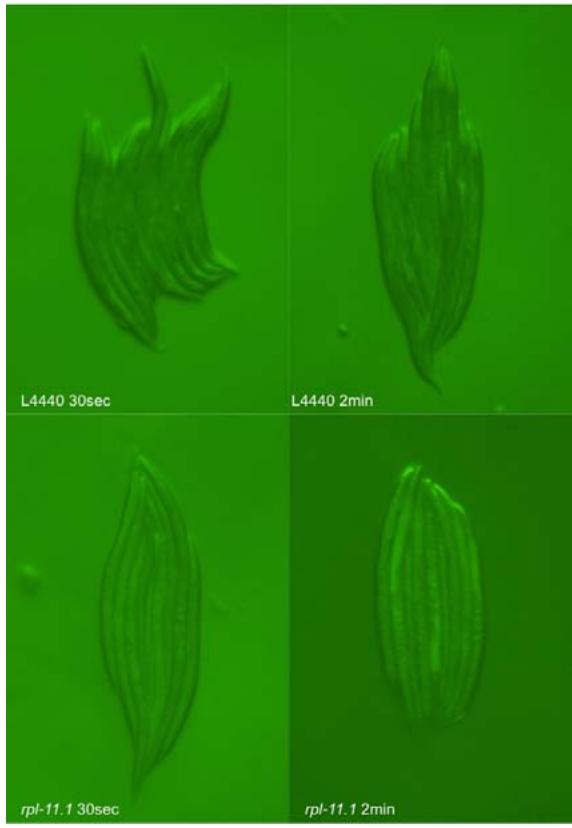
Figure 3: Micrographs of double-gene knockdown C. elegans PP563. Micrographs were taken at 31.6 ms exposure
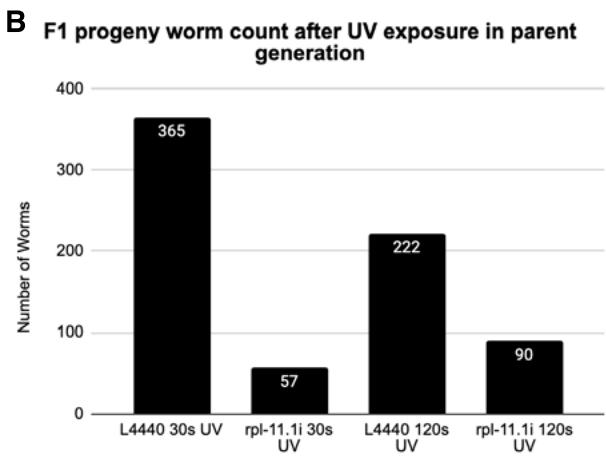
Figure 4: The F1 progeny of UV-treated nematodes. A. Micrographs of the F1 progeny of UV-treated nematodes. 10 worms from each group were randomly selected, aligned and immobilized. Micrographs were taken at 31.6 ms exposure and 2x gain. B. Worm count of F1 progeny after UV treatment in parent generation. L4440 and rpl-11.1 knockdown C. elegans PP563 adults are exposed to 30s or 120s UV radiation in gel imaging chamber. 5 worms from each group are transferred to new plates. Worm count was conducted after 3-day incubation at $25^{\circ}\mathrm{C}$
D; Bash,R; Lohr (2001). Yeast Chromatin Structure and Regulation of GAL Gene Expression.
Valerio Licursi,Chiara Salvi,Virginia De Cesare,Teresa Rinaldi,Benedetta Mattei,Claudia Fabbri,Giovanna Serino,Laylan Bramasole,Jacob Zimbler,Elah Pick,Brett Barnes,Martin Bard,Rodolfo Negri (2014). The COP9 signalosome is involved in the regulation of lipid metabolism and of transition metals uptake in <i>Saccharomyces cerevisiae</i>.
Iñigo Lasa (2012). An Effort to Make Sense of Antisense Transcription in Bacteria.
Vicent Pelechano,Lars Steinmetz (2013). Gene regulation by antisense transcription.
Rosa Karlić (2010). Histone Modification Levels Are Predictive for Gene Expression.
Sarah Stockwell (2022). The Yeast Galactose References Références Referencias Introduction 1.
Ingrid Lobo (2008). Environmental Influences on Gene Expression.
Andreas Mayer,Julia Di iulio,Seth Maleri,Umut Eser,Jeff Vierstra,Alex Reynolds,Richard Sandstrom,John Stamatoyannopoulos,L Churchman (2015). Native Elongating Transcript Sequencing Reveals Human Transcriptional Activity at Nucleotide Resolution.
Ian Davis,Samantha Pattenden (2019). Chromatin Accessibility as a Strategy to Detect Changes Associated With Development, Disease, and Exposure and Susceptibility to Chemical Toxins.
David Botstein,Steven Chervitz,Michael Cherry (1997). Yeast as a Model Organism.
I Miko,L Lejeune Essentials of Genetics.
P Mackiewicz,M Kowalczuk,D Mackiewicz,A Nowicka,M Dudkiewicz,A Laszkiewicz,M Dudek,S Cebrat (2002). How many protein-coding genes are there in the Saccharomyces cerevisiae genome?.
Alison Coluccio,Edith Bogengruber,Michael Conrad,Michael Dresser,Peter Briza,Aaron Neiman (2004). Morphogenetic Pathway of Spore Wall Assembly in <i>Saccharomyces cerevisiae</i>.
Jing Li,Seema Agarwal,G Roeder (2007). <i>SSP2</i> and <i>OSW1</i>, Two Sporulation-Specific Genes Involved in Spore Morphogenesis in <i>Saccharomyces cerevisiae</i>.
Laura Mcknight,Johnathan Crandall,Thomas Bailey,Orion Banks,Kona Orlandi,Vi Truong,Drake Donovan,Grace Waddell,Elizabeth Wiles,Scott Hansen,Eric Selker,Jeffrey Mcknight (2021). Rapid and inexpensive preparation of genome-wide nucleosome footprints from model and non-model organisms.
(2021). Illustrating Nature.
Pedro Prudêncio,Kenny Rebelo,Ana Grosso,Rui Martinho,Maria Carmo-Fonseca (2020). Analysis of Mammalian Native Elongating Transcript sequencing (mNET-seq) high-throughput data.
Benjamin Martin Transcription Shapes Genome-Wide Histone Acetylation Patterns.
Explore published articles in an immersive Augmented Reality environment. Our platform converts research papers into interactive 3D books, allowing readers to view and interact with content using AR and VR compatible devices.
Your published article is automatically converted into a realistic 3D book. Flip through pages and read research papers in a more engaging and interactive format.
Introduction-Earth has diverse and extreme environments so, for an organism to survive, it is vital that it is able to respond to changes in temperature, availability of food and even other organisms. For organisms to function properly, and adapt to these conditions, gene expression at the right time is essential. Gene expression is the process by which information in DNA is transferred to RNA molecules that create proteins for various functions. The control over the creation of proteins for a situation is essentially what gene expression and gene regulation is1. For instance Himalayan rabbits that were bred at temperatures less than 20 C had black sections of fur, while those bred at 35 C or more had completely white fur, suggesting differentiated gene expression for a changed condition-temperature2. The first step of gene expression is transcription, therefore measuring the levels of transcription of genes in different conditions can be an indicator of the effects of gene regulation. In order for transcription to occur, mRNA segments, named “transcripts”, are copied from DNA, so finding which mRNA transcripts are copied can indicate gene expression for various times and conditions. SAGE and Northern Blot techniques measure mRNA segments to analyze gene expression..
Our website is actively being updated, and changes may occur frequently. Please clear your browser cache if needed. For feedback or error reporting, please email [email protected]
Thank you for connecting with us. We will respond to you shortly.