White light interferometry was applied to obtain the rate change of an oxide film growth of aluminum samples during the anodization in aqueous solutions. The thickness (d) of the oxide film was determined by Fabry-Perot, i.e., white light, interferometry. In other words, for the first time, an electromagnetic, i.e., Fabry-Perot, method was utilized to obtain the rate change of the oxide film growth of aluminum samples rather than the electronic, i.e., direct current (DC) or alternating current (AC), methods, as a function of the time (t) of the anodization processes. Therefore, the abrupt rate change of the d(d)/dt was called anodization-emission spectroscopy. The anodization process of the aluminum samples was carried out by the DC method in different sulphuric acid concentrations (0.0,2,4,6,8,10% H2SO4) at room temperature. In the meantime, the Fabry-Perot interferometry was used to determine the difference between d of two subsequent values, d(d), as a function of the elapsed time, dt, of the DC experiment for the aluminum samples in H2SO4 solutions. The Fabry-Perot interferometry was based on a fiberoptic sensor to make real time-white light interferometry possible at the aluminum surfaces in the acid solutions.
## I. INTRODUCTION
Several opto-electrochemical spectrometers were developed by the author [1 & 2] for materials evaluation of pure aluminum in aqueous solutions. The spectrometers were developed based on incorporating a phase shift sensor-dependent on coherent (laser) light methods for measuring microscopic deformations and alternating current (AC) methods like electrochemical impedance spectroscopy (EIS) for determining electrochemical parameters of samples in aqueous solutions. Furthermore, the combination of the coherent light methods and the electrochemical techniques was applied not only as opto-electrochemical spectrometers for materials evaluation of pure aluminum in aqueous solutions but also for a surface detection of different 3D-micro-alterations at a spatial resolution equivalent to one half of the wavelength of the laser light used, $0.3\mathrm{mm}$ [1&2]. The developed spectrometers were a double layer (DL) capacitance-emission spectroscopy [1], and a resistance-emission spectroscopy [2], for determining the electrochemical behavior of anodized aluminum in aqueous solution. In the first spectrometer [1], the anodization process of the aluminum samples was carried out by chemical oxidation in different sulphuric acid concentration $(0.5 - 3.125\% \mathrm{H}_2\mathrm{SO}_4)$ at room temperature. In contrast, the second spectrometer [2], the anodization process of the aluminum samples was carried out by the electrochemical impedance spectroscopy (EIS) in different sulphuric acid concentrations $(1.0 - 2.5\% \mathrm{H}_2\mathrm{SO}_4)$ at room temperature.
Other investigators have studied the anodic dissolution processes of aluminum alloys by using the coherent light methods [3-8]. Only Qualitative results were reported from those investigators [3-8]. In contrast, the opto-electrochemical spectrometers [1&2] of the author were the first attempt to mathematically interpret interferometric patterns of the coherent light methods of aluminum samples under the anodic dissolution processes, thus far.
films during the anodization process by non-coherent (white) light methods, like Fabry-Perot interferometry, i.e., spectral optical-sensor [9-10].
A detection of anodization emission-spectra of oxide films of aluminum samples by non-coherent light methods was the focus of the present investigation. The detection was possible by using a simultaneously combination of non-coherent(white) light method, i.e., Fabry-Perot interferometry, and electrochemical DC methods. More specifically, the combination of Fabry-Perot interferometry and electrochemical DC methods was used as an emission spectrometer for determining the rate change of the growth of oxide films $\left[\mathrm{d}(\mathrm{d})/\mathrm{dt}\right]$ of the aluminum samples in aqueous solution. In this study, an externally applied potential, during the DC test, was applied to produce a thicker oxide layer than the layer that aluminum normally has in the air [11-13]. Also, by detecting the emission spectra of the anodized films of aluminum samples $\left[\mathrm{d}(\mathrm{d})/\mathrm{dt}$ versus time of the anodization(t)], one can determine the growth rate $\left[\mathrm{d}(\mathrm{d})/\mathrm{dt}\right]$ behavior of the oxide film of aluminum in real-time, in the solution by white light interferometry.
## II. THEORETICAL ANALYSIS
It is well known that the formation of the oxide film (d) on a metal sample can be measured by Fabry-Perot interferometry as follows [9-10].
$$
\mathrm {d} = [ \phi (\omega) \lambda ] / [ 2 \pi n _ {\mathrm {A}} \cos \theta_ {2} ] \tag {1}
$$
Where,
$\phi (\omega)$ is the phase difference between the oxide/electrolyte interface.
$\lambda$ is the wavelength of the incident light.
- $\nu_{\mathrm{A}}$ is the refractive index of the oxide film.
- $\theta_{2}$ is the reflected angle of the incident light.
So, $d$ can be determined (via Equation (1)) by measuring the reflection parameters of the white light, i.e., $\phi(\omega), \theta_2$, of the oxide film in aqueous solution. Consequently, the emission spectroscopy of the oxide film can be detected by plotting $d(d)/dt$ versus the elapsed time of the DC experiment, where $d(d) = d(t_1) - d(t_0)$ is the difference between $d$ of two subsequent values at $t_1$ and $t_0$, respectively. Therefore, a plot of $d(d)/dt$ versus time, will reflect the abrupt rate change, emission spectroscopy, of the growth of the oxide film as a function time.
It is worth mentioning that the reflection of the white light of the oxide film in aqueous solution has been not affected by the porosity nucleation and porosity expansion in the oxide film as the film thickens. In general, the pore sizes were much lower than the white light resolution, $0.35\mathrm{mm}$, in order to the pores to affect the reflection parameters of the white light, i.e., $\phi (\omega)$, $\theta_{2}$, of the oxide film in aqueous solution.
## III. EXPERIMENTAL PROCEDURES
Aluminum samples were cut from a pure aluminum (99.7%) sheets with a specification of 5 cm x 5 cm x 0.15 cm. Then, the aluminum samples were surface treated by a procedure called chemical mechanical polishing (CMP) [14]. The CMP's procedure involves annealing and electropolishing of the samples to smoothen the surface roughness to a mirror-like surface. Details on the CMP's procedure are given elsewhere [14-16]. A range of a potential value was applied during the CMP's procedure. The potential range was selected based to the requirement of current density on the specific area of the samples to produce a mirror-finished surface of aluminum samples during the CMP's procedure. Thereafter, one side and all edges of the samples were coated with a coal tar (black) epoxy (polyamide cured) in order to shield those sides from anodization. Then, the bared side of the sample, i.e., working electrode, was anodized in the presence of 0 (0% is deionized water only), 2, 4, 5, 6, 8, and $10\%$ $\mathrm{H}_2\mathrm{SO}_4$ (vol%) solutions at room temperature (about $20^{\circ}\mathrm{C}$ ). The other electrodes of the electrochemical cell were a graphite electrode, i.e., as a counter electrode, and a Saturated Calomel Electrode (SCE), as a reference electrode [9-10]. A potentiostat (EG&G Princeton applied research model 363) was used as a DC power source. The corrosion potential (open circuit potential (OCP)) was monitored, as soon as the sample immersed in the solution, with respect to the SCE. Then, the potentiostat was used as an external DC power source to apply a 9 V potential with respect to the recorded OCP of the sample in solutions, for 90 minutes. Subsequently, the anodic current was recorded during the anodization process [9-10].
The growth of aluminum oxide film during the anodization of the aluminum samples in solutions was monitored by a combination of a fiber optics-based sensor, for a simultaneous application of the real-time Fabry-Pe'rot interferometry, and the DC electrochemical method [9-10]. The fiber optics-based sensor consists of a fiber set and a collimator, i.e., a collimating lens, that were inserted in a glass tube. The fiber set and the collimator were used not only to reduce the distance of incident light from the sample, but also to transverse the white light to reach the immersed aluminum sample in the electrochemical cell, as shown in Figure 1 [10]. The phenomenon of multiple reflections normally occurs inside the aluminum oxide film as soon as the white light reaches the sample, causing Fabry-Pe'rot effect [17]. A chromium coated-glass slide was used as a three-port beam splitter to split the white light beam into two beams, as shown in Figure 1. The white light source was a 20W Halogen lamp (spectral range from 500 to $900\mathrm{nm}$ ). Besides, the Ocean Optics USB4000 spectrometer was used for analyzing the reflected light from the samples.
The light was guided and collected in a large core, $1\mathrm{mm}$ diameter, multimode optical fiber [9-10].
Since the resolution of the high-density spectrometer is $0.2\mathrm{nm}$, therefore the sensitivity of the thickness change given by $\Delta \delta /\delta = \Delta \lambda /\lambda$ will yield a sensitivity of approximately $3\times 10^{4}$ at the central wavelength of (700 nm) the white light source. So, one light beam is transverse to the aluminum sample in the electrochemical cell and the other beam is transverse to a high-density spectrometer, Fig.1. Meanwhile, a reflection spectrum obtained from Fabry-Perot interferometry was recorded by the high-density spectrometer after a specific time interval (every 10 minutes) [9-10]. Subsequently, the thickness (d) of the aluminum oxide film was obtained during the formation of the oxide film [9-10].
Eventually, the abrupt rate change of the growth $\left[\mathrm{d}(\mathrm{d})\right]$ of the aluminum samples in $\mathrm{H}_{2}\mathrm{SO}_{4}$ solutions was determined. In addition, a scanning electron microscopy (SEM) was used to determine the final d values of the oxide film of the aluminum samples in $\mathrm{H}_{2}\mathrm{SO}_{4}$ solutions. It is worth noting that the total bare-surface area of the aluminum samples was $5\mathrm{cm}^2$ $5\mathrm{cm} = 25\mathrm{cm}^2$. On the contrary, the exposed surface area of the aluminum samples to the $\mathrm{H}_{2}\mathrm{SO}_{4}$ solution was $22.5\mathrm{cm}^2$ 9.. In other words, the unexposed surface area of the aluminum samples to the $\mathrm{H}_{2}\mathrm{SO}_{4}$ solution was $2.5\mathrm{cm}^2$. Therefore, the final d values of the oxide film of the aluminum samples was determined by the SEM at the interface between the exposed surface area and the unexposed surface area of the aluminum samples in 0, 2, 4, 6, 8,10% $\mathrm{H}_{2}\mathrm{SO}_{4}$ solutions. Figure 2a is an example of a SEM of the final thickness of the aluminum oxide film in $8\%$ $\mathrm{H}_{2}\mathrm{SO}_{4}$ solution. The diagonal line in the SEM images (Fig.2) represents the interface line between the exposed surface area and the unexposed surface area of the aluminum samples in $8\%$ $\mathrm{H}_{2}\mathrm{SO}_{4}$ solution. The approach of the SEM measurement of the final thickness of the aluminum oxide film was adopted in the present work to precisely match the d measurement by Fabry-Perot interferometry with respect to the unexposed surface area of the aluminum samples to the acid solutions.
It is worth mentioning that the novelty of the present work lies in the fact that for the first time, spectral interferometry of forming an oxide film was converted to anodization-emission spectroscopy by obtaining the rate change[d(d)/dt] of the forming oxide film of aluminum samples under applied DC potential by white light. In other words, a new electrochemical-emission spectrometer was developed for studying in situ the growth rate [d(d)/dt] of the oxide film of the aluminum in $\mathsf{H}_2\mathsf{SO}_4$ solutions. In contrast, the early work of the authors [9] was about the anodization process, i.e., measuring only the oxide film growth, of aluminum sample in $4\%$ sulfuric acid $(\mathsf{H}_2\mathsf{SO}_4)$ solution by the combination of Fabry-Perot, i.e., white light, interferometry and DC methods at room temperature.
Likewise, the measurement of the corresponding current density of the forming oxide film was demonstrated by the authors[10] in 0,2,4,6,8, and $10\%$ sulfuric acid $\left(\mathrm{H}_{2} \mathrm{SO}_{4}\right)$ solution by the combination of Fabry-Perot, i.e., white light, interferometry and DC methods at room temperature.
On the contrary, the thickness of cadmium sulfide (CdS) thin films during the growth film was determined [18] by precipitation of the film at a glass substrate. in an aqueous solution of, $30~\mathrm{mM}$ cadmium acetate and thioacetamide solution, at $60^{\circ}\mathrm{C}$ temperature by only Fabry-Perot, i.e., white light, interferometry.
## IV. RESULTS AND DISCUSSION
Figure 2 illustrates an example of the thickness of the oxide film of the aluminum samples (anodized in $8\%$ $\mathrm{H}_2\mathrm{SO}_4$ respectively) observed by SEM closely correspond to the thickness obtained from optical fiber based electrochemical sensor. Therefore, the proposed sensor based on Fabry-Pérot interferometric technique with the combination DC electrochemical method can successfully measure the thickness of anodic alumina (AAO) film during the anodization process. However, some variation could happen between real time measured thicknesses of AAO compared to SEM measurements since DC electrochemical anodization takes place in a highly resistive environment. The measurement error in case of in-situ measurement of thickness of anodic alumina is $\pm 0.02\mu \mathrm{m}$ and SEM measurement is $\pm 0.03\mu \mathrm{m}$.
Figure. 3. shows plotted data of the thickness of the oxide film (d) versus the elapsed time of the aluminum samples in $\mathrm{H}_2\mathrm{SO}_4$ solutions. It is obvious from Fig.3 that the growth of the oxide films has been triggered from the beginning of the anodization time of the aluminum samples by the applied potential of $9\mathrm{V}$ potential with respect to the recorded OCP of the sample in solutions, for 90 minutes. The growth of the oxide films (d) was observed to increase with increasing the acid concentration in a stepwise manner for all aluminum samples during the elapsed time of the experiment. In other words, the growth of the oxide films (d), in Fig.3, is basically an accumulation of optical waves, i.e., spectra, of the Fabry-Perot interferometry as indicated in Equ.1.
In general, that the final thickness of the $\mathrm{Al_2O_3}$ films (d) in $0.0\%$ $\mathrm{H_2SO_4}$, $(0.925\mu m)$, $2.0\%$ $\mathrm{H_2SO_4}$, $(2.135\mu m)$, $4.0\%$ $\mathrm{H_2SO_4}$, $(2.34\mu m)$, $6\%$ $\mathrm{H_2SO_4}$, $(2.1\mu m)$, $8.0\%$ $\mathrm{H_2SO_4}$, $(2.661\mu m)$, and $10\%$ $\mathrm{H_2SO_4}$, $(3.8\mu m)$ was recorded to increase as the concentration of the $\mathrm{H_2SO_4}$ increased. The final thickness of the $\mathrm{Al_2O_3}$ films (d) by Fabry-Perot interferometry was found in a good agreement with those measured by SEM, in $0.0\%$ $\mathrm{H_2SO_4}$, $(0.925\mathrm{m})$, $2.0\%$ $\mathrm{H_2SO_4}$, $(2.14\mu m)$, $4.0\%$ $\mathrm{H_2SO_4}$, $(2.34\mu m)$, $6\%$ $\mathrm{H_2SO_4}$, $(2.07\mu m)$, $8.0\%$ $\mathrm{H_2SO_4}$, $(2.7\mu m)$, and $10\%$ $\mathrm{H_2SO_4}$, $(3.81\mu m)$. It seems that the final thickness of the $\mathrm{Al_2O_3}$ films (d) by Fabry-Perot interferometry and SEM in 2.0,4.0,6.0,8.0,10% $\mathsf{H}_2\mathsf{SO}_4$ is ranged from 100 to $300\%$ higher than that in $0.0\%$ deionized water. This is because of the high resistance of the water in comparison to the acid solutions.
The final growth rate $\left[\mathrm{d}(\mathrm{d}) / \mathrm{dt}\right]$ of the $\mathrm{Al}_{2}\mathrm{O}_{3}$ films in $2.0\%$ $\mathrm{H}_{2}\mathrm{SO}_{4}$ (20.1 nm/min.), $4.0\%$ $\mathrm{H}_{2}\mathrm{SO}_{4}$, (24.3 nm/min.), $6\%$ $\mathrm{H}_{2}\mathrm{SO}_{4}$ (19.8 nm/min.), $8.0\%$ $\mathrm{H}_{2}\mathrm{SO}_{4}$ (30.1 nm/min.), and $10\%$ $\mathrm{H}_{2}\mathrm{SO}_{4}$ (38.7 nm/min.) was recorded to increase as the concentration of the $\mathrm{H}_{2}\mathrm{SO}_{4}$ increased, except for the $\mathrm{Al}_{2}\mathrm{O}_{3}$ films [d(d)/dt] in $6.0\%$ $\mathrm{H}_{2}\mathrm{SO}_{4}$, (19.8 nm/min), in which the entire d(d)/dt was found lower than the rest of the obtained d(d)/dt. This abnormality can be explained due to the final thickness values of the $\mathrm{Al}_{2}\mathrm{O}_{3}$ films (d) in $6\%$ $\mathrm{H}_{2}\mathrm{SO}_{4}$ by Fabry-Perot interferometry (2.1□□m), and in $6\%$ $\mathrm{H}_{2}\mathrm{SO}_{4}$, (2.07 μm) by SEM were lower than the rest of the obtained d by Fabry-Perot interferometry and SEM, respectively.
In contrast, Figure. 4. shows plotted data of the $\mathrm{d}(\mathrm{d})/\mathrm{dt}$ versus the elapsed time of the aluminum samples in $\mathrm{H}_2\mathrm{SO}_4$ solutions. From Fig. 4, one can determine the abrupt rate change of the growth rate of the oxide film of the aluminum samples in different solutions as a result of the anodization process. In other words, the rate change of the growth of the oxide films $(\mathrm{d}(\mathrm{d})/\mathrm{dt})$, in Fig.4, is basically the first derivative of the optical waves, i.e., spectra, with respect to time. Therefore, any abrupt rate change of emitted spectra was called emission-spectroscopy as a result of the anodization processes.
In general, the rate change of the $\mathrm{d}(\mathrm{d})/\mathrm{dt}$ was observed, from Fig.4, to increase in responding to the increase of the acid concentration for all aluminum samples during the elapsed time of the experiment. On the contrary, an abrupt rate change of the $\mathrm{d}(\mathrm{d})/\mathrm{dt}$ of the oxide film of the aluminum in 2.0-10.0% $\mathrm{H}_2\mathrm{SO}_4$ and in deionized water (0.0% $\mathrm{H}_2\mathrm{SO}_4$ ) was recorded in one occasion. The abrupt rate change was observed only to occur between 10 to 20 minutes. The observation of the abrupt rate change in Fig.4 could happen as a result of an unstable transient condition during the $\mathrm{Al}_2\mathrm{O}_3$ formation, i.e., crazing of $\mathrm{Al}_2\mathrm{O}_3$ film [11 &12]. Then, the $\mathrm{d}(\mathrm{d})/\mathrm{dt}$ of the oxide film was recorded around zero, [d(nearly constant value=18 nm/min)/dt], between 20 to 30 minutes. Eventually, the $\mathrm{d}(\mathrm{d})/\mathrm{dt}$ of the oxide film was gradually increased during the remaining elapsed time of the experiment.
## V. CONCLUSIONS
1. For the first time, the combination of the Fabry-Perot, white light, interferometry and DC techniques was used to develop a new spectrometer for studying in situ the growth rate $\left[\mathrm{d}(\mathrm{d}) / \mathrm{dt}\right]$ of the oxide film of the aluminum in $\mathrm{H}_{2} \mathrm{SO}_{4}$ solutions.
2. The abrupt rate change of the $d(d)/dt$ of the oxide film represents the anodization-emission spectroscopy, during the simultaneous recordings of Fabry-Perot interferometry and the DC tests, of the aluminum samples in different $\mathsf{H}_2\mathsf{SO}_4$ solutions.
3. In general, the rate change of the $\mathrm{d}(\mathrm{d}) / \mathrm{d}t$ was observed to increase with increasing the acid concentration in a stepwise manner for all aluminum samples during the elapsed time of the experiment.
4. On the contrary, the abrupt rate change, $\mathrm{d}(\mathrm{d}) / \mathrm{d}t$, of the oxide film of the aluminum in $2.0 - 10.0\%$ $\mathrm{H}_2\mathrm{SO}_4$ and in deionized water ( $0.0\%$ $\mathrm{H}_2\mathrm{SO}_4$ ) was recorded once.
5. The abrupt rate change was observed to occur between 10 to 20 minutes. Then, the $\mathrm{d}(\mathrm{d}) / \mathrm{dt}$ of the oxide film was recorded around zero [d(nearly constant value = 18 nm/min)/dt], between 20 to 30 minutes. Eventually, the $\mathrm{d}(\mathrm{d}) / \mathrm{dt}$ of the oxide film was gradually increased during the remaining elapsed time of the experiment.
### Data availability statement
Compliance with Ethical Standards
The authors have no objection of the following issues:
1. To "disclosure of potential conflicts of interest".
2. To declare "research involving human participants and/or Animals".
3. To take any action concerning the submitted article by "informed consent".
Reflected light (wave) goes to spectrometer via optical fiber
Fig. 1: The optical fiber setup of transverse light from the Halogen lamp to the spectrometer and the Al sample through a beam splitter

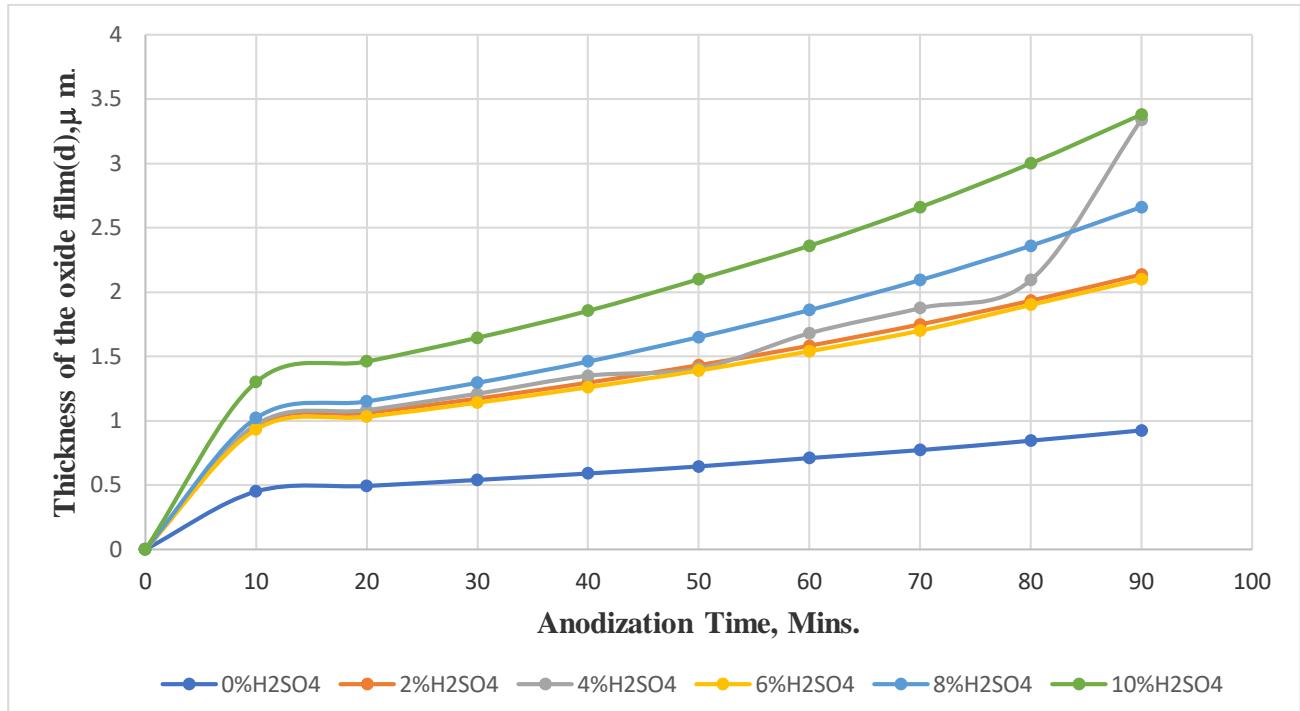 Fig. 2: An image of SEM of the final
$\mathrm{Al}_{2}\mathrm{O}_{3}$ film thickness of aluminum in $8\%$ $\mathrm{H}_2\mathrm{SO}_4$ solution, respectively Fig. 3: Growth of the $\mathrm{Al_2O_3}$ films (d) during the anodization time of Al sample in 0.0,2.0,4.0,6.0,8.0, and $10\%$ $\mathrm{H}_2\mathrm{SO}_4$ solutions
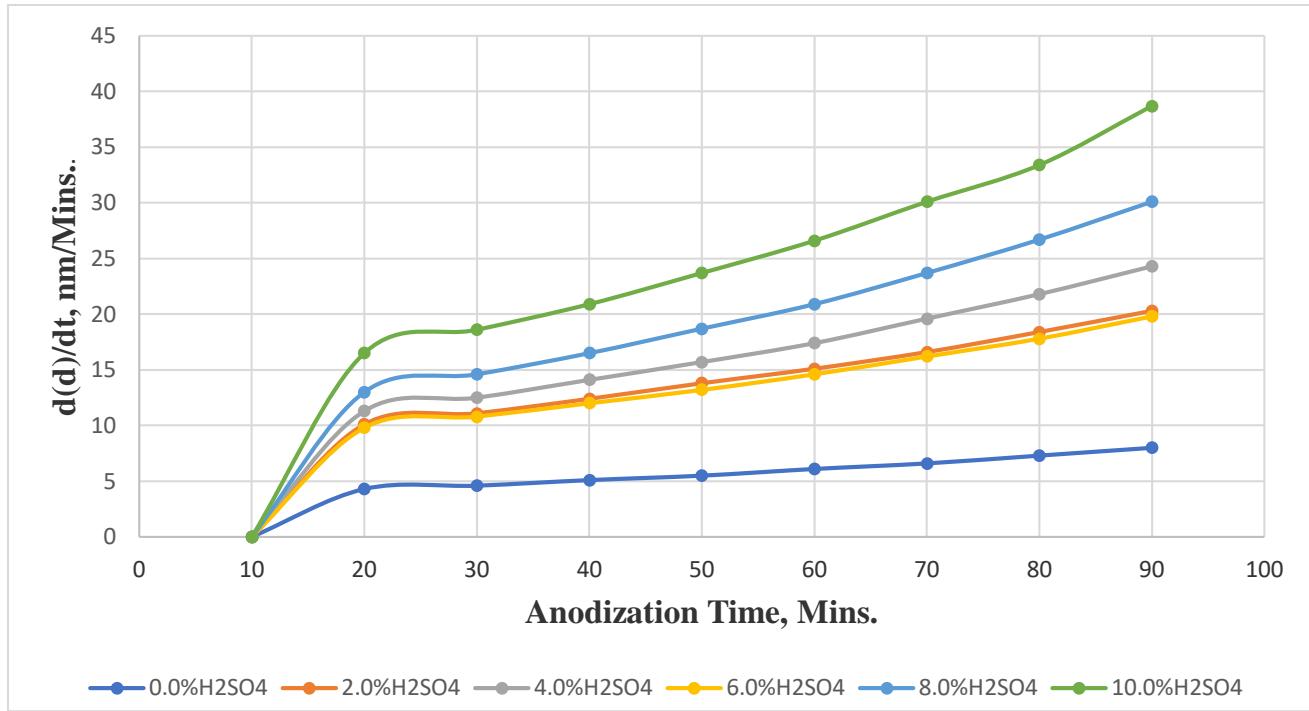 Fig. 4: Growth rate (d(d)/dt) of
$\mathrm{Al}_{2}\mathrm{O}_{3}$ films during the anodization time of Al sample in 0.0,2.0,4.0,6.0,8.0, and $10\%$ $\mathrm{H}_2\mathrm{SO}_4$ solutions
Generating HTML Viewer...
References
19 Cites in Article
K Habib (2009). DL capacitance-emission spectroscopy of determining the electrochemical behavior of anodized aluminum in aqueous solution.
K Habib (2016). Opto-electrochemical spectroscopy of metals in aqueous solutions.
C Zhang,H Cai,Z Cao,J Gao,C Zhang,Cao (2005). Evolution of the electrochemical characteristics during pitting corrosion of pure aluminum in sodium chloride solution.
Rudolf Potucek,Richard Rateick,Viola Birss (2006). Erratum: Impedance Characterization of Anodic Barrier Al Oxide Film Beneath Porous Oxide Layer [J. Electrochem. Soc., 153, B304 (2006)].
J Sarkar,G Khan,A Basumallik (2007). Nanowires: properties, applications and synthesis via porous anodic aluminium oxide template.
Liang Li,Chao Wang,Shenhao Chen,Xianmin Hou,Xuegeng Yang (2008). Investigation of the pitting of aluminum induced by chloride ions by holographic microphotography.
J Lu,G Zou (2010). Application of speckle technique in corrosion process monitoring of an aluminum alloy.
Boyu Yuan,Chao Wang,Liang Li,Shenhao Chen (2012). Fast visualization of the mass transfer processes at the electrode/electrolyte interface with a Mach-Zehnder interferometer.
Farzia Karim,Tanujjal Bora,Mayur Chaudhari,Khaled Habib,Waleed Mohammed,Joydeep Dutta (2017). Measurement of aluminum oxide film by Fabry–Pérot interferometry and scanning electron microscopy.
Khaled Habib,Waleed Mohammad,Farzia Karim,Joydeep Dutta (2021). Electrochemical parameters of aluminum oxide film in situ during anodization of aluminum by white light-optical interferometry.
H Uhlig (1971). Corrosion and corrosion control — an introduction to corrosion science and engineering. 2. auflage von H. H. Uhlig, Wiley‐Interscience, New York, 419 S., 140 abb., 38 tab.; 50,‐ DM.
Astm (1994). Test Method for Measurement of Impedance of Anodic Coatings on Aluminum.
Khaled Habib (2012). Measurement of surface resistivity and surface conductivity of anodised aluminium by optical interferometry techniques.
H Shi Kuo,Ta Tsai,W (2000). Electrochemical behavior of aluminum during chemical mechanical polishing in phosphoric acid base slurry.
O Jessensky,F Muller,U Go¨sele (1998). Self-organized formation of hexagonal pore arrays in anodic alumina.
J Gonzaaˆ Lez,V Loaˆ Pez,A Bautista,E Otero,X Noaˆ Voa (2012). Characterization of porous aluminum oxide films from A. C. impedance measurements.
G Hernandez (1986). Fabry-Pe´rot Interferometers.
Farzia Karim,Tanujjal Bora,Mayur Chaudhari,Khaled Habib,Waleed Mohammed,Joydeep Dutta (1013). Optical fiber-based sensor for in situ monitoring of cadmium sulfide thin-film growth.
Khaled Habib,Waleed Mohammad,Farzia Karim,Joydeep Dutta (2019). Electrochemical Parameters of Aluminum Oxide Film in Situ During Anodization of Aluminum by White Light-Optical Interferometry.
No ethics committee approval was required for this article type.
Data Availability
Not applicable for this article.
How to Cite This Article
Khaled Habib. 2026. \u201cNew Spectro-Electrochemical Setup for Determining the Rate Change of Oxide Film Growth of Aluminum by White Light-Optical Interferometry\u201d. Global Journal of Science Frontier Research - A: Physics & Space Science GJSFR-A Volume 22 (GJSFR Volume 22 Issue A5).
Explore published articles in an immersive Augmented Reality environment. Our platform converts research papers into interactive 3D books, allowing readers to view and interact with content using AR and VR compatible devices.
Your published article is automatically converted into a realistic 3D book. Flip through pages and read research papers in a more engaging and interactive format.
Our website is actively being updated, and changes may occur frequently. Please clear your browser cache if needed. For feedback or error reporting, please email [email protected]
Thank you for connecting with us. We will respond to you shortly.