
Introduction
It is well known and largely documented that some lifestyle behaviors such as dietary habits, smoking and physical activity may have a role in the etiology of several chronic diseases [1-3] The Seven Countries Study of Cardiovascular Diseases (SCS) has contributed to show these facts by ecological analyses (mainly for diet) [4] and separately for smoking habits and physical activity (in individual analyses) [5,6] in relation with some cardiovascular diseases (CVD). However, a comprehensive analysis dealing with the abovementioned behaviors has never been attempted. In the present analysis our interest is to establish how much lifestyle behaviors explain differences in mortality from different CVD across the various cohorts and during an extremely long follow-up period. All data used for analysis were taken and properly quoted from previous publications and then combined and handled to answer the question of this analysis. As a consequence, this paper can be classified as a focused review, yet confined to data from a single study.
Several investigators have already examined the role of lifestyle behaviors as potential causes of CVD. The literature includes numerous studies, including some from our research group, with CVD as endpoints, and characteristics of these results in relation with this analysis will be discussed [7-20].
MATERIAL AND METHODS
Population and measurements. The Seven Countries Study cohorts were enrolled and first examined between 1958 and 1964, being located in the USA, Finland, the Netherlands, Italy, former Yugoslavia (the two federated republics of Croatia and Serbia), Greece and Japan for a total of 16 cohorts and 12,763 men aged 40-59 years.
Ten cohorts were located in rural communities, one in a fishing community, four in defined occupational groups, one as a random sample of a small town. At baseline examination data on dietary habits, habitual physical activity and smoking habits were collected using various methodologies. Dietary habits were expressed by 17 food groups derived from a complex dietary survey made at home of randomly selected subsamples of men in each cohort, with recording type and weight of amounts of food groups during a week, repeated in two different seasons; data were reported as means for each cohort’s sample [4,21]; habitual physical activity derived by a short questionnaire on the occupational activity and later validated, on a subgroup of cohorts, by its association with a score of fitness [6,22]; smoking habits derived from a questionnaire during the physical examination [22]. Both physical activity and smoking data derived from all men examined at entry.
Mortality data were systematically collected and coded. For the purpose of this analysis the time horizon for mortality was fixed after the first 50 years of follow-up. At that time, mortality data were practically complete for 10 cohorts, while they were limited to shorter follow-ups for the other 6 cohorts. Therefore, we adopted the procedure already successfully tested in other analyses [4], where incomplete 50-year mortality rates for cohorts with shorter follow-up were estimated using regression equations derived from the 10 cohorts having complete mortality data for 50 years. In this way, all-cause mortality covered about 97% of the denominator while death rates were expressed per 1000 person/years in 50 years. Actually, there were three cohorts in Serbia whose follow-up was limited to 45 years and in this case the probable mistake was limited considering the small number of survivors at that date and the minimal number of new case-specific events estimated during the next 5 years. Three other cohorts (1 in Italy, 2 in Croatia) had a follow-up of only 25 years and the problem could be more serious. Therefore the estimate of overall Behavior Score was rerun using only the cohorts with full 50 year follow-up plus the three from Serbia for a total of 13 cohorts. A related correlation matrix was produced and presented in the Appendix Table 1. The outcome was practically the same as for the previous matrix.
Mortality data were collected using also other information beyond the death certificate and coded according to the 8th Revision of the WHO International Classification of Diseases (ICD-8) [23] by a single coder who followed defined rules. In case of multiple causes and uncertainty about the principal one, a rank system was applied with violence, cancer, coronary heart disease, stroke and others in that order.
Mortality end-points were the following: 1) coronary heart disease (CHD) including cases of myocardial infarction, acute ischemic attacks, and sudden coronary death, after the exclusion of other possible causes; cases with mention or evidence of Chronic Coronary Heart Diseases or classified as Other Ischemic Heart Disease were not included in this group for reasons given elsewhere [24,25]; however, healed myocardial infarction was retained in this group; 2) Heart Diseases of Uncertain Etiology (HDUE) including symptomatic heart disease, hypertensive heart disease and cases vaguely quoted as chronic or other types of coronary heart disease, in the absence of typical coronary syndromes; usually they were manifested as heart failure, arrhythmia and blocks; 3) any type of cerebrovascular diseases except TIA (Stroke); 4) CVD was the sum of CHD plus HDUE plus Stroke. The above classification is reported in details in Table 1, together with the correspondent ICD-8 codes. Mortality data for analysis were taken from a single published source [26].
Table 1. Types of cardiovascular diseases used as end-points in the analysis.
| END-POINT | ENCOMPASSED CONDITIONS | ICD-8 CODES |
|---|---|---|
| 1. Coronary heart disease (CHD) | Myocardial infarction (acute and healed), acute ischemic attacks, and sudden coronary deaths | 410, 411, part of 412, 795 |
| 2. Heart Diseases of Uncertain Etiology (HDUE) | Symptomatic heart diseases (heart failure, arrhythmias and blocks), Hypertensive Heart diseases, Chronic/Other ischemic heart diseases without typical coronary syndromes | 427, 402-404, part of 412, 414 |
| 3. Stroke | All types of cerebrovascular diseases, excluding Transient Ischemic Attacks (TIA). | 430-438 (excluding 435) |
| 4. Total major cardiovascular diseases (CVD) | The aggregate sum of CHD+HDUE+Stroke | All codes listed above |
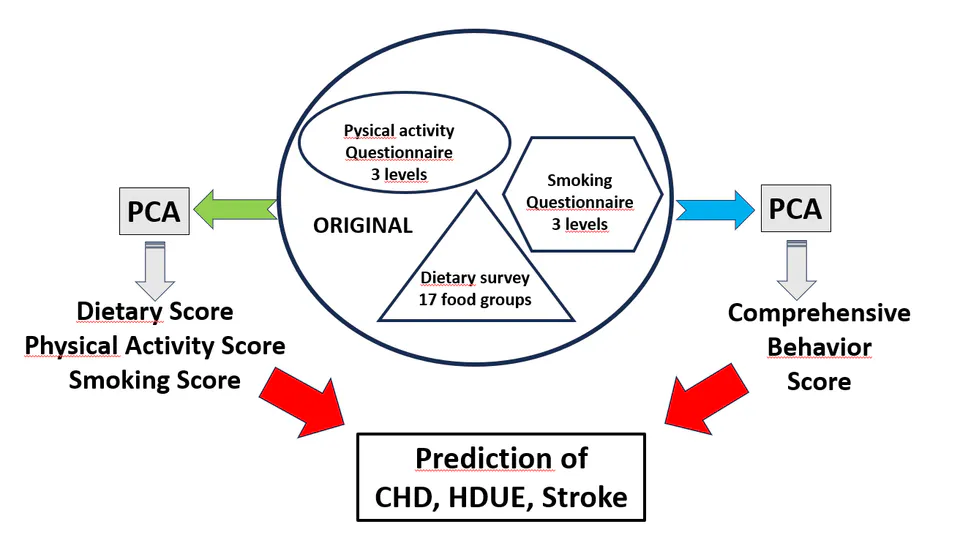
Statistical Analysis. The 17 food-groups were forced into a Principal Components Analysis (PCA) obtaining a factor score called Dietary Score, made available for each cohort. Although not strictly necessary from the analytical point of view, the same procedure was adopted for three classes of physical activity (sedentary, moderate and vigorous) and three classes of smoking habits (never, ex-smokers, smokers), obtaining the Physical Activity Score and the Smoking Score, in order to be coherent with the dietary approach. The PCA for the estimate the overall Behavior Score was created by forcing in the system the 3 original levels of physical activity and of smoking habits plus the 17 food groups of the dietary survey. The list of the variables used in this PCA is reported in Appendix Table 2. Figure 1 depicts the methods adopted in relation to PCA procedures to obtain the comprehensive behavior score aimed at predicting CHD, HDUE, and Stroke.
A descriptive statistic was computed and tabulated for the distribution of the various scores in the 16 cohorts and of the four endpoints in the same 16 cohorts. Simple and multiple regression models were solved with the Behavior Score and separately its three components as independent variables and the four end-points as dependent variables.
Data were reported separately for the four groups of diseases, considering individually the three behaviors and using their pool expressed by the Behavior Score.
Results
The factor scores of the various PCA (Table 2) related to the 16 cohorts showed a large variability, although it cannot be expressed by traditional tools because the output of the PCA is treated (by rule) with the Z score distribution whose mean = 0 and standard deviation = 1. The range of the various scores were relatively large but not necessarily comparable one each other. The healthy diets (corresponding to negative levels of the score) are located in Southern Europe, Croatia and Japan, the not-healthy (positive levels) were located in the USA, Northern Europe and Serbia. The distribution of the healthy physical activity levels (corresponding to scores with high levels) of the score did not follow a clear geographical trend but was almost systematically present in the rural communities. The smoking habits score did not follow a clear geographical trend but, again, the positive levels (corresponding to relatively low prevalence) was frequent in rural areas. Finally, the composite Behavior Score derived from pooling the three components had the largest range and represented a kind of balance, with 9 cohorts (low, negative levels) on the healthy side mainly located in Southern Europe and Japan.
Table 2. PCA scores for Diet, Physical activity, and Smoke plus Behavior Score in the 16 cohorts. Rank in increasing way.
| Cohort | Diet | Physical activity | Smoke | Behavior Score | Rank for Behavior Score |
|---|---|---|---|---|---|
| US Railroad | 0.6894 | -1.7306 | -0.1494 | 1.3792 | 16 |
| East Finland | 1.7497 | 0.6102 | -1.0186 | 1.2628 | 15 |
| West Finland | 1.6461 | 0.7991 | 0.2620 | 1.2347 | 14 |
| Zutphen (the Netherlands) | 1.2287 | -1.3027 | -1.6918 | 1.2333 | 13 |
| Crevalcore (Italy) | -0.1775 | 0.5524 | 0.1151 | -0.3316 | 6 |
| Montegiorgio (Italy) | -0.8587 | 0.5303 | 0.3032 | -0.6985 | 3 |
| Rome Railroad (Italy) | -0.6247 | -0.4823 | -0.4832 | -0.2886 | 8 |
| Dalmatia (Croatia) | -0.1624 | 0.9019 | 0.6050 | -0.3878 | 5 |
| Slavonia (Croatia) | -0.2855 | 0.6791 | 0.2885 | -0.3115 | 7 |
| Velika Krsna (Serbia) | 0.0251 | 1.4995 | 1.7651 | -0.4508 | 4 |
| Zrenjanin (Serbia) | 0.0135 | -0.7662 | 0.3657 | 0.2932 | 11 |
| Belgrade (Serbia) | 0.5365 | -1.7883 | 2.0435 | 0.8507 | 12 |
| Crete (Greece) | -0.1178 | 0.3334 | 0.5104 | -0.0379 | 9 |
| Corfu (Greece) | -0.3526 | -0.6854 | 0.0418 | 0.2828 | 10 |
| Tanushimaru (Japan) | -1.4633 | 0.0872 | -0.9454 | -1.4788 | 2 |
| Ushibuka (Japan) | -1.8463 | 0.7624 | -1.2806 | -2.9609 | 1 |
| Healthy levels | low | high | high | low | low |
| Range | 3.59 | 2.58 | 3.32 | 4.34 | – |
Death rates in the 16 cohorts (Table 3) showed different patterns bound to the various CVD subgroups. Higher levels of CHD were found in North America, Northern Europe and, partly, in the Serbian cohorts. The distribution of HDUE did not show a clear geographical trend, but high levels were seen in two of the Serbian cohorts. In the case of Strokes, the highest levels were found again in Serbia and Japan. The pool of all CVD represented a balance of the above distributions with overall levels greater than or very close to 20 per 1000 person/years in Finland, Slavonia (Croatia) and two Serbian cohorts. The coefficient of variation of the distribution was rather high for CHD and HDUE, definitely lower for Stroke and CVD.
Table 3. Mortality rates in 50 years expressed per 1000 person/year for different types of CVD. Rank decreasing.
| Cohort | CHD rate | CHD rank | HDUE rate | HDUE rank | Stroke rate | Stroke rank | CVD rate | CVD rank |
|---|---|---|---|---|---|---|---|---|
| US | 10.86 | 3 | 4.02 | 6 | 3.31 | 15 | 18.19 | 6 |
| EF | 17.34 | 1 | 2.63 | 11 | 4.31 | 11 | 24.28 | 2 |
| WF | 12.93 | 2 | 2.39 | 14 | 4.42 | 10 | 19.74 | 5 |
| ZU | 10.47 | 5 | 2.56 | 12 | 3.22 | 16 | 16.25 | 8 |
| CR | 7.22 | 7 | 3.85 | 8 | 4.18 | 13 | 15.24 | 11 |
| MO | 5.11 | 11 | 5.53 | 4 | 6.35 | 7 | 16.99 | 9 |
| RR* | 6.21 | 10 | 3.98 | 7 | 3.92 | 14 | 14.11 | 12 |
| DA* | 4.66 | 12 | 3.34 | 10 | 5.92 | 8 | 13.92 | 13 |
| SL* | 6.72 | 8 | 6.79 | 2 | 8.52 | 2 | 22.03 | 4 |
| VK* | 6.37 | 9 | 8.82 | 1 | 7.60 | 3 | 22.79 | 3 |
| ZR* | 9.85 | 6 | 5.89 | 3 | 9.50 | 1 | 25.24 | 1 |
| BE* | 10.52 | 4 | 2.56 | 13 | 4.23 | 12 | 17.31 | 7 |
| KT | 4.65 | 13 | 3.85 | 9 | 4.83 | 9 | 13.33 | 14 |
| CO | 4.52 | 14 | 4.80 | 5 | 6.48 | 6 | 15.80 | 10 |
| TA | 2.64 | 16 | 1.83 | 16 | 6.48 | 5 | 10.95 | 16 |
| UB | 2.84 | 15 | 2.19 | 15 | 7.18 | 4 | 12.21 | 15 |
| Coefficient of variation | 0.52 | – | 0.47 | – | 0.33 | – | 0.25 | – |
(): 50-years death estimated from shorter follow-up data, by proper regression models.*
US = US Railroad; EF = East Finland; WF = West Finland; ZU = Zutphen, the Netherlands; CR = Crevalcore, Italy; MO = Montegiorgio, Italy; RR = Rome Railroad, Italy; DA = Dalmatia, Croatia; SL = Slavonia, Croatia; VK = Velika Krsna, Serbia; ZR = Zrenjanin, Serbia; BE = Belgrade, Serbia; KT = Crete, Greece; CO = Corfu, Greece; TA = Tanushimaru, Japan; UB = Ushibuka, Japan.
The outcome of univariate analysis with the individual CVD groups as dependent variables versus the behavior indexes as independent variables, is reported in Table 4 and represented by correlation coefficients forced into a matrix correlation of all variables. Direct and significant levels of the correlation coefficients (R) deal only with Diet Score versus CHD, which is not the case for HDUE and Stroke while it was significant for the overall CVD group where the magnitude of R from CHD is diluted by the not-significant contribution from Rs of HDUE and Stroke. The individual role of physical activity and smoking habits never reached significance. A replication of this correlation matrix restricted to the 10 cohorts with full 50-year data produced rather similar findings, including significance levels, despite the smaller number of statistical units (data not shown).
Table 4. Correlation matrix of determinants and end-points.
| CHD | HDUE | Stroke | CVD | Diet Score | Physical activity Score | Smoking Score | Behavior Score | |
|---|---|---|---|---|---|---|---|---|
| CHD | 1.00 | -0.13 | -0.40 | 0.69 | 0.90 | -0.25 | -0.06 | 0.87 |
| HDUE | 1.00 | 0.57 | 0.53 | -0.11 | 0.28 | 0.47 | -0.11 | |
| STROKE | 1.00 | 0.31 | -0.47 | 0.34 | 0.05 | -0.55 | ||
| CVD | 1.00 | 0.59 | 0.04 | 0.18 | 0.51 | |||
| DIET | 1.00 | 0.22 | 0.07 | 0.95 | ||||
| PHYAC | 1.00 | 0.11 | -0.48 | |||||
| SMOKE | 1.00 | 0.08 | ||||||
| Behavior Score | 1.00 |
Values in bold = p < 0.05.
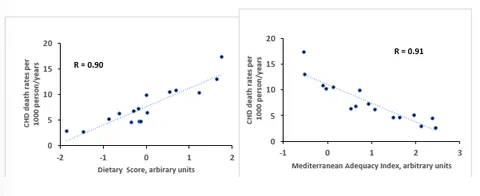
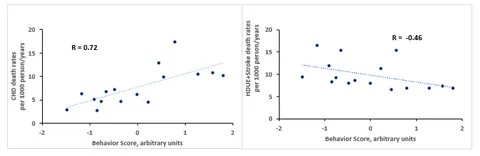
The Behavior Score was directly and significantly related to CHD, while inversely and significantly related with Stroke. The strong association of diet with CHD is depicted in Figure 2. In addition, we displayed a similar graph using another dietary score called Mediterranean Adequacy Index (MAI) created on data derived from a feasibility study of the SCS and based on the ratio of food groups of vegetable origin plus fish on food groups of animal origin plus sugar products, expressed by its natural logarithm [27]. The two graphs are different (although specular) because the “healthy diet” computed by the PCA corresponds to low levels of the Diet Score, so that the relationship with CHD events is direct, while the MAI is a ratio with “favorable food groups” at the numerator on “adverse food groups” at the denominator, so that the relationship with CHD events is inverse. On the other hand, the different relationships of CHD versus the sum of HDUE+Stroke, were associated with positive and negative coefficients respectively versus the Behavior Score and reported in Figure 3.
The multivariate analysis using as predictors three behavior indexes in the same model (Table 5) suggests similar conclusions. The Dietary score is highly associated with CHD and, to a lesser extent, with CVD; physical activity and smoking habits are not so; and the other two end-points have no significant relationships with those indicators of behaviors. The algebraic signs of coefficients for HDUE and Stroke are inverse compared with those for CHD, suggesting a definitely different relationship with the behavior indexes. The adjusted R of the multivariate models showed significance only for CHD and close to significance for CVD.
Table 5. Multiple linear regression models with CHD, HDUE, Stroke and CVD as dependent variables and 3 Behavioral determinants as independent variables.
| Variable | Coefficient | Standard error | Standardized coefficient | P value | Adjusted Model R and (P value) |
|---|---|---|---|---|---|
| CHD | 0.89 (<0.0001) | ||||
| Intercept | 7.6684 | – | – | – | |
| Diet score | 3.6188 | 0.4811 | 0.9061 | <0.0001 | |
| Physical activity score | -0.1420 | 0.4825 | -0.0355 | 0.7736 | |
| Smoking score | -0.4905 | 0.4723 | -0.1228 | 0.3194 | |
| HDUE | 0.32 (0.2270) | ||||
| Intercept | 4.0644 | – | – | – | |
| Diet score | -0.1868 | 0.4805 | -0.0980 | 0.7042 | |
| Physical activity score | 0.3926 | 0.4819 | 0.2059 | 0.4312 | |
| Smoking score | 0.8681 | 0.4716 | 0.4553 | 0.0905 | |
| Stroke | 0.33 (0.2120) | ||||
| Intercept | 5.7112 | – | – | – | |
| Diet score | -0.7742 | 0.4584 | -0.4242 | 0.1170 | |
| Physical activity score | 0.4422 | 0.4598 | 0.2423 | 0.3511 | |
| Smoking score | 0.1081 | 0.4700 | 0.0593 | 0.8141 | |
| CVD | 0.48 (0.0588) | ||||
| Intercept | 17.4440 | – | – | – | |
| Diet score | 2.6578 | 1.0083 | 0.6150 | 0.0214 | |
| Physical activity score | 0.6928 | 1.0083 | 0.1603 | 0.5050 | |
| Smoking score | 0.4857 | 0.9868 | 0.1124 | 0.6315 |
Values in bold = p < 0.05.
Discussion
When starting the analysis, the decision was taken to rely on the Principal Component Analysis (PCA), for the duty to select -through the evaluation of the intervariable correlations- the structure of the 3 individual scores and of the overall behavior score, including the weights of their components with the purpose of minimizing investigator bias and avoiding the conceptual ambiguity historically observed in the handling of the Metabolic Syndrome [28]. However, the three behavior scores were used for analyses aimed at evaluate their independent role, outside their presence into the overall Behavior Score.
The use of three lifestyle behaviors and of their pool, modulated and compacted by the PCA approach, were positively associated with the CHD component of CVD, but inversely with HDUE and Stroke mortality. However, only the Diet score was statistically significant. When pooling together the three CVD mortality components, the outcome was the same but somewhat diluted by the contrasting findings of the separate components. This does not mean that physical activity and smoking habits are not valuable risk factors for CHD, but simply that the variance across the 16 cohorts for these two possible determinants does not explain the variance of CHD.
The SCS ecological correlation of diet with CHD has already been documented following standard approaches [4], while individual correlations were separately published for diet [7,8], smoking habits [5] and physical activity [6]. The value of this analysis partly lays in the extreme follow-up duration that reached the almost extinction of cohorts, yet having these behaviors documented at the time of enrollment into the SCS.
The problem of HDUE and Stroke mortality was a long-term issue of the SCS investigators that started when the decision was taken to disentangle CHD from other heart diseases with which the first ones were frequently pooled and confused. A group of various conditions called Heart Diseases of Uncertain Etiology (HDUE) were identified to include symptomatic heart diseases (usually covered by 50% from idiopathic heart failure), hypertensive heart diseases and cases classified as “chronic” or “other” CHD. They resulted to be a clear counterpart of CHD due to a few important differences. In particular, CHD was strongly predicted by serum cholesterol (but not HDUE); CHD first occurred at an earlier age and age at death was younger (compared with HDUE); Mediterranean Diet was inversely related to CHD (protective) but not to HDUE. In a long series of analyses, it was shown that Stroke had at least in part the same characteristics of HDUE and was frequently pooled with HDUE [29]. In a complex dedicated analysis dealing with 10 extinct cohorts, CHD deaths were challenged versus HDUE and the sum of HDUE+Stroke using the Fine-Gray variant of the Cox proportional hazards model, reaching the conclusion that the algebraic sign of serum cholesterol was positive for CHD and negative for the other conditions, suggesting the existence of competing risks [29] between two groups of largely different morbid conditions. The presence of high levels of HDUE and Stroke (and contemporary lower levels of CHD) are usually associated with higher age at death, that represents a gain in terms of survival [24,25]. Beyond the indications from the competing risk analysis, other approaches were already considered to explain the differences between CHD on one side and HDUE and Stroke on the other. For example we documented that the occurrence of CHD at a younger age, was accompanied by the disappearance of many people with high serum cholesterol (an attrition phenomenon) while the survivors could live longer and be hit by HDUE or Stroke at older ages, also considering the association of these conditions with high blood pressure and smoking habits [33]. Some aspects of this problem were always interpreted with some difficulties since in this study the segregation of thrombotic from hemorrhagic stroke was limited to a small minority of cases. However, what we found in this analysis concerning HDUE and Stroke did not represent substantial new findings.
The levels of the three lifestyle behaviors do not go necessarily in the same good or bad direction within individual cohorts and it is interesting to quote some special cases. The bad basic diet score in East Finland was not necessarily balanced by the high level of physical activity that was not enough to prevent East Finland to be the cohort with the highest rate of CHD. On the other hand, the cohort of Ushibuka in Japan had a good diet score and this benefit was substantially retained (but probably reduced) although this cohort was the one with the highest prevalence of smokers.
This is the first 50-year ecological mapping of major CVD diseases mortality types across 16 globally diverse cohorts using unified lifestyle at baseline. A Diet score was the master variable that sustains its predictive signal of CHD during half a century, surviving the noise of other lifestyle factors and changes. The specific disentanglement of HDUE from CHD showed that these two endpoints have entirely different dietary and lifestyle drivers which is a distinction often lost in modern “total-CVD” studies. Moreover, the study demonstrates the baseline relative “homogeneity” in behaviors like smoking or working physical exercise while high variance in dietary patterns across the 16 cohorts highlights diet as the primary lever for public health policy. Moreover, these findings relied on clinical events adjudicated by a single expert coder over 50 years, ensuring a level of diagnostic consistency.
A limitation of this analysis is bound to the small number of statistical units, that created difficulties in running multivariate analyses and, partly, in the use of mean levels of randomly selected subsamples of the cohorts for the dietary behavior. Another problem deals with the possible changes in eating habits and nutrient contents of food during the long follow-up. Re-analyses run of the available food groups of each cohort after about 30 years of follow-up showed only slight changes that did not affect the ranks of the various nutrients across the cohorts [30,31]. Concurrently, a new dietary survey after 31 years of follow-up in the Italian cohorts of the SCS covered only 37% survivors aged 71 to 90 year, whose contribution to the association with end-points has been shown to interfere in limited way to the multivariate coefficients for diet, and smoking habits of the first 31 years versus those of the entire 60 years follow-up (with only 30% of all CHD events) [32]. Unfortunately, repeated dietary surveys were available for a small number of cohorts and not so complete as the first one. Exploiting the available data we performed a mini “partitioned analysis” (called also “spline”) solving 3 regression equations for different durations of the follow-up with CHD mortality as dependent variable and Behavior Score as independent variable. The strong association of baseline Behavior with CHD during the first 25 years contrasted with the weak association during the second 25 years, showing that the model with the whole 50-year follow-up took into account the different contributions of the partitioned models, whatever could have been the interim changes occurring during the long follow-up and possibly affecting the various effects. Details are reported in Appendix Table 3.
A small selected list of literature contributions on the issue showed a great variability in tackling the problem. Practically all contributions included the role of diet, smoking and physical activity. In addition, several of them introduced alcohol intake as a component independent from the diet [9-12,15-18,20]; many introduced body mass index, obesity or abdominal circumference as behaviors [9,11-13,16-18,20] although these are risk factors that might be only consequences of some bad behavior; in two cases sleeping problems were added [17,20]. Clear behavior scores could be identified in many cases, but most were constructed by simply summing the number of positive habits, thereby assigning equal weight to mathematically and biologically distinct behaviors [7,9-12,17,18,20]. This procedure was even worse when, in some studies, a few single dietary items (like vegetable food, fruit, red meat, etc) were treated as independent behaviors to be added-up [10-12]. In one case [19] a long list of CVD risk factors was added in the estimate.
Almost always the choice of CVD end-points did not take into account the problem to deal with pooling together different types of CVD with likely different etiology. This approach can distort the statistical outcome when, for instance, a disease with high relationship with some determinants was mixed-up with others not related to the same determinants, since the strength of the first one is diluted by the latter. The justification is usually that in view of prevention it is useful to consider and treat all possible risk factors, but in this case the etiological interest is disregarded as well as the opportunity to identify novel, cause-specific risk factors. Conversely, this non-specific classification of CVD remains common even in large-scale meta-analyses [34]. If the “preventive” principle prevails, it could be important to use age at death of extinct cohorts as the only end-point, a situation that de facto takes into account all aspects of life-long health and diseases. Despite the great variability of approaches, all reports claimed to have identified strong associations between all the selected behaviors and CVD mortality. A comprehensive review of almost all the above problems was published in 2013 [35].
Our results have emphasized that when analyzing population-level (ecological) data, researchers must distinguish between different types of CVD death. Grouping cases of uncertain etiology with CHD can dilute the statistical impact, as these conditions have different drivers. Furthermore, we argue that treating individual dietary items such as vegetables, fruit of red-meat as isolated additive behaviors may indeed obscure the synergistic effect of a complete dietary pattern. Unlike studies that summed-up independent food groups [10-12] our approach took advantage of an integrated dietary score based on an a-posteriori approach that better captures the ecological reality and remains free from the personal “opinions” of the investigators.
Considering the unique and heavy relationship of nutrition and CVD (although apparently confined to CHD) it is proper to mention the results of recent studies on the relationship of nutrition versus health although not including the role of other lifestyle behaviors. We refer to the EAT-Lancet Diet [36,37] proposed by an ad-hoc committee that apparently took inspiration from the principles of the original Mediterranean Diet, then adding and/or changing details based on more recent observations and accomplishments, but respecting the beneficial role of vegetables food and the suggested restrictions on most animal foods. Recently the EAT-Lancet score was used in several large observational studies such as the ARIC in the USA [38], the Malmo Diet and Cancer Study in Sweden [39], the US BioBank in Great Britain [40] and a Swiss cohort study [41]. Findings of all these studies suggested large benefits from EAT-Lancet diet versus CVD and all-cause mortality, which is fully in line with the results from the present analysis although derived from largely different structural approaches.
Conclusions
In this 50-year ecological analysis across 16 globally diverse cohorts, during a 50-year exposure, dietary patterns emerged as the dominant, life-long predictor of population-level CHD mortality. Central to these findings was a dietary score identifying a nutritional pattern highly congruent with the Mediterranean diet and modern EAT-Lancet Diet. While smoking and physical activity are established risk factors at individual level, their statistically non-significant association at the cohort level reflects their high baseline homogeneity across these populations. These results reveal divergent drivers for CHD versus non-coronary deaths, suggesting Mediterranean-congruent patterns as the primary lever for preventive policy.