The objective of this paper is to analyze employment and wages in occupational structure of Brazilian labor market, considering the gender gap as well. The analysis is based on information from 1985 to 2015 and estimates from income equations. Results showed that occupational polarization was more evident for women during the three analyzed decades as these women broadened their participation on labor market regarding occupations that were more abstract and manual, non-routine, as professionals and technicians, in the first group, and domestic services, in the second group. On the other hand, men suffered deep transformations in occupational structure regarding manual and routine activities, from agricultural activities to production and operational ones. It was verified a reduction in inequality in wage distribution with the increase of average wages, although occupations that broadened the demand for labor had relative increase in wages, which suggests polarization in women’s payment.
## I. INTRODUCTION
Although income inequali By the beginning of the 2010s, Brazil achieved a remarkable reduction in earnings inequalities in which Gini coefficient fell from 0.50 to 0.41 between the years of 1995 and 2012 (Ferreira et al., 2017).[^1] Although income inequality has increased around the world in most of advanced countries and even in the developing ones, as China and India, it was verified a decline in inequality in countries as Brazil and Colombia (Bourguignon, 2018)[^2]. In Latin America, especially in Brazil, this decrease in inequality is mainly due to changes in labor income (Azevedo et al., 2013, Paiva, 2016).[^3]
Literature shows important changes in the structure of Brazilian labor market. During this period, it was observed an increase in years of school, reduction in returns in education and experience, increase of minimum wage, expansion of formality and reduction in gender and race wage gap (Neri, 2018; Paiva, 2016).
There were also changes in the structure of occupations and reduction in yield spreads among occupations, with higher homogeneity in human capital of individuals, who became more qualified, and falls in cross-sectorial and gender differentials (Martins & Cunha, 2017).
However, evidences suggest that Brazilian economic growth is based on an intense labor intake instead of on a deeper structural change (Maia & Menezes, 2014), in which it is observed a slow process of incorporation of new technologies and automation and a decrease of labor in occupations with high percentage of tasks that can be automated, yet, these vulnerable tasks still represented more than $56.5\%$ of formal employment in the country in 2017 (Kubota; Maciente, 2019).[^4]
This paper contributes to this debate by investigating changes in employment shares and wage distribution on Brazilian labor market during the 1985-2015 period. Moreover, it was examined whether the occupations were gaining importance in determining the labor market dynamics or not. The studied hypothesis is about occupational polarization under technological approach, which establishes increase in demand for more or less qualified work and reduction of those occupations that require average qualification. Lastly, it was also aimed to analyze differences in Brazilian occupational structure according to gender.
Fall in fecundity rate plays an important role to implement woman participation on labor market, however, keeping the familiar model in which woman is responsible for domestic and social roles obliges her to articulate her domestic and professional roles, inhibiting greater economic insertion. In addition, they still face other discriminatory aspects in job offers, as barriers to access leadership positions and lower wages when compared to co-workers (Bruschini & Lombardi, 1996). Among strategies adopted by them to align domestic and work activities is the postponement of maternity, which enables them to dedicate more time to investments in education and career (Cunha et al., 2022).
This paper is structured in six parts, besides introduction. The second part presents a brief review of theoretical and empiric literature about the theme and the following part describes the data and also explains the methodology. The fourth part is about polarization of employment on Brazilian labor market and the fifth discusses the behavior of wage distribution, especially regarding the dynamic of wage differentials among occupations. Lastly, the main evidences are shown on final considerations.
## II. LITERATURE REVIEW
In economics literature, differences in occupational structure have been discussed since Adam Smith on his book An Inquiry Into the Nature and Causes of the Wealth of Nations (in Portuguese A riqueza das nações), published in 1776. According to the author, differences in payment on labor market based on the occupation were due to working conditions, learning costs, stability, reliability degree and success probability; he also addressed the importance of public politics back then and the balance between offer and demand on labor market (SMITH, 1995). Distribution in income would not be arbitrary and defined by an accidental historical process but dependent from distribution of workers in different occupations available in the community while considering specific distributions of skill and prices (ROY, 1951).
On the other hand, increase in inequality of income distribution during past decades, especially in advanced economies, has motivated investigations about changes in the structure of labor market. An explanation for it would be the hypothesis of technological changes and qualified work approach, since technology replaces non-qualified workers but it is complementary to the skilled ones, relatively increasing the demand and returns from these workers (Bound & Johnson, 1992). Also, there would be a polarization on labor market, changing working skills demands and increasing the number of jobs in occupations that require more or less qualification and reducing the ones related to routine tasks (Autor, Levy & Murnane, 2003). Therefore, the job polarization occurs with a decline in the share of routine tasks and growth in abstract and manual tasks (Acemoglu & Autor, 2011; Goos, Manning & Salomons, 2014).
The increase of demand for more qualified workers and higher wages for them (skills return) were observed in the United States and other industrialized countries, despite increase of qualified job offers (Autor, 2014). According to the author, computers are present in many activities and, when a task is not replaced, it can still be completed by them. Thus, Böhm (2020) verified that returns from occupations related to activities considered routine on North American labor market during the years 1990 and 2000 declined when compared to abstract and manual tasks. On the other hand, Cerina, Moro and Rendall (2017) carried out a study about labor market in the United States between 1980 and 2008, observing the gender role in employment changes and highlighting higher polarization in activities occupied by women, who broadened their participation in positions which demanded high and low levels of ability.
In case of Europe, the authors Goos, Manning and Salomons (2014) conducted a research considering labor market in sixteen countries from 1993 to 2010. Results showed persistency in polarization on the analyzed area, suggesting increasing parcels of employment of professionals with higher income and managers as well as those with lower returns who do personal jobs. On the other hand, they also verified decreasing parcels of employment of professionals who work in manufacturing and perform routine tasks at offices. According to Coelli and Borland (2015), the growth in the number of occupations with higher qualification from 1966 to 2011 has contributed to increase inequality of income in Australia, changing both the composition and the average income of occupations.
In Argentina, according to Goméz (2020), it was observed reduction in premium wages depending on educational levels and occupational groups, however, with higher wages from 2004 to 2014. Regarding gender, premiums are still higher for men. Among factors that explain these changes are higher formalization of labor market, minimum wage, collective negotiations and more offers of qualified workers.
In Brazil, during the last decades there were evidences which pointed a decrease in job numbers for occupations that require lower qualification (FLORI, 2007; COMIN, 2015). From the beginning of the 1080s to the beginning of the 2000s, it was observed an elevation in demand for occupations considered non-routine and that require more technological resources, it was also noticed reduction in inequality among occupations but increase of inequality inside jobs identified as belonging to high technology layer (BRESSAN; HERMETO, 2009).
Associated to the increase in more qualified job offers, there were evidences of increase of relative demand for more qualified work during past decades, from 1081 to 2015 (HERDEIRO et al., 2019). However, the biggest parcel of workers is less qualified, underpaid, inserted in service sector and other routine manual occupations with high level of competition and precarious work (MAIA et al., 2019). In this context, incorporation of new technologies can negatively impact employment generation on Brazilian labor market when reaching occupations that are still important for employment composition (KUBOTA; MACIENTE, 2019).
Besides, despite advances, women during the beginning of the 2000s still stood out in manual and little appreciated activities on labor market, as domestic work (MACHADO; OLIVEIRA; WAJNMAN, 2005). Gender inequality and occupational segregation were observed in occupations typically identified as "feminine", as domestic work, office activities, esthetic services, hotel and food services, commerce, health care, education, apparel and decoration sectors, among others (SOARES; OLIVEIRA, 2004). More recently, from 2002 to 2012, it was possible to identify a reduction of the differences between women and men, for example, regarding the tax of vacancy and also the proportion of unpaid jobs being higher among women (KUBRUSLY, 2015).
## III. DATA AND METHODS
Aiming to analyze changes in the structure of occupations on Brazilian labor market, we used the Pesquisa Nacional por Amostra de Domicílios - PNAD (Brazilian National Household Sample Survey) for the period between 1985 and 2015. The PNAD is nationally representative and annual household survey, covering both rural and urban areas, fielded by the Instituto Brasileiro de Geografia e Estatística - IBGE (Brazilian Census Bureau). Seeking to homogenize the databases and allow a comparison over the time studied, we also used hourly earnings in Real ( $R$ ) for workers aged 15 to 64 who participated on the labor force full-time, working at least 36 hours a week. The variables were kept in Real values and were calculated through a deflator based on the Úndice Nacional de Preços no Consumidor - INPC (National Consumer Price Index) fielded by the IBGE, having 2015 as year base.
As in Acemoglu and Autor (2011), we discarded the military sector, but the agricultural workers were kept as they are significantly representative. While in the military case significant changes are not expected over the period studied, the second group was represented a significant portion of jobs at the beginning of the period. To analyze employee qualifications, six educational levels were considered: illiterate or people with less than one year of formal education (ILL), people with incomplete elementary school (LSS), people with complete elementary school but incomplete high school (SSG), people with complete high school (HSG), people with incomplete higher education (LTC) and people with higher education or graduation (CSG).
Regarding the structure of the occupations, eight occupational groups were considered: leaders (MSG), professionals and technicians (PAT), administrative employees (CRC), sales employees (SLS), production employees (PAO), agricultural workers (AGR), domestic workers (HHS) and other service providers (OTS).
Besides the descriptive analyses to identify changes in the employment structure of labor market, in order to discuss income distribution, it was used some inequality measurements as Gini and Theil indexes and income proportion in tenths and cents of income distribution. In addition to, income equations were estimated to explain hourly earning determinants $(Y_{i})$, that can be described as:
$$
Y _ {i} = \alpha + \sum_ {m = 1} ^ {M} \delta_ {m} t _ {m i} + \sum_ {k = 1} ^ {K} \beta_ {k} x _ {k i} + u _ {i}
$$
Among many variables that can explain it are initially the seven occupational groups, then $M = 7$, in which the reference category is domestic employees (HHS). Moreover, empiric literature suggests that there are many relevant elements to explain income inequality besides occupational groups. To Mincer (1974) in his seminal study, income is a function from human resources, especially education and the individual's experience. Subsequently, studies have been incorporating other determinants that also explain income differentials on labor market. Besides education and experience that represent human resources it is possible to find gender as personal characteristic. Among work characteristics that can also result in different income it can be found the sector and the formalization. Lastly, there are the special characteristics, as place of residence in larger areas, urban areas or countryside and metropolitan or nonmetropolitan areas.
## IV. JOB POLARIZATION ON BRAZILIAN LABOR MARKET
Brazilian labor market's composition can be observed on Table 1, in which it can be verified an increase in woman participation at occupation from $30.4\%$ in 1985 to $41.8\%$ in 2015. The increase in women's participation in the labor market can be explained by factors such as reduced fertility, greater availability of technology in domestic equipment and rising wages (Borjas, 2010). The increase in educational level is seen when reducing participation from less qualified individuals with incomplete elementary school and also an increase of other levels, especially for more qualified individuals with at least higher education, which increases from $4.6\%$ to $16.0\%$. The improvements in access to education and changing skill requirements in the labor market were important factors for these results.
Considering employment according to occupational groups, it can be noticed increase on the five starting groups and reduction on the last three. While the starting ones include occupations with more abstract tasks, the latter ones are manual.
Table 1: Labor Market's Composition, 1985-2015
<table><tr><td>Variable</td><td>1985</td><td>1995</td><td>2005</td><td>2015</td><td>1985-2015</td></tr><tr><td>Sex</td><td></td><td></td><td></td><td></td><td></td></tr><tr><td>Males</td><td>69.6</td><td>64.6</td><td>61.2</td><td>58.2</td><td>-16.4</td></tr><tr><td>Females</td><td>30.4</td><td>35.4</td><td>38.8</td><td>41.8</td><td>37.5</td></tr><tr><td>Education</td><td></td><td></td><td></td><td></td><td></td></tr><tr><td>Illiterate or less than 1 year (ILL)</td><td>15.4</td><td>8.4</td><td>4.1</td><td>3.5</td><td>-77.4</td></tr><tr><td>Incomplete elementary School (LTE)</td><td>32.9</td><td>51.6</td><td>34.8</td><td>20.1</td><td>-38.9</td></tr><tr><td>Complete Elementary School (ESG)</td><td>11.2</td><td>17.1</td><td>18.3</td><td>16.7</td><td>49.2</td></tr><tr><td>Complete High School (HSG)</td><td>32.7</td><td>13.7</td><td>27.9</td><td>37.5</td><td>14.8</td></tr><tr><td>Incomplete Higher Education (LTC)</td><td>3.3</td><td>2.9</td><td>6.2</td><td>6.3</td><td>89.6</td></tr><tr><td>Higher Education (CSG)</td><td>4.6</td><td>6.4</td><td>8.6</td><td>16.0</td><td>250.7</td></tr><tr><td>Occupation</td><td></td><td></td><td></td><td></td><td></td></tr><tr><td>Leaders (MNG)</td><td>4.7</td><td>5.4</td><td>4.1</td><td>4.2</td><td>-8.8</td></tr><tr><td>Professionals /Technicians (PAT)</td><td>6.6</td><td>7.7</td><td>14.0</td><td>17.7</td><td>170.5</td></tr><tr><td>Administrative (CRC)</td><td>12.0</td><td>11.1</td><td>13.1</td><td>14.6</td><td>21.4</td></tr><tr><td>Sales (SLS)</td><td>6.8</td><td>8.5</td><td>7.9</td><td>9.1</td><td>32.9</td></tr><tr><td>Production and Operations (PAO)</td><td>5.7</td><td>7.9</td><td>27.6</td><td>26.2</td><td>360.2</td></tr><tr><td>Agricultural (AGR)</td><td>39.0</td><td>36.7</td><td>9.2</td><td>5.6</td><td>-85.6</td></tr><tr><td>Domestic Services (HHS)</td><td>8.7</td><td>10.6</td><td>9.4</td><td>6.5</td><td>-25.0</td></tr><tr><td>Others services (OTS)</td><td>16.6</td><td>11.9</td><td>14.6</td><td>16.1</td><td>-3.3</td></tr></table>
Agricultural workers were the ones that showed deeper fall, from about $40\%$ to $5\%$ during the period, reflecting intense technological change in agricultural sector. On the other hand, production and operational employees showed greater positive variation. Then, it was observed intense replacement in both sectors considered as routine and manual.
Figure 1 considers the composition of qualification groups according to gender and it is noted the same tendency in both sectors - increase of qualification and higher educational levels for women. As example, among women the percentage of individuals with higher education or graduation surpassed $20\%$ in 2005 as among men this same percentage was slightly over $10\%$. In 2005, the highest percentage of individuals had complete high school both for men and women.
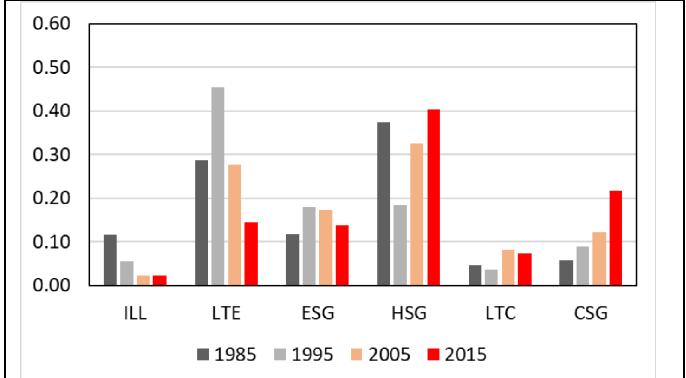
It can also be observed employment composition according to gender and occupational groups in Figure 2. Initially, reduction in employment stood out both form men and women in agricultural occupations. In this segmentation, according to gender, replacement from agricultural activities (AGR) to production and operational ones (PAO) stood out for men and, for women, replacement from professional and technical activities (PAT) and other service activities (OTS), thus abstract and manual activities, respectively.
Therefore, there was an expressive increase in operational occupations among men, similar to reduction of occupations in agricultural activities. Among women, there was relative stability in this operational group. I can also be observed among men and women relative stability in manager, administrative and sales groups, although there was a slight increase for women. On the other hand, there was an increase of professionals and technicians for both genders.
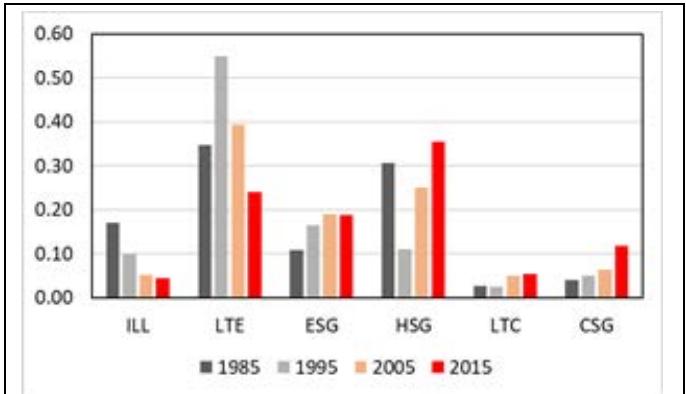
 a) Male b) Female Source:PNADdata. Figure 1: Employment composition by educational levels and gender, Brazil, 1985-2015
Domestic work is one of the most substantial among women as seen in Figure 2b, however, there was a reduction during the period that can be explained by the insertion of women in other areas. The occupation for other services reduced for men and increased for women. In 2005, while men had more occupations for operational activities and service sector, women were working at professional, technical, administrative and service activities.
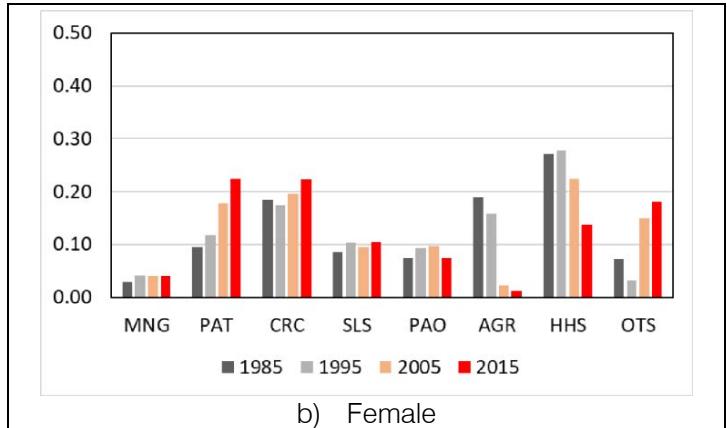 Figure 2: Employment composition by occupation, Brazil, 1985-2015
Source:PNAD data.
Thus, it is possible to say that there was replacement for men in manual and routine activities, especially from agriculture to production and operations. Women, in their turn, suffered reduction from routine and manual activities as agriculture to more abstract activities, as professional and technical ones, and non-routine, as basic services. There results emphasize higher occupational polarization among women then for men, as observed on North American labor market by Cerina, Moro and Rendall (2017).
Hence, parallel to urbanization process and technological changes during past decades in the country, employment replacement from agricultural occupations to urban activities was evident as women were employed at jobs considered more feminine and men were employed at jobs considered more masculine. Wage changes that happened simultaneously to this employment replacement on Brazilian labor market, with more qualified individuals and more participation from women are analyzes on the following section.
## V. CHANGES IN THE WAGES DISTRIBUTION
During the three decades studied, besides employment changes on Brazilian labor market, there were also changes at wage distribution, as seen on Table 2. There was an increase in average wage and reduction of inequality when considered Gini, from 0.567 to 0.416, and Theil, from 0.650 to 0.376, indexes. The biggest positive variation on average wage between 2005 and 2015 can be explained by the adoption of a minimum wage policy valorization in the country, based on inflation from the previous year plus the variation of economy growth from previous years, in addition to increase of formalization, as discussed by Neri (2018) and Paiva (2016). On the other hand, inequality reduction was intense during the final period as well as on the previous one, from 1995 to 2005, due to economic stability from "Plano Real" from 1994. This plan has managed to stabilize prices, which affects more those with lower wages, who have less access to the financial market to protect themselves against inflation, contributing to reduce inequality.
Table 2: Descriptive statistics of hourly wage, 1985-2015 <Table><tr><td>Variable</td><td>1985</td><td>1995</td><td>2005</td><td>2015</td><td>1985-2015</td></tr><tr><td>Mean</td><td>7.243</td><td>7.619</td><td>6.988</td><td>9.734</td><td>34.39</td></tr><tr><td>Gini</td><td>0.567</td><td>0.540</td><td>0.477</td><td>0.416</td><td>-26.63</td></tr><tr><td>Theil</td><td>0.650</td><td>0.587</td><td>0.476</td><td>0.376</td><td>-42.15</td></tr><tr><td>p10</td><td>1.294</td><td>1.680</td><td>2.069</td><td>3.997</td><td>208.89</td></tr><tr><td>p25</td><td>2.301</td><td>2.185</td><td>2.955</td><td>4.667</td><td>102.82</td></tr><tr><td>p50</td><td>3.596</td><td>4.214</td><td>4.231</td><td>6.417</td><td>78.45</td></tr><tr><td>p75</td><td>7.192</td><td>7.867</td><td>6.896</td><td>9.917</td><td>37.89</td></tr><tr><td>p90</td><td>15.534</td><td>15.891</td><td>13.446</td><td>17.500</td><td>12.66</td></tr><tr><td>p95</td><td>25.873</td><td>25.128</td><td>20.687</td><td>26.250</td><td>1.46</td></tr><tr><td>p99</td><td>60.410</td><td>59.872</td><td>51.717</td><td>58.753</td><td>-2.74</td></tr></table>
<table><tr><td>Variable</td><td>1985</td><td>1995</td><td>2005</td><td>2015</td><td>1985-2015</td></tr><tr><td>Mean</td><td>7.243</td><td>7.619</td><td>6.988</td><td>9.734</td><td>34.39</td></tr><tr><td>Gini</td><td>0.567</td><td>0.540</td><td>0.477</td><td>0.416</td><td>-26.63</td></tr><tr><td>Theil</td><td>0.650</td><td>0.587</td><td>0.476</td><td>0.376</td><td>-42.15</td></tr><tr><td>p10</td><td>1.294</td><td>1.680</td><td>2.069</td><td>3.997</td><td>208.89</td></tr><tr><td>p25</td><td>2.301</td><td>2.185</td><td>2.955</td><td>4.667</td><td>102.82</td></tr><tr><td>p50</td><td>3.596</td><td>4.214</td><td>4.231</td><td>6.417</td><td>78.45</td></tr><tr><td>p75</td><td>7.192</td><td>7.867</td><td>6.896</td><td>9.917</td><td>37.89</td></tr><tr><td>p90</td><td>15.534</td><td>15.891</td><td>13.446</td><td>17.500</td><td>12.66</td></tr><tr><td>p95</td><td>25.873</td><td>25.128</td><td>20.687</td><td>26.250</td><td>1.46</td></tr><tr><td>p99</td><td>60.410</td><td>59.872</td><td>51.717</td><td>58.753</td><td>-2.74</td></tr></table>
In the lower tail of the wage distribution, the minimum wage represents the price of less skilled work and an index for other workers. On the other hand, a positive variation in the minimum wage has an effect not only on the lower tail of the wage distribution, but also on the upper tail, since employers can replace less qualified workers with more qualified ones, in addition employers can choose to maintain the wage differential between the more and less qualified, preserving the incentive for the latter (FOGUEL; 1998, NEUMARK; WASCHER, 2008; CUNHA; VASCONCELOS, 2012).
Inequality reduction is the greatest rate at Theil, which is more susceptible to changes on the upper tail of the distribution. This is in line with the negative variation on the last percentile analyzed and, on the other hand, major positive variations were on those elements with lower wages. Therefore, the highest wages reduced or increased less and the lowest wages approached the highest, reducing inequality. These changes were also identified through appropriate proportion on percentiles of wage distribution, where lower wages showed positive variation and the last, a negative variation. Nevertheless, differences were still substantial. This reduction in inequality on wage distribution can be also observed through lower wage differentials estimated through Mincerian equation, as on Table 3, in which controls related to individuals', workplace and spatial characteristics were considered as well as variables associated to occupational groups.
Table 3: Wage differentials according to hourly wage, Brazil, 1985-2015
<table><tr><td>Variable</td><td>1985</td><td>1995</td><td>2005</td><td>2015</td></tr><tr><td>Managers</td><td>1.4605***</td><td>0.8136***</td><td>0.8001***</td><td>0.6651***</td></tr><tr><td>Professionals/Technicians</td><td>1.1803***</td><td>0.5527***</td><td>0.5612***</td><td>0.4573***</td></tr><tr><td>Administrative</td><td>1.0361***</td><td>0.3875***</td><td>0.3002***</td><td>0.1588***</td></tr><tr><td>Sales</td><td>0.7228***</td><td>0.2677***</td><td>0.2017***</td><td>0.0779***</td></tr><tr><td>Production and Operations</td><td>0.5582***</td><td>0.1838***</td><td>0.2500***</td><td>0.1701***</td></tr><tr><td>Agricultural</td><td>0.6362***</td><td>0.2025***</td><td>0.1309***</td><td>-0.0056</td></tr><tr><td>Others services</td><td>0.6918***</td><td>0.1919***</td><td>0.1314***</td><td>0.0528***</td></tr><tr><td>Sex</td><td>0.3354***</td><td>0.3491***</td><td>0.2603***</td><td>0.2335***</td></tr><tr><td>Age</td><td>0.0931***</td><td>0.0653***</td><td>0.0522***</td><td>0.0318***</td></tr><tr><td>Age2</td><td>-0.0010***</td><td>-0.0007***</td><td>-0.0005***</td><td>-0.0003***</td></tr><tr><td>Educational level</td><td></td><td></td><td></td><td></td></tr><tr><td>LSS</td><td>0.1827***</td><td>0.1633***</td><td>0.1496***</td><td>0.0881***</td></tr><tr><td>SSG</td><td>0.4423***</td><td>0.3713***</td><td>0.3085***</td><td>0.1945***</td></tr><tr><td>SMC</td><td>0.4523***</td><td>0.6516***</td><td>0.4621***</td><td>0.2901***</td></tr><tr><td>CLG</td><td>0.9916***</td><td>0.9612***</td><td>0.7692***</td><td>0.4651***</td></tr><tr><td>GTC</td><td>1.4462***</td><td>1.4670***</td><td>1.2409***</td><td>0.9067***</td></tr><tr><td>Formal</td><td>0.3380***</td><td>0.2415***</td><td>0.3186***</td><td>0.2335***</td></tr><tr><td>Sectors</td><td></td><td></td><td></td><td></td></tr><tr><td>Industrial</td><td>0.3084***</td><td>0.3987***</td><td>0.1371***</td><td>0.0511**</td></tr><tr><td>Sales and services</td><td>0.1535***</td><td>0.2425***</td><td>0.0845***</td><td>0.0088*</td></tr><tr><td>Urban</td><td>0.1133***</td><td>0.1235***</td><td>0.0499***</td><td>0.0760***</td></tr><tr><td>Metropolitan</td><td>0.1893***</td><td>0.1725***</td><td>0.1282***</td><td>0.0907***</td></tr><tr><td>Region</td><td></td><td></td><td></td><td></td></tr><tr><td>Northeast</td><td>-0.3351***</td><td>-0.2251***</td><td>-0.2457***</td><td>-0.1569***</td></tr><tr><td>Southeast</td><td>-0.0957***</td><td>0.1968***</td><td>0.0820***</td><td>0.1095***</td></tr><tr><td>South</td><td>-0.0980***</td><td>0.1602***</td><td>0.0979***</td><td>0.1659***</td></tr><tr><td>Central West</td><td>-0.0501***</td><td>0.0841***</td><td>0.1038***</td><td>0.1693***</td></tr><tr><td>Constant</td><td>-2.0574***</td><td>-1.2632***</td><td>-0.8021***</td><td>0.1905***</td></tr><tr><td>Observations</td><td>111.687</td><td>65.219</td><td>91.750</td><td>83.832</td></tr><tr><td>R2</td><td>0.5945</td><td>0.5559</td><td>0.4994</td><td>0.4586</td></tr></table>
Every occupational group had their estimated differential reduced when compared to the ones from individuals placed on domestic activities, which is the reference category. Greater differentials for those in managerial, professional, and technical activities were maintained, but on other occupational groups there was a lower differential when compared to the category of reference. From 1985 to 1095, there was a reduction in every wage differential, although it was more intense on occupations with lower wages.
During the second period, from 1995 to 2005, there was a relative maintenance of higher differentials and even an increase on differentials from professional and technician occupations, that are non-routine and abstract. There was also an increase on differentials from production and operational occupations, that are considered routine and manuals. Lastly, from 2005 to 2015, there was a reduction on every occupational differential and agricultural workers had negative differential when compared to workers on domestic service.
Thus, from 1985 to 2015, there was a smaller reduction on wage differential from occupations with bigger premiums, for example, managers had a reduction of $-54.5\%$ while other services had $-94.4\%$.
Regarding other estimated differentials and controls included on regression, there was also a reduction. Gender differentials increased from 1985 to 1995, but reduced during other periods; experience or age differentials fell during the whole period. Higher educational levels had better wages, but these differentials were smaller when compared to the reference category during the years, especially from 2005 to 2015. This reduction is smaller during the first period, from 1985 to 2015, in which it is possible to notice wage valorization for individuals with high school or higher education, under graduation or graduation.
When talking about characteristics of the workplace, individuals with formal job attachment had better wages when those differentials were reduced both for the first and second period. The sector with better wages is industry, but by the end of the period the intersectoral differentials were low. For spatial characteristics, those living in urban and metropolitan areas had better wages and the ones living in the Northeast had it lower.
To analyze the behavior of wage differentials between occupations for men and women, wage equations were estimated for each element, as in Figure 3. Initially, there was deeper fall on differentials from 1985 to 1995 then on other periods. Differentials for the first two groups, Managers and Professionals and Technicians, were more similar for men then for women in 1995, but they got closer to women by the end of the period. On the other hand, for the groups Administrative and Sales employees, premiums were closer to men in 1985 than to women, but they were also reduced for both genders during the studied period. However, there was an amplification of differentials for these two categories with higher wages, it is, the two first groups.
Lastly, for the three remaining occupations, it is possible to observe a relative change on wage differentials both for men and women. In 1985, the differentials for Production and Operation (PAO), Agriculture (AGR) and Other Services (OTS) grew. However, in 2015, Production and Operation (PAO) had greater differentials, especially for men.
In case of men, the behavior of differentials for the ones employed on Production and Operation (PAO) stood out, with a smaller fall then for the other occupations from 1985 to 2015; the ones working at agriculture had sharper reduction during the same period. Hence, employment replacement from agricultural activities to production and operation, as observed on the previous section, was followed by a relative wage increase for these urban occupations.
As for women, despite the tendency of fall for wage differentials, some facts stood out. Managerial occupation (MHG) and Professionals and Technicians (PAT) had better wages that were becoming more distant from the income of other occupations in 2015. Thus, amplification of jobs for women in these occupations as observed on the previous section, was followed by a relative amplification of wage differentials when compared to other occupations. In sequence, there were the wages of women who worked at administrative jogs and other occupations with smaller differential when related to occupations with average wages. Thus, in case of women, the entrance to the labor market with more abstract or manual occupations was followed by better relative wages on the upper and lower tail when compared to occupations with average wage.
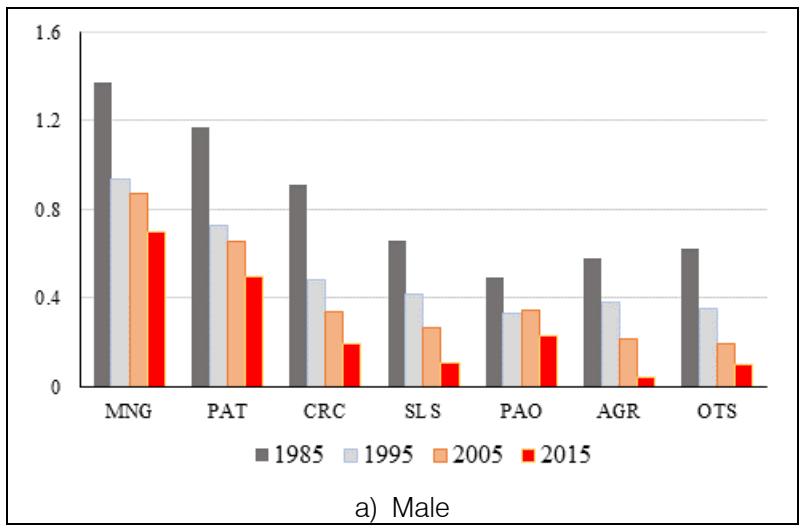
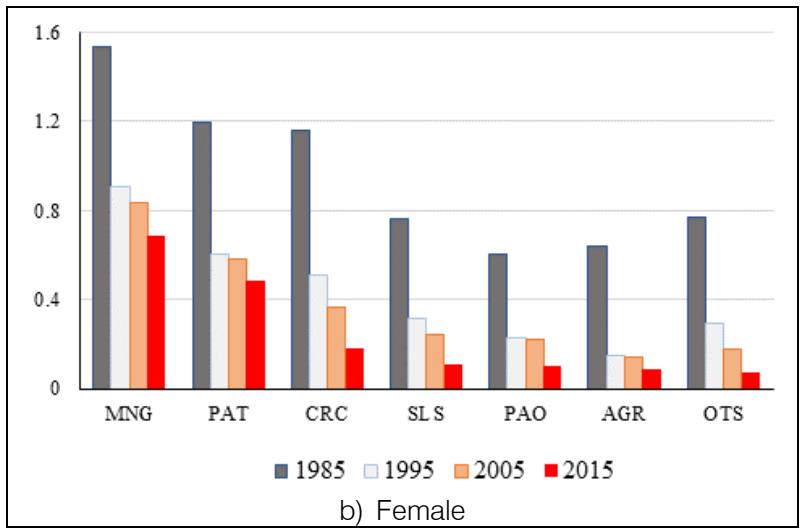 Figure 3: Wage differentials by occupations groups, Brazil, 1985-2015
Source:PNAD data.
From 1985 to 2015, the incorporation of new technologies and the increase of qualification levels to Brazilian labor market contributed to reduce income inequality, different from what has been happening in more developed countries as shown by Goldin and Katz (2009), Autor (2014) and Coelli and Borland (2015).
During the studied period it was observed an increase in average wages associated to reduction of inequality, especially among the occupations. Evidences suggest that employment polarization in more abstract and manual activities is more evident among women and it was followed by changes on more favorable wages on these categories. For men, employment replacement was more substantial from agricultural activities to production and operation, in other words, in occupational groups with routine and manual activities. For that matter, the demand for workers on occupations with less or more qualification was more evident for women than for men.
## VI. CONCLUSIONS
This paper aimed to analyze modifications on occupational structure of Brazilian labor market, trying to verify the hypothesis of occupational polarization and its effects educational level for workers, what is aligned to the amplification of demand for more qualified work. The evidence points to substantial changes in employment between occupational groups, and a reduction in inequality in wage distribution.
Among men, the change of jobs from agricultural activities to production and operation, which are routine and manual activities, is more substantial. On the other hand, women increased their participation in the labor market, especially in professional, technical, sales and basic services occupations. The results suggest that while men were allocated to more typically male occupations, such as production and operations, women were allocated to more typically female occupations, such as services, professionals, and technicians. Thus, it is possible to say that occupational polarization on Brazilian labor market is more evident among women then among men.
During the analyzed decades, wage inequality on Brazilian labor market and among occupations was reduced, especially among women. The results indicate a reduction in gender wage differentials, which contributes to the reduction of inequality in wage distribution and better social well-being. However, despite the reduction, there was still a substantial wage differential among genders.
Thus, it was verified that the incorporation of new technologies and the increase of qualification on Brazilian labor market contributed to reduce wage inequality during the studied period. The evidences shown that there is a complementary between technology and skilled work. Also, during the past decades, the structure of Brazilian labor market has been relevantly modified as a consequence of the technological advancement.
In this context, it is understood that there is polarization on labor market when there are occupations with rising demand, especially occupations that perform tasks considered manual and abstract, in other words, tasks that cannot be perfectly replaced by technology. On the other hand, there are occupations with reduced demand, mainly tasks considered routine, as agriculture. These changes affected men more intensely, who had greater relative participation on labor market; on their turn, women engaged on occupations with more abstract and manual tasks, both non routine.
This way, for planning and public policies management, it is relevant to know the demand profile for particular positions. Through this information it is possible to create policies in order to stimulate and encourage formation of human capital able to attend the demands, such as public early childhood care, such as daycare and preschool, and improved urban mobility.
[^1]: In the study was used data from the Pesquisa Nacional por Amostra de Domicílios (PNAD) fielded by the Brazilian Census Bureau (Instituto Brasileiro de Geografia e Estatística, IBGE). _(p.1)_
[^2]: Bourguignon (2018) analyzed information from 1985 to 2012, using World Bank data. _(p.1)_
[^3]: The Gini Index for total household income per capita, in Brazil, was 0.59 in 1995 and 0.54 in 2010. But the Gini index for earnings was 0.58 and 0.52, respectively. _(p.1)_
[^4]: $^{4}$ Kubota & Maciente (2019) used information from the Occupational Information Network (O*NET), developed under the sponsorship of the United States Department of Labor, and the Annual Information Report (Rais), from the Ministry of Economy (ME), with data only on formal employment. _(p.1)_
[^5]: According to information from Demographic census from 1970, 1980, 1991, 2000 and 2010, urbanization rate in the country was, respectively, $55.9\%$, $67.6\%$, $75.6\%$, $81.2\%$ and $84.4\%$. _(p.6)_
Generating HTML Viewer...
References
35 Cites in Article
D Autor (2014). Polanyi's paradox and the shape of employment growth.
D Autor,F Levy,R Murnane (2003). The Skill Content of Recent Technological Change: An Empirical Exploration.
J Azevedo,M Dávalos,C Diaz-Bonilla,B Atuesta,R Castañeda (2013). Fifteen Years of Inequality in Latin America: How Have Labor Markets Helped? World Bank.
Michael Böhm (2020). The price of polarization: Estimating task prices under routine‐biased technical change.
G Borjas (2010). Labor economics.
François Bourguignon (2018). World Changes in Inequality: an Overview of Facts, Causes, Consequences, and Policies1.
G Bressan,A Hermeto (2009). Polarização do mercado de trabalho sob viés tecnológico e impactos sobre diferenciais salariais por gênero.
C Bruschini,M Lombardi (1996). O trabalho da mulher brasileira nos primeiros anos da década de noventa. Anais.
F Cerina,A Moro,M Rendall (2017). The role of gender in employment polarization.
A Comin (2015). Desenvolvimento econômico e desigualdades no Brasil: 1960-2010.
M Cunha,A Rosa,M Vasconcelos (2022). Evidências e fatores associados ao fenômeno de adiamento da maternidade no Brasil.
M Cunha,M Vasconcelos (2012). Evolução da desigualdade na distribuição dos salários no Brasil.
F Ferreira,S Firpo,J Messina (2017). Ageing Poorly? Accounting for the decline in earnings inequality in Brazil, 1995-2012.
M Foguel (1998). Uma avaliação dos efeitos do salário mínimo sobre o mercado de trabalho no Brasil.
P Flori (2007). Perspectivas e experiências docentes na FEA-USP.
Claudia Goldin,Lawrence Katz (1890). The Race between Education and Technology: The Evolution of U.S. Educational Wage Differentials, 1890 to 2005.
María Gómez (2020). Desigualdad salarial en Argentina. Una interpretación con base en calificaciones ocupacionales.
Explore published articles in an immersive Augmented Reality environment. Our platform converts research papers into interactive 3D books, allowing readers to view and interact with content using AR and VR compatible devices.
Your published article is automatically converted into a realistic 3D book. Flip through pages and read research papers in a more engaging and interactive format.
The objective of this paper is to analyze employment and wages in occupational structure of Brazilian labor market, considering the gender gap as well. The analysis is based on information from 1985 to 2015 and estimates from income equations. Results showed that occupational polarization was more evident for women during the three analyzed decades as these women broadened their participation on labor market regarding occupations that were more abstract and manual, non-routine, as professionals and technicians, in the first group, and domestic services, in the second group. On the other hand, men suffered deep transformations in occupational structure regarding manual and routine activities, from agricultural activities to production and operational ones. It was verified a reduction in inequality in wage distribution with the increase of average wages, although occupations that broadened the demand for labor had relative increase in wages, which suggests polarization in women’s payment.
Our website is actively being updated, and changes may occur frequently. Please clear your browser cache if needed. For feedback or error reporting, please email [email protected]
Thank you for connecting with us. We will respond to you shortly.