I. INTRODUCTION
The definition of "productivity" from a manufacturing perspective can be basically stated as "the ratio of output to input in production" and it is a measure of efficiency which makes both terms distinct. For productivity enhancement, first, we need to measure and analyse the existing processes. In the manufacturing industry, different techniques are undertaken to measure and analyse the productivity of processes undergoing to manufacture a product. Micro motion study of the elements of various operations is one of these techniques.
The operations or activities which are of short duration and are highly repetitive are analysed with the help of micro-motion study. These are the operations or motions which require very small time which makes it very difficult to measure time for these motions accurately and the time required by these motions is needed to be analysed thoroughly due to their repetitive nature. "Thus micro motion study can be defined as the technique of recording and analysing the timing of basic elements of an operation and time involved in doing these operations with the objective of achieving the best method of performing the operation and removing any non-value added activity from the operation." Micromotion study as a whole involves the following three simple steps:- i. Filming the operation under analysis. ii. Gathering of the data from the films. iii. Making a recording of the data using a SIMO chart.
"SIMO" stands for simultaneous-Motion Cycle chart. It is a micro-motion study recording technique devised by Gilbreth and it presents graphically the separable elements of each limb of the operator under study along with the time taken to perform these activities. It is an extremely detailed left and right-hand operation chart which uses various therbligs to define each activity with certain symbols and legends. It records simultaneously the different therbligs performed by different parts of the body of one or more operators on a common time scale. The movements involved in any operation are recorded against time measured in "Winks" (1 wink= 1/2000th of a minute). SIMO Study is done in order to carry out a critical analysis of elements in an operation to explore the possibility of the following-
- Removing any type of non-necessary and non-value added activity out of the sequence of steps in an operation.
- Resequencing of the elements in an operation to decrease cycle times of an operation.
For the standardization of the steps or elements and to determine the time standards we can further improve the processes by performing a technique called pre-determined motion time system (PMTS). A predetermined motion time system may be defined as a procedure/method which can be used to analyse any manual activity/human motion in terms of the basic or fundamental motions required to perform it. Each of these activities is assigned a predetermined or a previously established standard time value in such a manner that on the addition of these time values provides a total time for the performance of an activity.
Time measurement unit (TMU), defined as 0.00001 hours, or 0.036 seconds, is used as the basis for the time values of these activities in many cases. Measuring work in TMUs, allows the measurer to make very accurate calculations without lengthy decimals. This technique is especially helpful in high-volume production environments. There are different predetermined motion time systems developed after their introduction in the 1920s.
Some of the Motion time analysis techniques along with their time of origin and developers-
| PMTS | Developer | Time | Speed |
| MTA | Frank Bunker Gilbreth and Lilian Gilbreth | 1924 | |
| MTM-1 | Maynard, Stegemerten and Schawb | 1948 | |
| MTM-2 | International MTM Directorate | 1965 | 3-4X |
| MTM-3 | International MTM Directorate | 1970 | 7X |
| MTM-V | Swedish MTM Association | 23X | |
| MTM-C | International MTM Directorate | 1978 | |
| MTM-M | International MTM Directorate | ||
| MOST | Zandin (1980), originally applied in Saab-Scania in Sweden in 1967 | 1980 | |
| MODAPTS | Chris Heyde | 1983 |
Maynard operation sequence technique (MOST) is a predetermined motion time systems technique that concentrates on the movement of objects. The repetition of the movements can be variable and is used to define the MOST family to be used for analysis. Repetition of movements can be based on certain accuracy and confidence level on the basis of which the number of repetitions under consideration can change. It is used to analyse work and to set the time standards that it would take to perform a particular process/operation. MOST is a powerful analytical tool to measure and analyse all the time spent on a task. It makes the analysis of work an approachable, practical, manageable and cost-effective task. MOST analysis is a complete study of an operation or sub-operation typically consisting of several method steps and a corresponding sequence model. It is comprised of work study, method study, and work measurement tools. In the organization under study, the excess time in operator's activity and fatigue of a worker.
In the BasicMOST we need three activity sequences for describing manual work, and a fourth is used for measuring the movements of objects with manual cranes.
- The General Move Sequence Model is used for the analysis of the spatial movement of an object freely through the air.
The sequence model is a series of letters or parameters that are used for representing the various sub-activities of General Move.
The General Move Sequence Model with the definitions for each parameter is as follows:
ABGABPA
Where:
A = Action Distance
B = Body Motion
G = Gain Control
P = Placement
- The Controlled Move Sequence Model is used for the analysis of the movement of an object when it remains in contact with a surface or is attached to another object during the movement (e.g., the movement of the object is controlled by some constraints).
The sequence model is a series of letters or parameters representing the various sub-activities of Controlled Move and is listed below:
ABGMXIA
Where:
A = Action Distance
B = Body Motion
G = Gain Control
M = Move Controlled
X = Process Time
I = Alignment
- The Tool Use Sequence Model is used for the analysis of movements while using common hand tools.
- The Manual Crane Sequence Model is used for the analysis of the movement of objects using a manually traversed crane.
a) MOST System Families
i. Maxi MOST (Higher level)
Used to analyse the operations that are likely to be performed fewer than 150 times a week at an overall accuracy requirement of with a confidence level. An operation that ranges from more than 2 minutes to several hours falls in this category.
ii. Basic MOST (Intermediate level)
Used to analyse the operations that are likely to be performed more than 150 times but less than 1500 times a week at an accuracy requirement of with a confidence level. An operation that ranges from a few seconds to 10 minutes falls in this category.
iii. Mini MOST (Lower level)
Used to analyse the operations that are repeated more than 1500 times a week with an accuracy of with a confidence level. An operation that lasts less than a few seconds falls in this category.
b) System Family Selection Flowchart
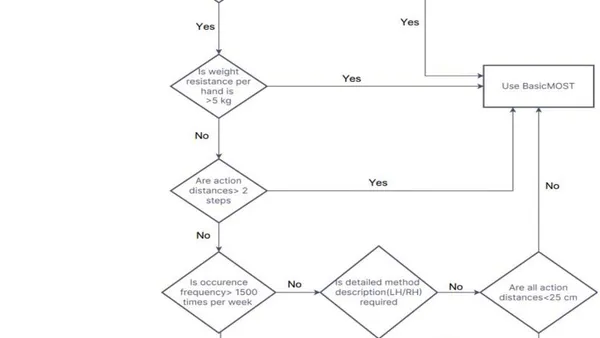
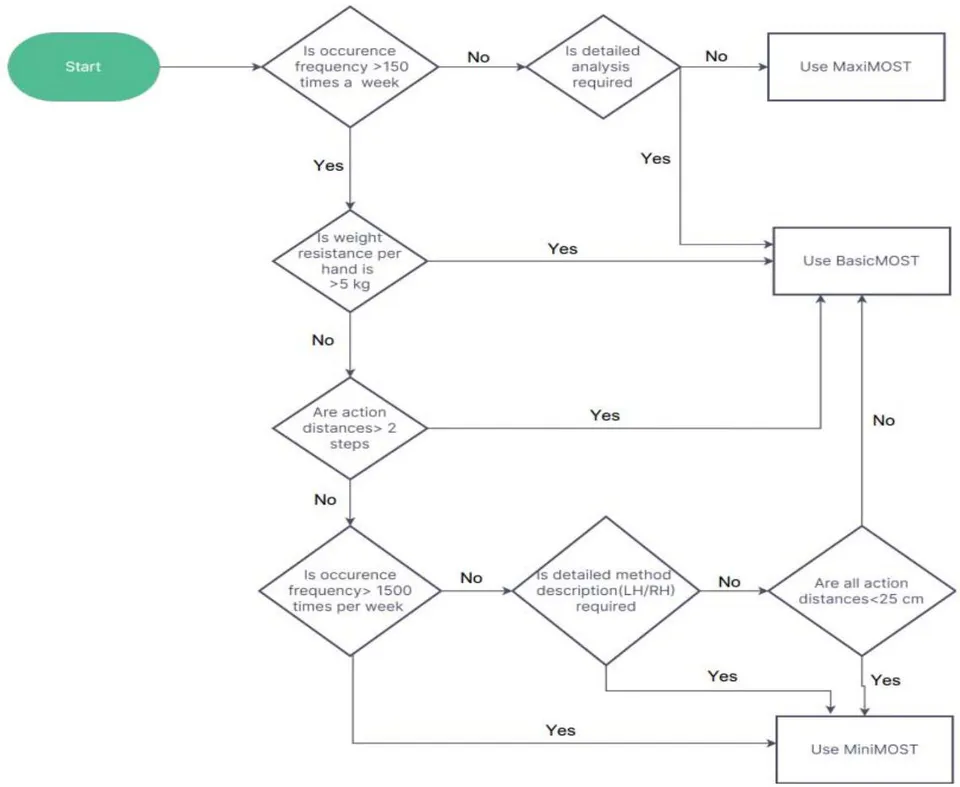
In order to make decision of MOST family to be selected for the analysis of the operation, we need to undergo a quantitative and qualitative analysis of the operation. Below (Fig. 1) is a flowchart prepared to undergo the analysis involved of the operation involved in the MOST study.
Procedure for MOST Analysis:
Determine job/task and film the operation.
Perform a detailed analysis of the operation.
Determine sequence(s) to use.
Provide index values to each activity. The common scale of index numbers used in all MOST sequence models is 0, 1, 3, 6, 10, 16, 24, 32, 42 and 54.
Add index values to determine TMU.
Multiply TMU by 0.036. Converting TMU to seconds.
II. METHODOLOGY TO BE USED IN THE STUDY
a) Micro Motion Study
Determine the working perimeter, including the cycle, start and end points of the job.
Observation and videography of the operation under study.
Critical analysis and breakdown of elements of the job/operation.
Assigning therbligs to the elements of the operation and segregating them into effective and ineffective therbligs on a SIMO chart.
Analysis of therbligs to eliminate non-necessary, non-value-added activities from the operation and resequencing of the elements to decrease cycle times on a revised SIMO chart.
Calculating observed time and change or reduction of time after study.
Application of changes to the actual operation.
b) Maynard Operation Sequence Technique (MOST) 1. Determine the working perimeter, including the cycle, start and end points of the job.
Observation and videography of the operation under study.
Determine the sequence of the operation under study.
Determine the type and family to be used in the analysis of the operation with the help of system family selection flowchart.
Determination of the type of activity, sequence model and parameter to govern a certain activity.
Determination of the general move sequence and index values of the activities of the operations.
Calculate normal time in TMU and conversion of TMU to seconds.
III. CASE STUDY
a) Micro Motion Study
Operation name, cycle, end and start points of the operations
Operation: - Grip insertion on the handle
Parts:- Handle sub-assembly, Grip
Operation start:- Handle sub-assembly in the bin, handle grip in the bin
Operation ends:-- Handle sub-assembly with grip inserted on conveyor
Operator: - Mr. Nikhil
Charsted by: - Mr. Nitish kr & Mr. Aditya
Dated:-25-06-22
Analysis and breakdown of the job into elements
Detailed observation of the video generated can give us an idea of various activities being performed. These activities can then be assigned respective therbligs. The activity differentiation, in this case, needs to be very detailed as it is the basis of the SIMO chart to be prepared.
| Serial no. | Left hand description | Therblig | Type | Time(in winks) | No. of frames in videography | Time (in seconds) | Time (in seconds)2 | No. of frames in videography2 | Time(in winks)2 | Type2 | Therblig2 | Right hand description |
| Selecting the handle sub assembly in the bin | Idle | |||||||||||
| Idle | Selecting the handle grip from bin | |||||||||||
| Reaching to grasp | Reaching to grasp | |||||||||||
| Grasping the handle sub assembly | Grasping the handle grip | |||||||||||
| Moving the part to position | Moving the grip to position | |||||||||||
| Placing the part in position for further operations | Aligning it according to the position of handle grip | |||||||||||
| Holding the parts in position | Positioning it on the top of handle | |||||||||||
| Releasing the handle sub assembly | Pushing it towards the handle | |||||||||||
| Reaching to grasp the grip | Holding the grip | |||||||||||
| Grasping the grip | Holding the grip | |||||||||||
| Forcing the grip on handle | Forcing the grip on the handle | |||||||||||
| Holding the grip | Releasing the grip | |||||||||||
| Positioning it for checking | Reaching to grasp the handle | |||||||||||
| Holding in position for checking it to be aligned | Grasping the handle | |||||||||||
| Aligning the grip in the position | Holding for aligning | |||||||||||
| Holding the grip | Releasing the grip | |||||||||||
| Positioning it for inspection | Rest | |||||||||||
| Checking and inspection | Rest | |||||||||||
| Moving the part to conveyer | Idle | |||||||||||
| Placing the assembly with grip on the conveyer | Idle |
Below is a SIMO chart developed by assigning therbligs to various activities with time analysis and conversion in winks and seconds by analysing the frames/second of the videos. These activities are termed as being effective or ineffective based on the direct value being added to the product.
| SIMO Chart(Simultaneous Motion chart)(INITIAL) | |||||||||||
| Operation:- Grip insertion on handle Parts:- Handle sub assembly, Grip Operation start:- Handle sub assembly in bin, handle grip in bin Operation ends:- Handle sub assembly with grip inserted on conveyor Operator:- Chartered by:- Dated:- | Conversion Table 1 wink=1/2000th of a minute=60/2000 of a second Video recorded at frames/second=30 frames per second lframe=1.111winks | ||||||||||
| Serial no. | Left hand description | Theiblig | Type | Time(in winks) | No. of frames in videography | Time (in seconds) | Time (in seconds)2 | No. of frames in videography2 | Time(in winks) | Theiblig | Right hand description |
| 1 | Selecting the handle sub assembly in the bin | S | Ineffective | 4.444 | 4 | 0.13332 | 0.13332 | 4 | 4.444 | Ineffective | UD |
| 2 | Idle | UD | Ineffective | 4.444 | 4 | 0.13332 | 0.13332 | 4 | 4.444 | Ineffective | S |
| 3 | Reaching to grasp | TE | Effective | 22.22 | 20 | 0.6666 | 0.6666 | 20 | 22.22 | Effective | TE |
| 4 | Grasping the handle sub assembly | G | Effective | 4.444 | 4 | 0.13332 | 0.13332 | 4 | 4.444 | Effective | G |
| 5 | Moving the part to position | TL | Effective | 18.887 | 17 | 0.56661 | 0.56661 | 17 | 18.887 | Effective | TL |
| 6 | Placing the part in position for further operations | P | Ineffective | 33.33 | 30 | 0.9999 | 1.49985 | 45 | 49.995 | Effective | PP |
| 7 | Holding the parts in position | H | Ineffective | 77.77 | 70 | 2.3331 | 1.9998 | 60 | 66.66 | Ineffective | P |
| 8 | Releasing the handle sub assembly | RL | Effective | 2.222 | 2 | 0.06666 | 0.26664 | 8 | 8.888 | Effective | A |
| 9 | Reaching to grasp the grip | TE | Effective | 15.554 | 14 | 0.46662 | 0.29997 | 9 | 9.999 | Ineffective | H |
| 10 | Grasping the grip | G | Effective | 2.222 | 2 | 0.06666 | 0.06666 | 2 | 2.222 | Ineffective | H |
| 11 | Forcing the grip on handle | A | Effective | 75.548 | 68 | 2.26644 | 2.26644 | 68 | 75.548 | Effective | A |
| 12 | Holding the grip | H | Ineffective | 2.222 | 2 | 0.06666 | 0.06666 | 2 | 2.222 | Effective | RL |
| 13 | Positioning it for checking | P | Ineffective | 8.888 | 8 | 0.26664 | 0.26664 | 8 | 8.888 | Ineffective | Ud |
| 14 | Holding in position for checking it to be aligned | H | Ineffective | 8.888 | 8 | 0.26664 | 0.26664 | 8 | 8.888 | Ineffective | I |
| 15 | Aligning the grip in the position | A | Effective | 33.33 | 30 | 0.9999 | 0.9999 | 30 | 33.33 | Ineffective | H |
| 16 | Holding the grip | H | Ineffective | 5.555 | 5 | 0.16665 | 0.16665 | 5 | 5.555 | Effective | RL |
| 17 | Positioning it for inspection | P | Ineffective | 7.777 | 7 | 0.23331 | 0.23331 | 7 | 7.777 | Ineffective | R |
| 18 | Checking and inspection | I | Ineffective | 33.33 | 30 | 0.9999 | 0.9999 | 30 | 33.33 | Ineffective | R |
| 19 | Moving the part to convey | TL | Effective | 55.55 | 50 | 1.6665 | 1.6665 | 50 | 55.55 | Ineffective | UD |
| 20 | Placing the assembly with grip on the conveyor | RL | Effective | 11.11 | 10 | 0.3333 | 0.3333 | 10 | 11.11 | Ineffective | UD |
| TOTAL TIME (INITIAL) | 12.83205 | 13.03203 | |||||||||
Below is a revised SIMO chart made by analysing effective and ineffective therbligs to eliminate non-necessary and non-value added activities from the operation. Differentiating these activities is a crucial process as this step adds value to the study being performed. There may be some ineffective activities that assist other effective activities, so we need to consider them accordingly. Recessing of the various activities can also be performed in this step so that the total cycle time can be decreased.
| SIMO Chart(Simultaneous Motion chart)(REVISED) | |||||||||||
| Operation: Grip insertion on handle Parts: Handle sub assembly, Grip Operation start: Handle sub assembly in bin, handle grip in bin Operation ends: Handle sub assembly with grip inserted on conveyor Operator: Charted by: Dated:- | Conversion Table 1 wink=1/2000th of a minute=60/2000 of a second Video recorded at frames/second=30 frames per second lframe=1.111winks | ||||||||||
| Serial no Left hand description Thehigs Type videography seconds)2 videography3 winks)2 Type2 Thehigs2 Right hand description | |||||||||||
| 1 | Selecting the handle sub assy in the bin | S | Ineffective | 4.444 | 4 | 0.13332 | 0.13332 | 4 | 4.444 | Ineffective | UD Idle |
| 2 | Idle | UD | Ineffective | 4.444 | 4 | 0.13332 | 0.13332 | 4 | 4.444 | Ineffective | S Selecting the handle grip from bin |
| 3 | Reaching to grasp | TE | Effective | 22.22 | 20 | 0.6666 | 0.6666 | 20 | 22.22 | Effective | TE Reaching to grasp |
| 4 | Grasping the handle sub assy | G | Effective | 4.444 | 4 | 0.13332 | 0.13332 | 4 | 4.444 | Effective | G Grasping the handle grip |
| 5 | Moving the part to position | TL | Effective | 18.887 | 17 | 0.56661 | 0.56661 | 17 | 18.887 | Effective | TL Moving the grip to position |
| 6 | Placing the part in position for further operations | P | Ineffective | 33.33 | 30 | 0.9999 | 1.49985 | 45 | 49.995 | Effective | PF Aligning it according to the position of handle grip |
| 7 | Holding the parts in position | H | Ineffective | 77.77 | 70 | 2.3331 | 1.9998 | 60 | 66.66 | Ineffective | P Positioning it on the top of handle |
| 8 | Releasing the handle sub assy | RL | Effective | 2.222 | 2 | 0.06666 | 0.26664 | 8 | 8.888 | Effective | A Pushing it towards the handle |
| 9 | Reaching to grasp the grip | TE | Effective | 15.554 | 14 | 0.46662 | 0.29997 | 9 | 9.999 | Ineffective | H Holding the grip |
| 10 | Grasping the grip | G | Effective | 2.222 | 2 | 0.06666 | 0.06666 | 2 | 2.222 | Ineffective | H Holding the grip |
| 11 | Forcing the grip on handle | A | Effective | 75.548 | 68 | 2.26644 | 2.26644 | 68 | 75.548 | Effective | A Forcing the grip on the handle |
| 12 | Holding the grip | H | Ineffective | 2.222 | 2 | 0.06666 | 0.06666 | 2 | 2.222 | Effective | RL Releasing the grip |
| 13 | Positioning it for checking | P | Ineffective | 8.888 | 8 | 0.26664 | 0.26664 | 8 | 8.888 | Ineffective | UD Reaching to grasp the handle |
| 14 | Holding in position for checking it to be aligned | H | Ineffective | 8.888 | 8 | 0.26664 | 0.26664 | 8 | 8.888 | Ineffective | I Grasping the handle |
| 15 | Aligning the grip in the position | A | Effective | 33.33 | 30 | 0.9999 | 0.9999 | 30 | 33.33 | Ineffective | H Holding for aligning |
| 16 | Holding the grip | H | Ineffective | 5.555 | 5 | 0.16665 | 0.16665 | 5 | 5.555 | Effective | RL Releasing the grip |
| 17 | Moving the part to conveyer | TL | Effective | 55.55 | 50 | 1.6665 | 1.6665 | 50 | 55.55 | Ineffective | UD Idle |
| 18 | Placing the assy with grip on the conveyor | RL | Effective | 11.11 | 10 | 0.3333 | 0.3333 | 10 | 11.11 | Ineffective | UD Idle |
| TOTAL TIME(Revised) 11.59884 11.79882 | |||||||||||
b) Maynard Operation Sequence Technique (MOST)
Operation name, cycle, end and start points of the operations
Operation:- Grip insertion on the handle Parts:- Handle sub-assembly, Grip Operation start:- Handle sub-assembly in the bin, handle grip in the bin Operation ends:- Handle sub-assembly with grip inserted on conveyor Operator:- Mr. Nikhil Charted by:- Mr. Nitish & Mr. Aditya Dated:- 25-06-22
Determining the type and family to be used in the analysis of the operation:
The observed cycle time from the micro-motion study is 13.53 seconds which is less than 30 seconds.
Calculation of the frequency of occurrence of the operation-
The annual demand for the product is 200000 pieces.
So, the weekly demand for the product=200000/52 = 3,847 (approx.)
That gives repetition of operation as 3847 times per week approximately as the frequency of occurrence of this operation is once for a product which implies it to be more than 1500 repetitions a week.
Developing the decision table for selection of the MOST family to be used-
Below (Fig. 2) is a flowchart prepared to undergo the analysis involved of the operation involved in this study-
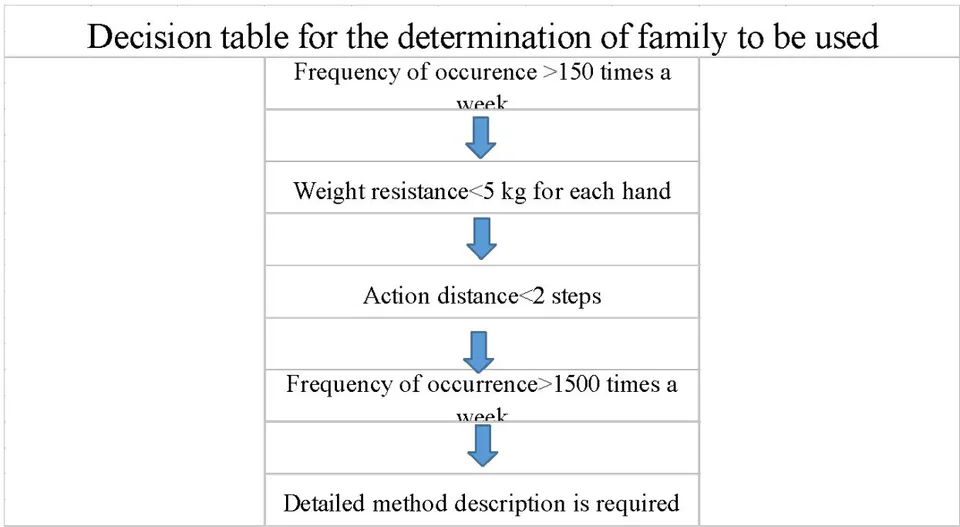
As evident from the above decision table, we need to perform the MiniMOST technique for the evaluation of this operation with a detailed description of activities.
The move sequences of activities for the operation
Keeping the sitting posture, reaching without bending, grasping the handle sub-assembly with the left hand located at around 30 cm from the assembly position, moving it without bending towards the comfortable assembly position and holding and retaining them for further operations.
Simultaneously, picking up the handle grip located at from the assembly position with the right hand, moving it towards the assembly position and positioning it on top of the handle sub-assembly with precise placement, accuracy less than and initial insertion of more than .
Releasing left hand and with the movement of more than and less than again grasping the grip.
By applying heavy force with both hands and overcoming friction, positioning of handle grip on handle sub-assembly with a movement of more than , aligning it with the pin insertion hole.
Un-holding the grip from the right hand and positioning it comfortably at a distance of around more than and less than .
Moving the assembled part to the conveyor belt with the left hand at around , setting it on the conveyor belt and moving it back to a comfortable position at around .
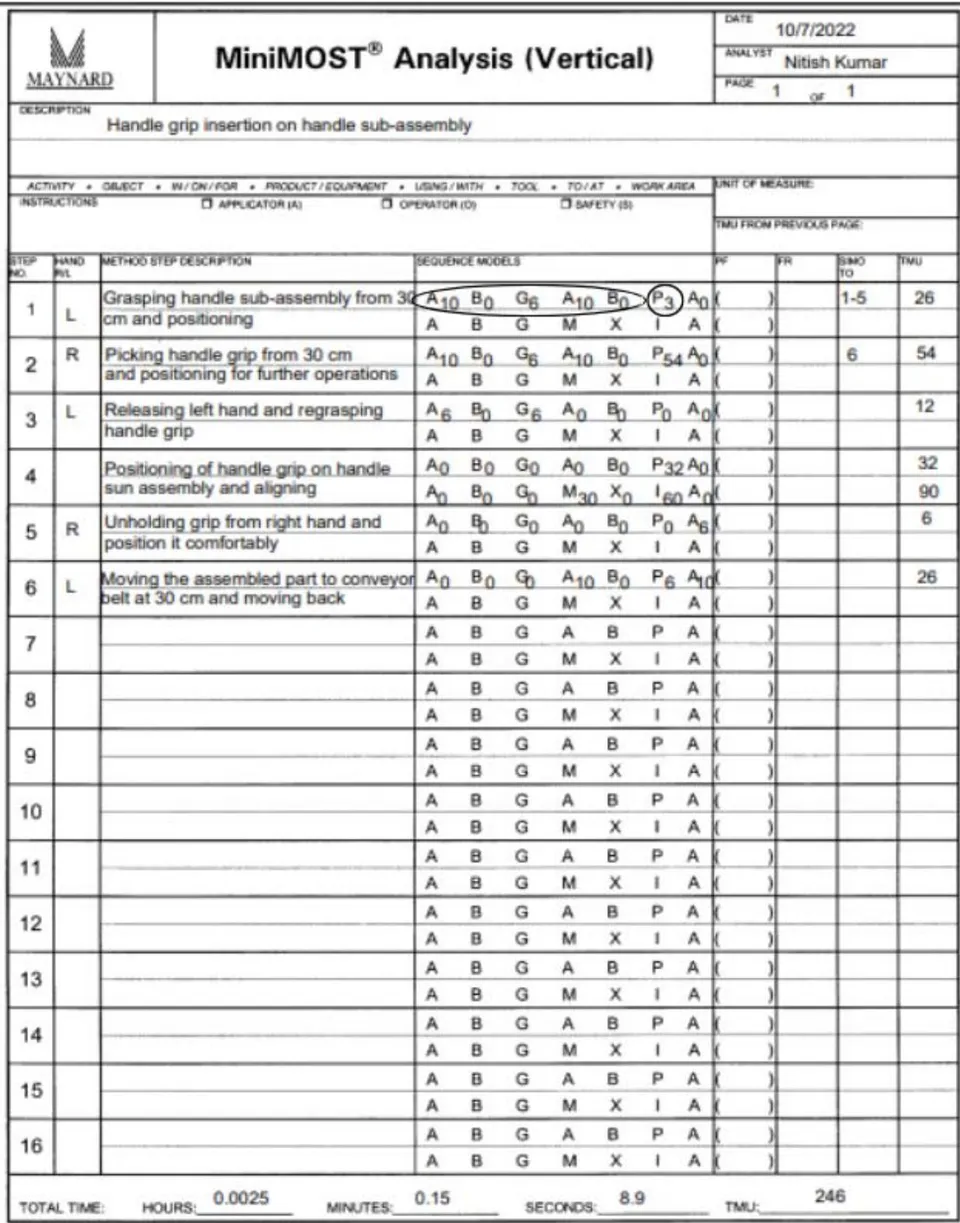
MiniMOST Analysis sheet based on the sequence of activities:-
Below (Fig. 3) is analysis sheet prepared by analysing activities involved in the operation under consideration of this study-
H.B.Maynard and Company, Inc.,12/2001
*Remarks:
As the application of limb force is very high because of the friction between combining parts the indices in the 4th step controlled sequence were considered from the BasicMOST data card instead of the MiniMOST data card. M3 and I6 were used.
Performance Calculations:-
Observed time and change in time after revision and analysis
Observed time before revision and analysis:
| Time (in seconds) (Right hand) | Time (in seconds) (Left hand) |
| 12.83 | 13.03 |
Observed time after revision of activities/elements:-
| Time (in seconds) (Right hand) | Time (in seconds) (Left hand) |
| 11.60 | 11.80 |
Percentage time reduction after analysing
| Percentage% (Right hand) | Percentage% (Left hand) |
| 9.61 | 9.46 |
Initial maximum time from micro-motion study and therblig analysis seconds.
Time calculations from MiniMOST analysis =8.90 seconds.
Percentage time reduction after analysing
Total reduction in time
Total percentage reduction in time
IV. RESULTS AND CONCLUSION
On the basis of the case study done and calculations performed we can conclude that optimisation of processes can be achieved by directing our interest on individual operations. Advanced work measurement techniques like Maynard Operation
Sequence Technique (MOST) can be used along with some detailed method analysis like Gilbreth's micromotion study to set standards for the workforce to increase productivity to optimal levels. Moreover, it has applications like removing non-value added elements from targeted operations and removing bottlenecks by setting standards. It may face some challenges from the workforce in the initial phases but with proper training and motivation, it can be effectively implemented in any organisation to improve productivity and increase profits. Increased profits can in turn help the workforce in the form of increased wages and incentives.