I. INTRODUCTION
In the modern period resources are in higher demand today because of rising global economic and demographic trends. Additionally, the COVID-19 and Russia-Ukraine war widen the global imbalance between supply and demand (Zakeri et al., 2022). As a result, the manufacturing sector is confronting significant difficulties due to rising costs for raw materials, energy, and logistics. This has led to a decline in consumer satisfaction and an increase in product pricing. It is known that the ready-made clothing (RMG) industry in Bangladesh has been one of the primary drivers of the country's economy (Mridha et al., 2022). Our RMG industry is mainly buyer oriented. So, customer satisfaction with low cost of the product is the major concern. As demand and supply gap is increasing day by day so resource optimization is now one of the major concerns to reduce the cost of production. So, this is why manufacturing companies now employ a variety of production policies to improve customer satisfaction and optimization of resources. There are several distinct production strategies, including make-to-stock (MTS) (Karabağ & Gökgür, 2022), make-to-order (MTO) (Smith, 2020), assemble-to-order (ATO) (Micieta et al., 2021), and mixed MTO & MTS. MTO (make to order) is a production strategy that starts manufacturing only after a customer's order is received. When a need is genuinely present, an assembly process begins, or manufacturing begins with development planning. Make to stock (MTS) is a traditional production strategy that is used in many industries to match production and inventory with customer demand forecasts. This method requires an accurate forecast of demand in order to determine how much stock should be produced. Each has pros and cons.
Production planning covers a variety of production-related topics, including suppliers, raw materials, quality control, lot sizing, transportation, and a host of others. For example, inventory costs, ordering costs, fixed costs, profit margins, break-even point costs, and many more are costs that are taken into account during manufacturing. Just-in-time (JIT), Materials Requirements Planning (MRP), Vendor Management Inventory (VMI), and Distribution Resource Planning are examples of inventory control techniques (DRP). Three different order size models are available for replenishing inventory: the quantity discount model, economic production quantity, and basic economic order quantity (EOQ) (Rafigh et al., 2022). However, the most crucial step is the one that decides whether an operation will be profitable or not. MTS and MTO have mostly been used in production planning sectors among these policies. Consider the cost of manufacturing as well as lot sizing as the process increases production flexibility.
a) Objective of the Study
The main objective of this research is to develop a proper mixed MTO & MTS method which will have unique steps to solve the problems which the industries have been facing. This mixed model will reduce inventory levels, turnover and improve equipment utilization.
II. LITERATURE REVIEW
MTO (make to order) is a production strategy which starts manufacturing only after a customer's order is received. When a need is genuinely present, an assembly process begins, or manufacturing begins with development planning. Other times, the production process begins with the acquisition of materials and parts, or even further back from development designing. In some circumstances, the process of assembling prepared pieces begins when actual demand develops (engineering). This system is actually conducted based on customer orders, leading to higher flexibility, low storage cost and long delivery times as the major features of these systems. As production is not done until a customer order is received. So this strategy eliminates finished- goods inventories and reduces a firm's exposure falling into financial risk. It usually requires long customer lead-times and large order backlogs.
Make to stock (MTS) is a traditional production strategy that is used in many industries to match production and inventory with customer demand forecasts. This method requires an accurate forecast of demand in order to determine how much stock should be produced. If demand for the product can properly be forecasted, the MTS strategy is an efficient choice for production. In the MTS systems, normally finished products are made and stocked upon the forecasted data according to customer demands and customers receive their products from nearby warehouses. Therefore, the main drawback to the MTS method of production is the inaccurate forecasts that will lead to losses, stemming from excess inventory or stock out.
Mixed MTS and MTO production system is one of the most unique strategies which have recently been attracted by the academicians and practitioners. In the past few years, companies have changed their production strategies towards hybrid MTS/MTO environments to achieve the advantages of both pure MTS and pure MTO systems simultaneously. In this regard, many studies have been done on the performance and control of these MTS-MTO systems combining pure MTS and MTO systems in a sequential manner to produce standard semi-finished modules and stock them as an unfinished/semi-finished inventory at the MTS stage (first step) and assign various finished products to order according to specific requirements through customization at the MTO stage. This is actually a Hybrid MTO & MTS system which is very versatile and many problems can be solved through this which was not possible before. It does both the work of MTO & MTS in the same time and it is very unique. Combination of MTO and MTS is the basis for advanced production management.
Lot sizing is a very crucial factor in this model. It mainly determines the quantity of an item which is ordered for delivery on a specific date or manufactured in a single production run. It can also be defined by the total quantity of a product ordered for producing or manufacturing. In a manufacturing industry or company, the raw materials are to be ordered from a supplier and the suppliers do not deliver the raw materials below their required lot size or quantity level with a price tag. So, choosing the proper lot sizing can be very much beneficial for an industry or any manufacturing company for optimizing the total cost. Nowadays it is being done in the newly developed industries or companies.
A heuristic framework with master production scheduling (MPS) was developed for an apparel factory in 2001. The target was to minimize the total cost whether the demands were completed before or after their due dates. (Najhan et al., 2016) The operations management research characterizes the production system as either make-to-order (MTO) or make-to-stock (MTS). The MTO systems offered a high variety of customer specific and typically, more expensive products. Capacity planning, order acceptance/rejection, and attaining high due-date adherence were the main operations issues. A proposal was made for a comprehensive hierarchical planning framework that covered the important production management decisions to serve as a starting point for evaluation. (Soman et al., 2004).
A hierarchical production planning structure for combined MTS/MTO was established in 2006. They developed the model of four phases. C A Soman, Van Donk, & Gaalman enforced the implementation of a production planning and scheduling framework for a medium-sized multi product food processing in 2007. As a consequence of huge increases in product variety and shorter lead time requirements of customers, the company was forced to shift a part of its production system from make to stock to make to order and had to operate under a Hybrid MTO and MTS strategy. (Noorwali, 2014) The MTO orders might be so low that a substantial amount of capacity became idle. This may lead to a higher production cost and result in undesirable loss in financial statements because semiconductor manufacturing was very capital-intensive. Some foundries might include the production of make-to-stock (MTS) products to increase capacity utilization. A proposal of scheduling method for such a hybrid MTO/MTS system with machine-dedication characteristics and constraint imposed on the process route caused by the advance of manufacturing technology. (Wu et al., 2008)
The customers can be grouped in market segments having specific characteristics, especially concerning the demand variety and the required customer lead-time. The end-products can be split in two classes: few products with high volume demands and a large number of products with low-volume demands. In order to reduce inventory costs, it seemed efficient to produce the high-volume products according to an MTS policy and the low volume products according to an MTO policy. Two policies were considered: the classical FIFO policy and a priority policy (PR), which gave priority to low volume products over high-volume products. (Youssef et al., 2017) Businesses competed on response time focused on producing a limited portfolio of products. Delaying product differentiation is a hybrid strategy that strives to reconcile the dual needs of high variety and quick response time. A common product platform was built to stock in the first stage of production, which was then differentiated into different products after demand was known in the second stage that referred make to stock and make to order. Delaying differentiation carried several benefits. Maintaining stocks of semi-finished goods reduced the order-fulfillment delay relative to the pure MTO system. Since many different end products had common parts, holding semi-finished goods inventory benefits from demand pooling, which was known to lower the amount of inventory needed to achieve a service-level performance equal to a comparable system with no pooling. (Gupta & Benjaafar, 2010)
Most applicable production policies are Make-To-Stock (MTS), Make-To-Order (MTO), Assemble-To-Order (ATO) and Engineer-To-Order (ETO) production policies can be used to satisfy customer's demands. Each policy had some specific advantages and disadvantages. Among them, MTS and MTO systems have been widely used in the production companies. In MTS companies, the customer's demands were satisfied with stocked inventories of finished products. The dominant features of such systems were shorter delivery time, heavy storage cost and low flexibility in responding to customized needs of customers (Kalantari et al., 2011). The production planning research had not been paying the necessary attention to the complexities of production systems of such items in 2011. Inventory control retailers acknowledged that papers discussing production scheduling of perishable goods were relatively rare, and papers discussing simultaneous lot sizing and scheduling were even rarer. Still, perishability was in several cases a very important issue concerning the tactical and operational level of production planning. (Amorim et al., 2011) Günalay developed production policies in 2011 inventory cost took a large portion of total manufacturing cost. For the maximum efficiency, both production and inventory systems should be considered at the same time. There was some conflicting objective faced by the Supplier. Suppliers created a variety of products to serve both large and small customer orders with unreliable demand information. They also faced customer pressure to improve quality, lower cost and reduce delivery delay. These conflicting objectives forced the use of both MTO and MTS strategies. There two production policies (MTO and MTS) were implied along with two scheduling strategies (FIFO VS CYCLIC). (Günalay, 2011)
Comparison and analysis of order fulfillment performance measures for two different production control systems: make-to-order versus make-to-stock in 2012. The formulated service maximization was modeled with inventory cost budget constraints to determine the right base-stock level for each component in the make-to-order (MTO) system and for the final product in the make-to-stock (MTS) system and identified the key driving factors. (Shao & Dong, 2012) Aslan, Stevenson, & Hendry revealed a case study on the ERP (Enterprise Resource Planning) selection process by a MTO company and concluded that more research was required to assist firms in determining the applicability of ERP in 2014. Make-To-Stock (MTS) producers might have a significant bearing on its internal decision-making processes and therefore, on any functionality it requires from an ERP system. Enterprise Resource Planning (ERP) system was investigated through a mixed method approach consisting of an exploratory and explanatory survey followed by three case studies. Data on Make-To-Stock (MTS) companies was also collected as a basis for comparison. (Aslan et al., 2014)
MTO and MTS systems could be used in many fields such as apparel and confection companies and also semiconductor factories. MTO/MTS hybrid system combines both policies which can be switched between both operations flexibly. A flexible service rule with demand prioritization and pricing rules were proposed. The operating cost and the MTO queue length were evaluated by Markov analysis.
(Kanda et al., 2015) Adan & Van Der Wal worked with lesser and lesser production systems organized in (MTS). A lot of research concerned the performance and control of these systems (multi-echelon inventory control). No product was made without a client. The analysis of these systems called for the queuing model. For production planning and inventory control, one was tempted to use one of two strategies: produce all demand to stock or produce all demand to order. In the 'make everything to order' case (MTO) the response times might become quite long if the load was high, in the 'make everything to stock' case (MTS) one got an enormous inventory if the number of different products was large. (Adan & Van Der Wal, n.d.)
There was a formulation of a nonlinear integer programming model for accurate planning, delivery and product quality for steel industries in 2015. For external market and internal manufacturing requirements, high equipment utilization and low production cost was needed for the comparative market policy. Order planning was a very important matter as for the bulky machines and high operating cost. The order planning played a vital role in the performance of the steel industry. The process referred to a mixed integer nonlinear programming model to solve the ordering plan with the combination of MTS/MTO. This concept referred to order planning and inventory matching of both finished and unfinished products. It exerted multiple objectives such as earliness/tardiness penalty, production cost, inventory matching cost, order cancelation penalty. It also offered an improved particle Swarm optimization (PSO) method. (Zhang et al., 2015)
Inventory is an important issue to fulfill customer's demand. Efficient inventory control improved its competitiveness. Inventory management control methods included Just In Time (JIT), Materials Requirement Planning (MRP), Vendor Management Inventory (VMI), and Distribution Resource Planning (DRP). In inventory there were three types of order size models including the basic economic order quantity (EOQ), economic production quantity (EPQ), and quantity discount model. (Najhan et al., 2016) The main features of MTS systems are high storage cost, shorter delivery time and low responsiveness to customer orders. On the other hand, MTO systems are conducted based on customer orders, leading to low storage cost, high flexibility and long delivery times. A method based on discrete event simulation was used to simulate the process of order receiving, raw materials warehousing and production in the kitchen of a five-star restaurant in Tehran. According to the important parameters of the result, with the geographical conditions and public interests in traditional foods, the increase of restaurant salon capacity had higher priority and could lead to increased net profit. (Rabbani & Dolatkhah, 2017) A model in order to reduce overall inventory costs and an efficient approach to produce some items according to a make-to-stock (MTS) policy and others according to a make-to-order (MTO) policy was established in 2017. Items priority levels played a key role in the optimal MTO/MTS decisions for such typical large-scale systems. To tackle this issue, the manufacturing facility was modeled as a multiproduct multi priority classic queuing system. A general optimization procedure was proposed that selected near-optimal priority classes, gave the associated flow control mode (MTO or MTS) for each product and provided a lower bound and an upper bound with respect to the optimal cost. (Youssef et al., 2017)
Textiles and clothing are the most dynamic products in world trade. Textile manufacturing systems involved more than one stage with each stage yielding a product that was either pulled as finished product or further reprocessed in the next stage. A different production planning method might be used for each production stage. Here hierarchical production planning could be taken. A hierarchical production planning and scheduling model encompassing an apparel production planning system. It presented a decision support system dealing with the production planning and scheduling in the textile industry. (Kotayet et al., n.d.) Product-mix scheduling problems are needed to minimize setup operations while keeping a due date and queuing time restrictions of every production WIP (work-in-process) and thus to maximize the OEE (Overall Equipment Effectiveness) of the machines while keeping a shorter lead time of the WIP. When a loading or a capacity of Fab were dynamically changing, the objective was that maximization of the resource utilization while keeping a due date and queuing time restrictions of every production lot. (Owner, n.d.)
Customer satisfaction played a key role in the competitive market and had been the most important reason to change managers' points of view. Some important strategy of production planning was discussed. Most particularly, the strategic level of Hybrid Make-To-Stock (MTS)/Make-To-Order (MTO) production contexts used Fuzzy Analytic Network Process. It emphasized the aggregate planning with ordering of products and to maintain the stock. (Rafiei & Rabbani, 2014)
There were several works which were done with either MTO or MTS. But for an individual, there were some disadvantages faced by the process such as long customer lead Times, large order backlogs and proper level of inventory etc. A mixed MTO and MTS model can reduce those disadvantages by considering each other's advantages. This mixed model will reduce inventory level, increase turnover, reduce lead time, and improve equipment utilization.
III. METHODS
Aggregate production planning is a marketing strategy that creates an aggregate plan for the production process 6-18 months in advance to give management an idea of how much material and other resources will be produced and when they will be produced. So that the total cost of operations for the organization is kept to a minimum over that period. In aggregate production planning, many criteria are included. This section discusses the extent to which outsourcing and subcontracting are used. Labor overtime, the number of laborers to be hired and fired in each period, and the amount of inventory to be held in stock and backlogged for each period are all decided. All of these activities are done within the framework of the company's ethics, policies, and long-term commitment to the society, community, and country of operation.
Aggregate planning has certain pre-required inputs which are inevitable. They involve
Information about the resources and the facilities available.
Demand forecast for the period for which the planning has to be done and when to be done.
The Cost of several alternatives and resources. This contains the cost of holding inventory, ordering cost, cost of production through various production alternatives like subcontracting, backordering and overtime cost.
The organizational policies regarding the usage of above alternatives.
"This planning is actually done by matching supply and demand of output over the medium time range, up to approximately 12 months into the future. The term aggregate determines that the planning is done for a single overall measure of output or, at the most, a few aggregated product categories. The aim of aggregate planning is to set overall output levels in the near to medium future in the face of fluctuating or uncertain demands. Aggregate planning may seek to influence demand as well as supply. The make to order (MTO) and make to stock (MTS) are important parts of this aggregate planning section.
Mixed MTO & MTS is a unique production system which is programmed as MILP and considered for evaluating this problem. It is an integer programming model for mathematical optimization or feasibility program in which some or all of the variables are restricted to be integers. In many settings the term refers to be Integer Linear Programming (ILP) in which the Objective function and constraints (other than the integer constraints) are linear. A mixed integer programming (MIP) problem can contain both integer and continuous variables. If the problem contains an objective function with no quadratic term (a linear objective), then the problem is termed as a Mixed Integer Linear Programming (MILP). However, if a quadratic term in the objective function is contained, the problem is termed as a Mixed Integer Quadratic Programming (MIQP).
Not only many important applications can be naturally modeled as MIQP but a variety of more general MINLP can be reformulated by this class of problems. Particularly MIQP comprises two widely studied classes of optimization problems:
- Mixed-integer linear programming. (MILP)
- Quadratic programming. (QP)
The process refers to the mixed integer linear Programming (MILP) using Lingo 18.0 for the required problems. The problem was with supplier, inventory cost, raw materials and scheduling. This model can be implemented in different kinds of industries like steel industries, garments factories and food industries. For this model industry will be able to reduce the production cost efficiently. There are some data which have been taken from Samad sweaters LTD for the simulation and formation of the model and getting output from it.
In this model the mixed integer linear programming being used as the result formulated by lingo 18.0. The process will also consider the lot sizing process for the optimization for the cost of production. The model will help to decide for choosing the appropriate lot sizing model. This model is composed of a mixed make to order (MTO) and make to stock (MTS) process which is a unique idea for the industries who want to optimize their cost. Another important subject is lot sizing which is considered in this model. The proposed model has been formulated and discussed with necessary parameters and diagrams.
a) Model Formation
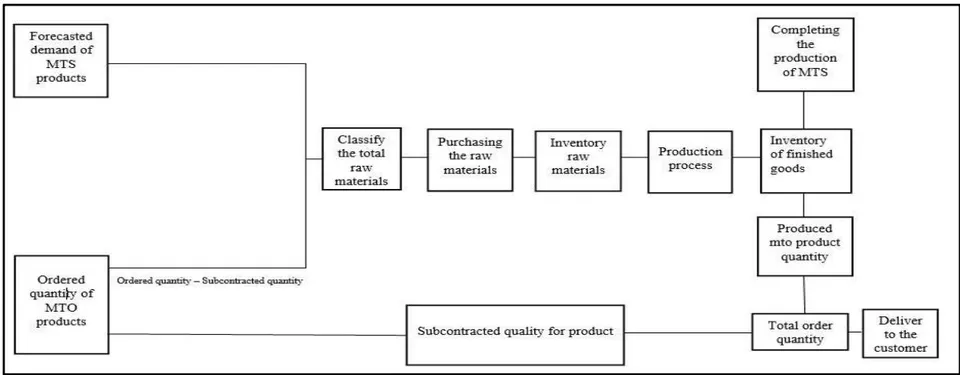
This statement is carried out in the working procedure: This system combines the make to order (MTO) and make to stock (MTS) processes in the same plant for fulfilling the market demand and new customers' orders at the same time while optimizing their total cost. By using this model, when and how much product needs to be produced at the regular time and overtime production can be known. It also defines the amount of raw material that needs to be purchased and how much should be sent to subcontract along with maintaining the inventory level. The amount of raw material bought from the supplier is dependent on the ordering cost per unit and lead time. If the ordering cost is higher, then ordering the raw materials for multiple orders at the same time will be a suitable option as it reduces the cost. Another important part of this model is the Subcontract portion. It is only applicable for the MTO products. The planning section determines the quantity of products if transferred to the subcontract portion is enough to deliver the final products on time. If the total cost line increases, then the model will calculate and transfer some portion to the subcontract to reduce the costs. A Flow Process of Mixed MTO & MTS Process is shown below in Figure 1:
b) Assumptions
Raw materials arrived at a promising time.
Overtime is allowed for MTO and MTS production.
The production capacity is known and fixed.
Subcontracting is allowed for MTO products only.
Production cost includes labor cost and maintenance cost.
There is no minimum batch size required for subcontracted products.
MTS production must be completed before the delivery date in order to supply them to the market.
When a new order is placed, a new planning horizon starts.
MTO products are to be delivered on the exact date.
There is no Shortage cost available.
c) Working Procedure
The following steps have been followed throughout the model
d) Index Sets
At the beginning of the planning horizon depending on the forecasted data (for a time period), calculating the ordering price and raw material purchasing price the planning section also classifies and plans when and how much raw material is required depending on the quantity of the product they are producing for the production.
Then it is planned how much raw material should be needed for any certain week and the required amount of raw material is ordered from the suppliers. The amount of raw material bought from the supplier is dependent on the ordering cost per unit and lead time.
After that, the required raw material is bought and brought in the inventory section considering the lead time before one week of the production starts.
If any raw material fails to come within the given time for the exceeding lead time, then there will be no production on that week and the production of that week will be switched to the next week.
| Sets | Index |
| T: set of time periods | t |
| I: set of made to order (MTO) products | i |
| J: set of made to stock (MTS) products | j |
| R: set of fabric types | r |
e) Input Parameters
| Input Parameters | ||
| Storage space required per unit of finished MTO product i | m3 | |
| Inventory cost of final MTO product i | USD | |
| Storage space required per unit of finished MTS product j | m3 | |
| Inventory cost of MTS product, j | USD | |
| Storage space required of per unit of finished raw material, r | m3 | |
| Inventory cost of raw material r | USD | |
| Regular time production cost for MTO product i | USD | |
| Overtime production cost of MTO product i during period t | USD | |
| Regular time product cost for MTS product j | USD | |
| Overtime production cost of MTS product j during period t | USD | |
| Subcontracting cost for MTO product i | USD | |
| Purchasing price of raw material r | USD | |
| Ordering cost of raw material r | USD | |
| Amount of raw material r required for MTO product i | UNIT | |
| Amount of raw material r required for MTS product j | UNIT | |
| WRMAX | Maximum inventory level of raw material | m3 |
| Working hour required to produce per unit MTO product i | Minute/product | |
| Working hour required produced per unit MTS product j | Minute/product | |
| ARWMAXt | Available regular maximum working hour at period t | Minute |
| AOWMAXt | Available maximum overtime working hour at period t | minute |
| Required to deliver the finished MTO product i at period t | UNIT | |
| Binary int variables, for subcontract delivery MTO products i during period t. for product that is not delivered and for product delivery | ||
| Binary integer variables, for allowing subcontract for MTO products. for no subcontract and otherwise | ||
| Forecasted demand of product j during period of t | UNIT | |
| Initial Inventory level of MTS product j | UNIT | |
| ILFPMAX | Maximum inventory level of final product | m3 |
| Binary integer variables, for MTO product m is produced in period t, otherwise | ||
| Confirmed order quantity for MTO product i | UNIT | |
| M | Large number | |
| Maximum order capacity for raw material r | UNIT | |
| Minimum order quantity for raw material r | UNIT | |
| Minimum batch size production for MTO products i | UNIT | |
| Minimum batch size production for MTS products j | UNIT | |
| PL | Number of production line | UNIT |
| Decision Variables | ||
| Inventory level of Final MTO product, i | UNIT | |
| Inventory level of Final MTS product, j | UNIT | |
| Inventory level of raw material r during period t | UNIT | |
| Regular time production quantity of MTO product i during period t | UNIT | |
| Overtime production quantity of MTO product i during period t | UNIT | |
| Regular time production quantity of MTS product j during period t | UNIT | |
| Overtime production quantity of MTS product j during period t | UNIT | |
| Subcontracting amount of product i | UNIT | |
| Raw material r bought at the period of t | UNIT | |
| Raw material r required at the period of t | UNIT | |
| Inventory level of final products at during period t | ||
| Binary integer variable, ; for MTO product j at the period of t will be produced, otherwise | ||
| Binary integer variable, ; for MTS product j at the period of t will be produced, otherwise | ||
| Binary integer variable, ; for raw material r purchased at the period of t, otherwise. | ||
f) The Objective Function
The objective function aims at optimizing the total cost of an industry by optimizing the inventory cost, production cost, subcontracting cost and purchasing cost. The subcontracting cost is a cost on which an industry decides whether they will subcontract their product or not depending on the cost optimization. If delivering an order under some constraints is required to fulfill a demand under subcontract, then it is done or vice versa.
g) Model Equation
Inventory Cost = Σ i Σ t ILF
Production Cost: = ∑i∑tRQitRPCi+ ∑i∑tOQitOPC+ ∑j∑tRQjtRPC+ ∑j∑tOQjtOPC
Subcontracting Cost:
Purchasing Cost:
MIN = Inventory Cost + Production Cost + Subcontracting cost + Purchasing cost
Subject to;
- ;
- ;
- ;
- ; ;
- ;
- ;
- .
The regular and overtime production of MTO and MTS by constraint (1) indicates the amount of raw material required for a certain period of time and (2) indicates what amount raw material is bought for inventory level. Equation (3) defines the maximum raw material inventory as constraints and (4) and (5) denotes the maximum available working hour capacity for regular and overtime products respectively. And (6) denotes the inventory level of finished MTO products. Equation ((7) indicates forecasted demands for MTS products and (8) indicates the inventory balance equation at the beginning of the planning horizon after fulfilling the first week forecasted demand from the finished goods inventory. The (9) satisfies the inventory level of the finished goods products and (10) defines the capacity constraints for the inventory level of final products. (11) Indicates the MTO order quantity for satisfactory constraints. Equation (12) and (13) determines the required purchasing raw material as it's a balance equation. The (14) & (15) implies the boundary level of the raw material purchasing quantity. The equation (16) & (17) satisfies the base size of production for MTO production and equation (18) & (19) presents the minimum batch production quantity of MTS products. The (20) (21) & (22) acts as a binary variable.
a) Data Outputs
i. Mixed MTO & MTS Production Process
IV. DATA ANALYSIS
There are many industries in our country in which either make to order (MTO) or make to stock (MTS) are done in order to manufacture products. This problem mainly occurs when the demand is so high and the delivery time is short. Nowadays, with increasing population, the demand is uncertain, and there needs a new model to solve this problem by optimizing the total cost. So, this optimized make to order and make to stock model can be applied to solve this problem as this model can be applied to any industry that follows only one of the above-mentioned processes. This model optimizes the total cost along with proper lot sizing. If any industry follows this model, they can optimize their total cost and fulfill the customer's demand. For continuing the both processes, we found a garment in which only make to order (MTO) is followed. But they get the order of the same product after 3-4 years which can be manufactured in make to stock (MTS). So, if they start doing make to stock along with make to order they can fulfill the entire demand. So, this model can be practically implemented and there are some data which has been taken from Samad sweaters LTD for the simulation and formation of the model and getting output from it.
| Time (Week) | 1 | 2 | 3 | 4 | 5 | 6 | 7 | 8 |
| Yarn (acrylic) | 380.932 | 370.932 | 0 | 659.5 | 0 | 330.5 | 0 | 0 |
| Zipper (6inch) | 380.932 | 370.932 | 0 | 1649.5 | 990 | 330.5 | 0 | 0 |
| Button | 17217 | 17157 | 14931.4 | 9897 | 5940 | 1983 | 0 | 0 |
| Accessories | 2869.5 | 2859.5 | 2488.57 | 1649.5 | 990 | 330.5 | 0 | 0 |
| Yarn (nylon) | 531.827 | 267.027 | 146.6 | 146.6 | 141.6 | 136.6 | 0 | 0 |
| Button | 8509.23 | 4272.43 | 2345.6 | 2345.6 | 2265.6 | 2185.6 | 0 | 0 |
| Accessories | 1063.65 | 534.054 | 293.2 | 293.2 | 283.2 | 273.2 | 0 | 0 |
| Time (Week) | 1 | 2 | 3 | 4 | 5 | 6 | 7 | 8 |
| Yarn (acrylic) | 330.5 | 10 | 370.932 | 839.068 | 659.5 | 659.5 | 330.5 | 0 |
| Zipper (6inch) | 330.5 | 10 | 370.932 | 839.068 | 659.5 | 659.5 | 330.5 | 0 |
| Button | 1983 | 60 | 2225.59 | 5034.41 | 3957 | 3957 | 1983 | 0 |
| Accessories | 330.5 | 10 | 370.932 | 839.068 | 659.5 | 659.5 | 330.5 | 0 |
| Yarn (nylon) | 136.6 | 264.8 | 120.427 | 0 | 5 | 5 | 136.6 | 0 |
| Button | 2185.6 | 4236.8 | 1926.83 | 0 | 80 | 80 | 2185.6 | 0 |
| Accessories | 273.2 | 529.6 | 240.854 | 0 | 10 | 10 | 273.2 | 0 |
| Time (Week) | 1 | 2 | 3 | 4 | 5 | 6 | 7 | 8 |
| Yarn (acrylic) | 711.432 | 0 | 0 | 1498.57 | 0 | 990 | 0 | 0 |
| Zipper (6inch) | 711.432 | 0 | 0 | 2488.57 | 0 | 0 | 0 | 0 |
| Button | 19200 | 0 | 0 | 0 | 0 | 0 | 0 | 0 |
| Accessories | 3200 | 0 | 0 | 0 | 0 | 0 | 0 | 0 |
| Yarn (nylon) | 668.427 | 0 | 0 | 0 | 0 | 0 | 0 | 0 |
| Button | 10694.8 | 0 | 0 | 0 | 0 | 0 | 0 | 0 |
| Accessories | 1336.85 | 0 | 0 | 0 | 0 | 0 | 0 | 0 |
| Time (Week) | 1 | 2 | 3 | 4 | 5 | 6 | 7 | 8 | |
| Heavy knit wear (Red) | Regular time | 330.5 | 10 | 10 | 0 | 659.5 | 659.5 | 330.5 | 0 |
| Over time | 0 | 0 | 0 | 0 | 0 | 0 | 0 | 0 | |
| Sweater (Orange) | Regular time | 273.2 | 529.6 | 240.85 | 0 | 10 | 10 | 273.2 | 0 |
| Over time | 0 | 0 | 0 | 0 | 0 | 0 | 0 | 0 | |
| Heavy knit wear (Black) | Regular time | 0 | 0 | 360.93 | 672 | 0 | 0 | 0 | 0 |
| Over time | 0 | 0 | 0 | 167.06 | 0 | 0 | 0 | 0 | |
| Time (Week) | 1 | 2 | 3 | 4 | 5 | 6 | 7 | 8 | |
| Heavy knit wear (Red) | Regular time | 727.1 | 22 | 22 | 0 | 1450.9 | 1450.9 | 727.1 | 0 |
| Over time | 0 | 0 | 0 | 0 | 0 | 0 | 0 | 0 | |
| Sweater (Orange) | Regular time | 751.3 | 1456.4 | 662.34 | 0 | 27.5 | 27.5 | 751.3 | 0 |
| Over time | 0 | 0 | 0 | 0 | 0 | 0 | 0 | 0 | |
| Heavy knit wear (Black) | Regular time | 0 | 0 | 794.05 | 1478.4 | 0 | 0 | 0 | 0 |
| Over time | 0 | 0 | 0 | 417.66 | 0 | 0 | 0 | 0 | |
| Time (Week) | 1 | 2 | 3 | 4 | 5 | 6 | 7 | 8 |
| Heavy knit wear (Red) | 0.661 | 0.681 | 0.701 | 0.701 | 2.02 | 3.339 | 4 | 0 |
| Sweater (Orange) | 0.262 | 0.77068 | 1.00190 | 1.00190 | 1.01150 | 1.02110 | 0 | 0 |
| Heavy knit wear (Black) | 0 | 0 | 18.0466 | 0 | 0 | 0 | 0 | 0 |
| Time (Week) | 1 | 2 | 3 | 4 | 5 | 6 | 7 | 8 |
| Yarn (acrylic) | 1.904 | 1.8546 | 0 | 3.2975 | 0 | 1.6525 | 0 | 0 |
| Zipper (6inch) | 0.57 | 0.5563 | 0 | 2.4742 | 1.485 | 0.49575 | 0 | 0 |
| Button | 0.172 | 0.1715 | 0.1493 | 0.0989 | 0.0594 | 0.01983 | 0 | 0 |
| Accessories | 0.028 | 0.0285 | 0.0248 | 0.0164 | 0.0099 | 0.00330 | 0 | 0 |
| Yarn (nylon) | 1.595 | 0.8010 | 0.4398 | 0.4398 | 0.4248 | 0.4098 | 0 | 0 |
| Button | 0.085 | 0.0427 | 0.0234 | 0.0234 | 0.02265 | 0.02185 | 0 | 0 |
| Accessories | 0.010 | 0.0053 | 0.0029 | 0.0029 | 0.00283 | 0.00273 | 0 | 0 |
| Time (Week) | 1 | 2 | 3 | 4 | 5 | 6 | 7 | 8 |
| Yarn (acrylic) | 1422.86 | 0 | 0 | 2997.13 | 0 | 1980 | 0 | 0 |
| Zipper (6inch) | 469.54 | 0 | 0 | 1642.45 | 0 | 0 | 0 | 0 |
| Button | 1536 | 0 | 0 | 0 | 0 | 0 | 0 | 0 |
| Accessories | 1056 | 0 | 0 | 0 | 0 | 0 | 0 | 0 |
| Yarn (nylon) | 2005.28 | 0 | 0 | 0 | 0 | 0 | 0 | 0 |
| Button | 1818.12 | 0 | 0 | 0 | 0 | 0 | 0 | 0 |
| Accessories | 1898.33 | 0 | 0 | 0 | 0 | 0 | 0 | 0 |
| subcontract for Heavy knit wear (Red) | 0 |
| subcontract for Sweater (Orange) | 163.15 |
| subcontract for Heavy knit wear (Red) | 0 |
| subcontract for Sweater (Orange) | 1182.838 |
ii. MTO Production Process
| Time (Week) | 1 | 2 | 3 | 4 | 5 | 6 | 7 | 8 | |
| Heavy knit wear (Red) | Regular time | 1441.5 | 22 | 22 | 22 | 0 | 1450.9 | 1441.5 | 0 |
| Over time | 0 | 0 | 0 | 0 | 0 | 0 | 0 | 0 | |
| Sweater (Orange) | Regular time | 36.85 | 1456.4 | 1456.4 | 1120.35 | 0 | 27.5 | 27.5 | 0 |
| Over time | 0 | 0 | 0 | 0 | 0 | 0 | 0 | 0 | |
| Heavy knit wear (Black) | Regular time | 0 | 0 | 0 | 0 | 0 | 0 | 0 | 0 |
| Over time | 0 | 0 | 0 | 0 | 0 | 0 | 0 | 0 | |
Table 4.12: Inventory Cost of final product for MTO Production process
| Time (Week) | 1 | 2 | 3 | 4 | 5 | 6 | 7 | 8 |
| Heavy knit wear (Red) | 1.3305 | 1.3505 | 1.3705 | 1.371 | 2.689 | 4 | 0 | 0 |
| Sweater (Orange) | 0.5212 | 1.0297 | 1.4208 | 1.421 | 1.430 | 0 | 0 | 0 |
| Heavy knit wear (Black) | 0 | 0 | 0 | 0 | 0 | 0 | 0 | 0 |
| Time (Week) | 1 | 2 | 3 | 4 | 5 | 6 | 7 | 8 |
| Yarn (acrylic) | 1370.5 | 0 | 0 | 0 | 0 | 2629.5 | 0 | 0 |
| Zipper (6inch) | 452.265 | 0 | 0 | 0 | 0 | 867.735 | 0 | 0 |
| Button | 960 | 0 | 0 | 0 | 0 | 0 | 0 | 0 |
| Accessories | 660 | 0 | 0 | 0 | 0 | 0 | 0 | 0 |
| Yarn (nylon) | 2250 | 0 | 0 | 0 | 0 | 0 | 0 | 0 |
| Button | 2040 | 0 | 0 | 0 | 0 | 0 | 0 | 0 |
| Accessories | 2130 | 0 | 0 | 0 | 0 | 0 | 0 | 0 |
| Time (Week) | 1 | 2 | 3 | 4 | 5 | 6 | 7 | 8 |
| Yarn (acrylic) | 0.15 | 0.1 | 0.05 | 0 | 0 | 3.2762 | 0 | 0 |
| Zipper (6inch) | 0.045 | 0.03 | 0.015 | 0 | 0 | 0.9828 | 0 | 0 |
| Button | 0.0806 | 0.08009 | 0.0794 | 0.078 | 0.0788 | 0.0393 | 0 | 0 |
| Accessories | 0.0134 | 0.01335 | 0.0132 | 0.013 | 0.0131 | 0.0065 | 0 | 0 |
| Yarn (nylon) | 2.2299 | 1.4355 | 0.6411 | 0.03 | 0.03 | 0.015 | 0 | 0 |
| Button | 0.1189 | 0.07656 | 0.0341 | 0.001 | 0.0016 | 0.0008 | 0 | 0 |
| Accessories | 0.0148 | 0.00957 | 0.0042 | 0.000 | 0.0002 | 0.0001 | 0 | 0 |
| Subcontract for Heavy knit wear (Red) | 0 |
| Subcontract for Sweater (Orange) | 0 |
iii. MTS Production Process
| Time (Week) | 1 | 2 | 3 | 4 | 5 | 6 | 7 | 8 | |
| Heavy knit wear (Red) | Regular time | 0 | 0 | 0 | 0 | 0 | 0 | 0 | 0 |
| Over time | 0 | 0 | 0 | 0 | 0 | 0 | 0 | 0 | |
| Sweater (Orange) | Regular time | 0 | 0 | 0 | 0 | 0 | 0 | 0 | 0 |
| Over time | 0 | 0 | 0 | 0 | 0 | 0 | 0 | 0 | |
| Heavy knit wear (Black) | Regular time | 0 | 0 | 880 | 1478.4 | 0 | 0 | 0 | 0 |
| Over time | 0 | 0 | 0 | 281.6 | 0 | 0 | 0 | 0 | |
| Time (Week) | 1 | 2 | 3 | 4 | 5 | 6 | 7 | 8 |
| Heavy knit wear (Red) | 0 | 0 | 0 | 0 | 0 | 0 | 0 | 0 |
| Sweater (Orange) | 0 | 0 | 0 | 0 | 0 | 0 | 0 | 0 |
| Heavy knit wear (Black) | 0 | 0 | 0 | 0 | 0 | 0 | 0 | 0 |
| Time (Week) | 1 | 2 | 3 | 4 | 5 | 6 | 7 | 8 |
| Yarn (Acrylic) | 0 | 0 | 2400 | 0 | 0 | 0 | 0 | 0 |
| Zipper (6inch) | 0 | 0 | 792 | 0 | 0 | 0 | 0 | 0 |
| Button | 0 | 0 | 576 | 0 | 0 | 0 | 0 | 0 |
| Accessories | 0 | 0 | 396 | 0 | 0 | 0 | 0 | 0 |
| Yarn (nylon) | 0 | 0 | 0 | 0 | 0 | 0 | 0 | 0 |
| Button | 0 | 0 | 0 | 0 | 0 | 0 | 0 | 0 |
| Accessories | 0 | 0 | 0 | 0 | 0 | 0 | 0 | 0 |
| Time (Week) | 1 | 2 | 3 | 4 | 5 | 6 | 7 | 8 |
| Yarn (acrylic) | 0 | 0 | 4 | 0 | 0 | 0 | 0 | 0 |
| Zipper (6inch) | 0 | 0 | 1.2 | 0 | 0 | 0 | 0 | 0 |
| Button | 0 | 0 | 0.048 | 0 | 0 | 0 | 0 | 0 |
| Accessories | 0 | 0 | 0.008 | 0 | 0 | 0 | 0 | 0 |
| Yarn (nylon) | 0 | 0 | 0 | 0 | 0 | 0 | 0 | 0 |
| Button | 0 | 0 | 0 | 0 | 0 | 0 | 0 | 0 |
| Accessories | 0 | 0 | 0 | 0 | 0 | 0 | 0 | 0 |
| subcontract for Heavy knit wear (Red) | 0 |
| subcontract for Sweater (Orange) | 0 |
| Production process | Mixed MTO & MTS Process | MTO process | MTS Process | MTO and MTS Sum cost |
| Inventory cost | 54.65166 | 29.06159 | 25.25600 | 54.31759 |
| Production cost | 10766.47 | 8525.000 | 2678.400 | 11203.4 |
| Raw material purchasing cost | 16890.74 | 13418.00 | 4189.000 | 17607 |
| Subcontracting cost | 1182.807 | 0 | 0 | 0 |
| Total Cost | 28894.66866 | 21972.0616 | 6892.656 | 28864.71759 |
| Time (Week) | 1 | 2 | 3 | 4 | 5 | 6 | 7 | 8 |
| Mixed MTO & MTS | 0.92327 | 1.45168 | 1.70290 | 1.70290 | 3.03150 | 4.36010 | 4 | 0 |
| MTO | 1.85178 | 2.3802 | 2.7913 | 2.7913 | 4.1199 | 4 | 0 | 0 |
V. RESULTS AND DISCUSSIONS
By considering decision variables and input variables, the below graphs have been mentioned to analyze the optimization of the model to be exerted. To solve this model, Lingo 18 is used. The data collected from Samad group has been implemented in Lingo code. And the result found from the code is 28894.7
USD, the total production cost. The representation of the graphical expressions by analyzing output data with respect to time has been given below. In those data, comparison of MTO and MTS and Mixed MTO & MTS has shown respectively. The graphical expression shows the optimization of the model.
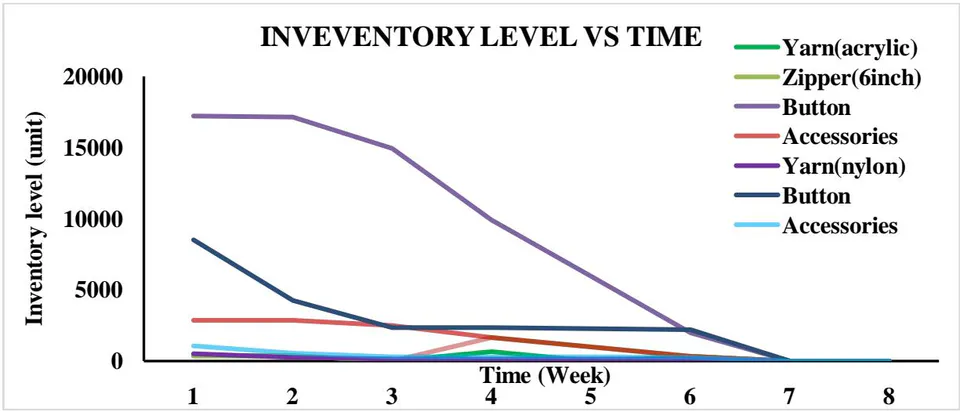
Figure 2 actually shows the inventory level of raw material from time to time over the time period. We can clearly see that buttons in the inventory are 17217 units in the first week which is much more than the other raw materials at that week. The second highest is another type of buttons which are 8509.23 units. After that, accessories are 2869.5 units and the second type of accessories are 1063.65 units available in the inventory at the first week. Yarn (nylon) is available at 531.827 and yarn (acrylic) is 380.932 along with a zipper
(6 inch) in the inventory for the first week. In the third week the inventory for both of the product's yarn (acrylic) and zipper (6 inch) is zero. Then it is again replenished from the fourth week. From the graph it is also clear that at the seventh and eighth week the inventory is totally zero for all the materials.
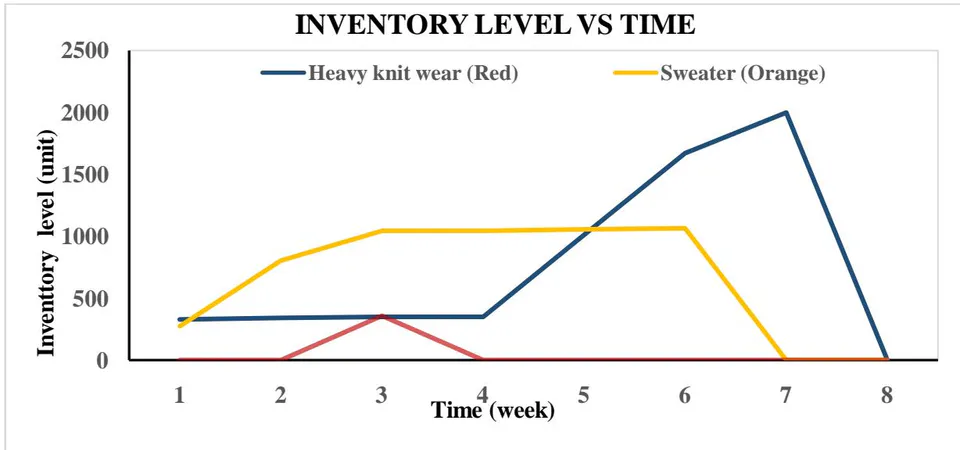
From the graph in Figure 3, we can clearly see the fluctuating demand of these products according to time versus inventory level. When the demand is higher, the required raw material is brought into inventory so that products can be produced according to demand. There are three types of products: Heavy knit wear (Black), heavy knit wear (Red) and sweater. Inventory level shows the demand in the period of time span and how much should be produced. The inventory level of heavy knit wear (Red) is 330.5 units in the first week and it is much more than the other two. The inventory of sweaters (Orange) is 273.3 units in the first week and it becomes zero in the seventh week. The inventory level of heavy knit wear (Black) at the first and second week is zero and 360.932 units at the third week. Inventory for all the three finished products becomes zero at the eighth week.
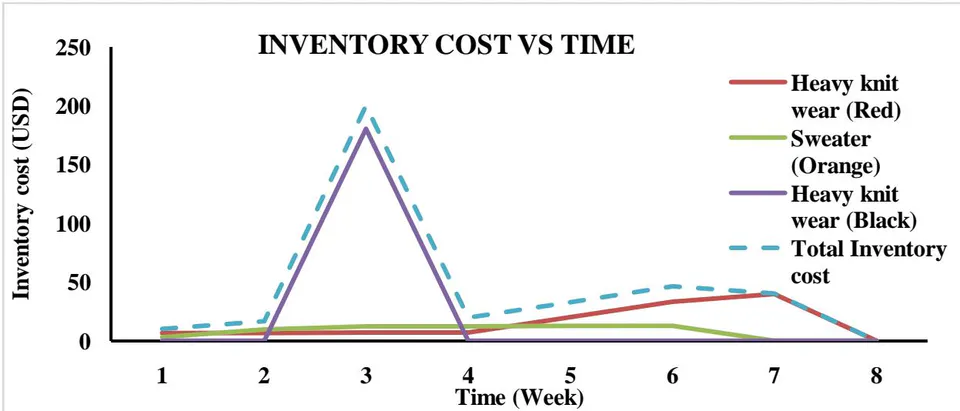
From the graph in Figure 4, it is seen that the inventory cost of heavy knit wear (Red) is higher, which is 0.661 units is in the first week and 0.701 for the third and fourth week respectively, than the other two of the products. The inventory cost of Sweater (Orange) is.26227 and.77068 in the first and second week respectively. The inventory cost of heavy knit wear (Black) at the first and second week is zero unit but it is 18.0466 units at the third week of the mixed MTO & MTS process. The inventory cost of black colored neat wear is higher than the red colored knit wear. In the eight week all the inventories become zero units.
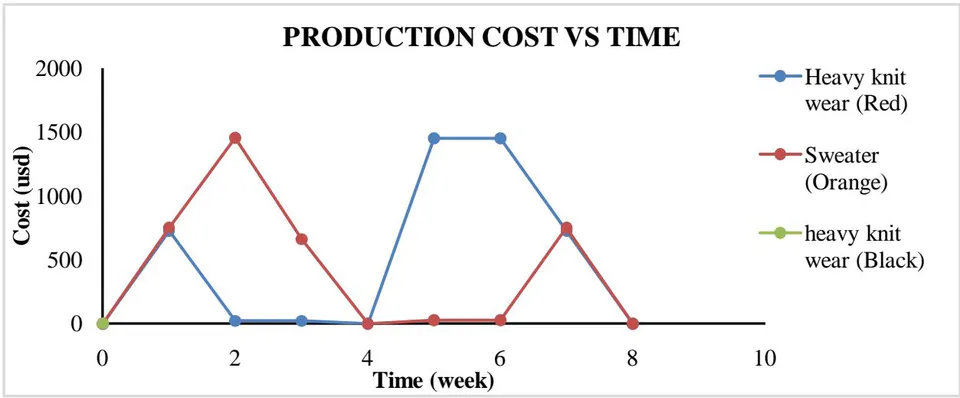
In Figure 5, it is seen that the production cost of Sweater (Orange) is higher in the second week than the other two which is 1456.4 units and 662.349 in the third week. And it is increasing from the first week and decreasing at the fourth week. Again, the Heavy knit wear follows the same trend from fourth to eighth week and ends up at the eighth week. The cost of Heavy knit wear (Red) is 727.1 units in the first week and 22 units in the second and third week respectively which decreases than the first week. But the cost of the Sweater (Orange) line is horizontal from fourth to sixth week and the value is 27.5 units for regular time and zero units for overtime. The cost of Heavy knit wear (Black) is 794.051 units and 1478.4 units in the third and fourth week respectively. At the eight week the cost for all the products is zero unit.
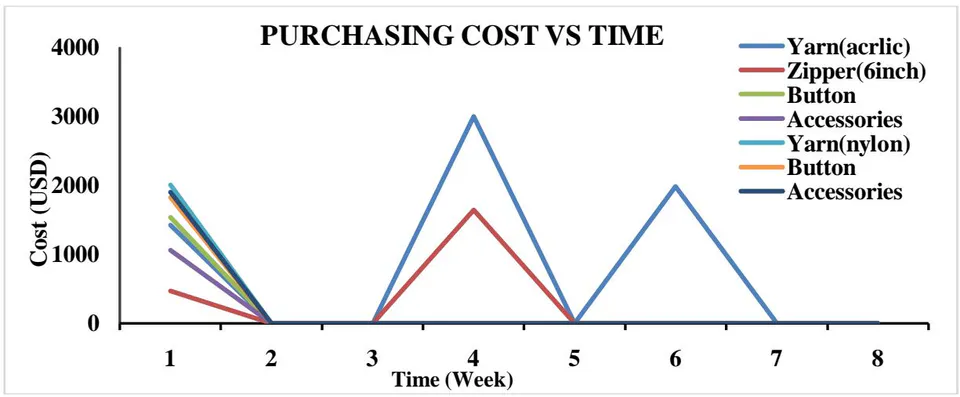
Figure 6 shows that the purchasing cost of all the raw materials vary from material to material. The raw material is bought in the first week and stored. The purchasing costs of Yarn (acrylic), zipper (6 inch), button first type, accessories first type, yarn (nylon), button second type and accessories second type are 1422.865, 469.545, 1536, 1056, 2005.281, 1818.121 and 1898.333 units respectively. The purchasing costs of yarn (acrylic) and zipper (6 inch) are 2997.136 and 1642.455 units in the third and fourth week which are higher than all of the other materials. At the sixth week the purchasing cost of yarn (acrylic) is 1980 units and the others are zero. At the eight-week purchasing cost of all the materials is zero.
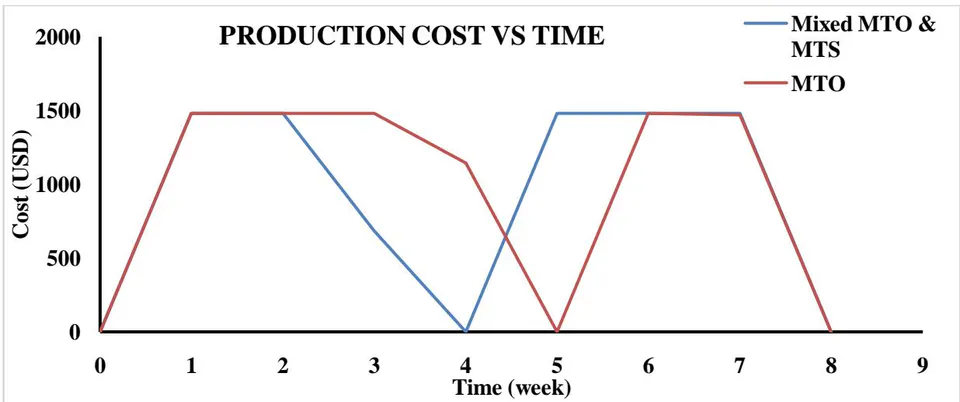
Figure 7 determines the comparison between the costs. It is clearly seen that the production cost of the MTO production process starts decreasing after the third week and the cost of the mixed MTO & MTS system decreases from the second week. The mixed cost again goes up from the fourth week and stays horizontal to time before the eighth week. The production cost of Heavy knit wear (Red) is 727.1 units and Sweater (Orange) is 751.3 units in the first week. The production cost of Sweater (Orange) is 1456.4 units which is greater than Heavy knit wear (Red). For Heavy knit wear (Red) at the fifth and sixth week the production cost is 1450.9 respectively. And the production cost of Heavy knit wear (Black) is zero units for the first to third week and 417.6 units for the fourth week. At the eighth week the production cost for all the products is zero.
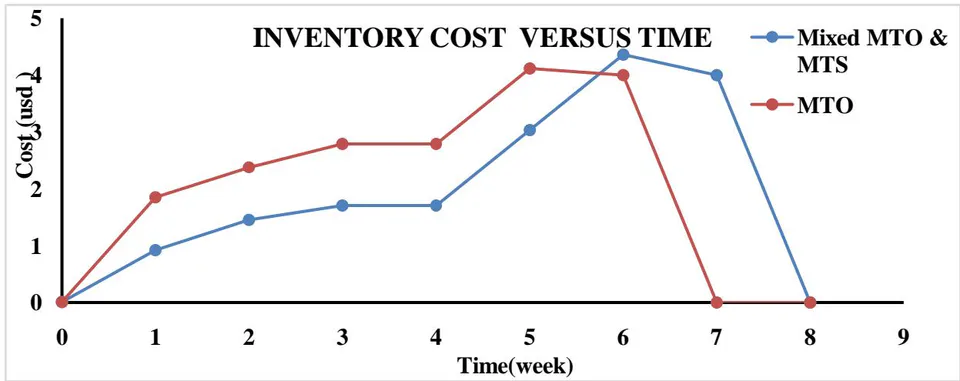
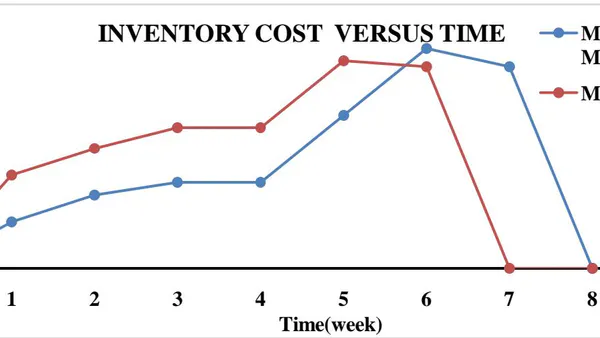
Figure 8 shows the comparison of inventory cost between mixed systems and MTO systems. It is clearly seen that the inventory cost of mixed MTO & MTS systems is less than the MTO till the fifth week but at the sixth week it becomes higher. From the table it is seen that the inventory cost for Sweater (Orange) is.26227 and.770688 units at the first and second week and 1.00190 units for the third and fourth week. The inventory cost of Heavy knit wear (Red) is higher till second week which is.661 and.681 units. But it starts decreasing from the third week and the value is.701 units. Again, it increases in the fifth week which is 2.02 units. In the eighth week the inventory cost for the mixed production system is zero and at the seventh week the inventory cost for the MTO production system becomes zero.
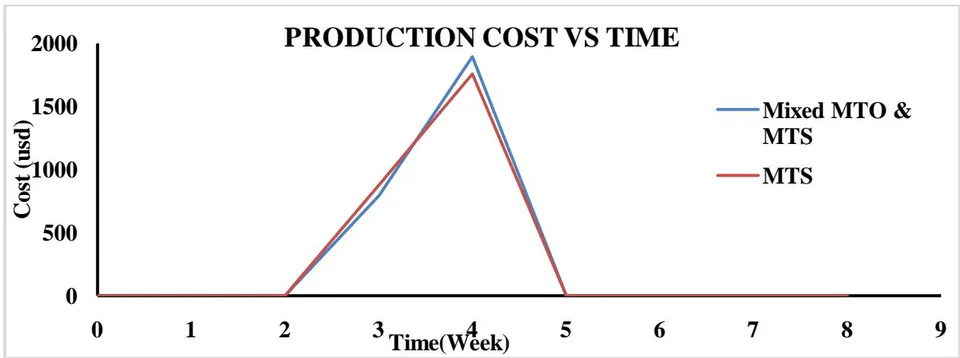
Figure 9 clearly shows that the production cost of MTS systems is less than the mixed MTO & MTS systems. And the products need to be delivered at the fifth week because a new order will be ordered at the beginning of the fifth week. The production cost of mixed MTO & MTS is 1900 and something and the production cost of MTO is 1800 at the fifth week which is less than the other.
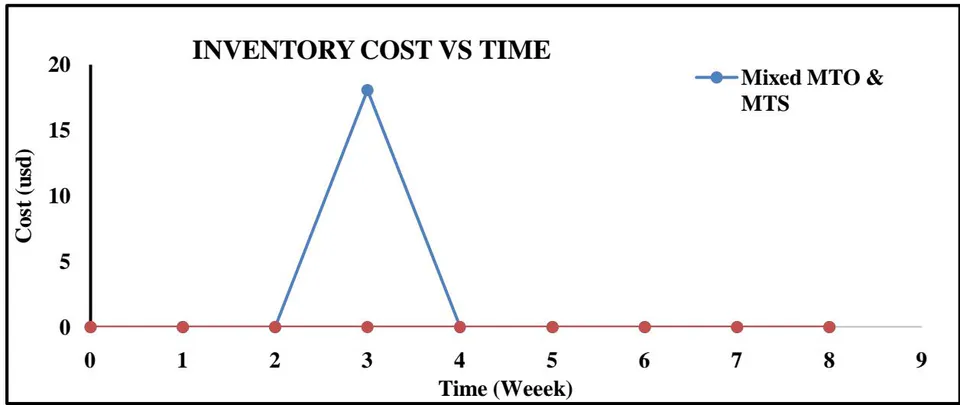
Figure 10 shows that the inventory cost of the MTS production system remains zero till the eighth week. But the cost of mixed MTO & MTS is highest in the third week and the fourth week inventory cost becomes zero. From the table it is seen that the inventory cost of mixed MTO & MTS is 18 units.
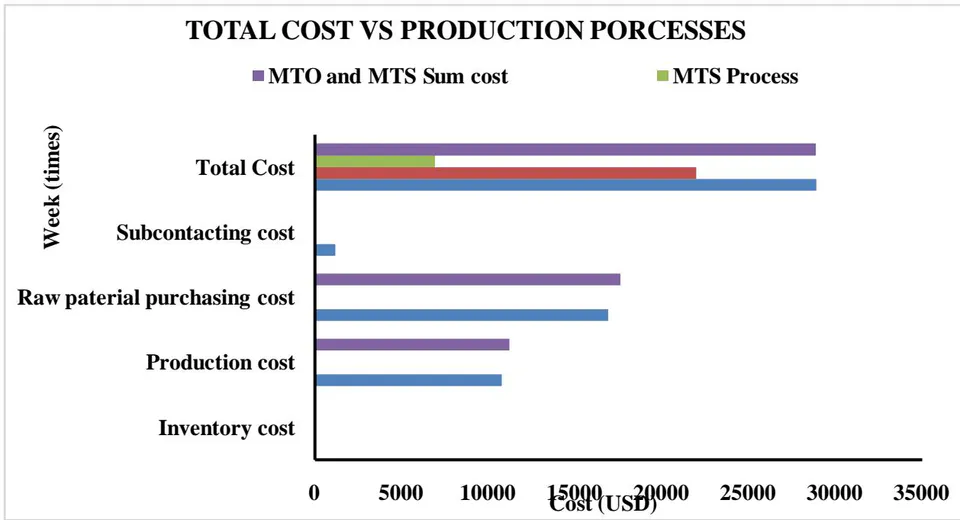
Figure 11 shows the total production costs. In the mixed MTO & MTS system the production cost is 28894.67 which is greater than the cost 28864.72 of the MTO process. The subcontracting cost is only found in mixed MTO & MTS processes as the model shows. It is beneficial for a plant if any plant follows the mixed production system. Because if they follow the separate plant, they need to consider the multiple fixed cost which will be greater than the single fixed cost for Mixed MTO & MTS production process in a single plant.
VI. CONCLUSIONS
The major objectives of this research are lot sizing and mixed integer linear programming for an industrial scenario in Bangladesh. Several industries, including apparel, food, steel, and woods, were reviewed to see where output was deficient. By reviewing those industries, the common phenomena that happened is either MTO or MTS process. By following an individual process those industries imply in either the backlog of customer orders or the lagging of the lead time or failing to adopt the proper lot sizing. For those reasons, this research paper is being introduced to get rid of those problems and to maintain a proper production flow. With a mixed MTO and MTS process, an individual industry can consider the disadvantages of MTO and MTS and thus can reach a considerable point where those problems will be at a low level and the achievement will be at a greater position. The model is termed as a mixed integer linear programming model. The model will help to choose the proper lot sizing and to optimize the cost of production.
a) Recommendation
There is no shortage cost that is included here. All of the variables are restricted to be integers. However, if a quadratic term in the objective function contains, the problem will be termed as a Mixed Integer Quadratic Programming (MIQP) from the Mixed Integer Linear Programming.
In this model, some improvements have been done. But some more improvements could not be done because of insufficient data that was very important for improving the model. More things can be implemented in this model for future recommendation. Like-
- Shortage cost
- Supplier selection
- Discount model.
Shortage cost can also be added in this MILP model. But we failed to find this kind of industry in our country so that we could not generate that data to implement this in our model. Generally, an industry has one or more reliable suppliers and sometimes the number differs from industry to industry. They buy raw materials from that reliable supplier. Sometimes they had to rely on different suppliers if their regular supplier cannot deliver their raw material for facing problems or unwanted situations.
In that case, the supplier selection model has to apply for supplier selection to optimize the cost. So, the supplier selection model can be added with this model for development. Discount models can also be applied in this model. Like Quantity discount model, Volume discount model and Dividend discount model. We could not find that type of industry for applying all these models and collecting the data. But if the data can be managed, this type of work will surely develop the model a lot. By applying this model, this model can be enriched more fluently and accurately.
b) Declarations
Availability of Data and Material
All the data generated or analyzed during this study are included in this paper. Data tables include all raw data conducted via the used software (Lingo 18.0), which has been further analyzed via the paper sections.
Competing Interests
The authors declare that they have no competing interests.
Funding
This study received no funding from any resource.
Authors' Contributions
All the authors of this paper contributed to the manuscript and have read and approved the final version. Each of them contributed to outline the study idea, designed the methodology, performed the literature review, conducted the simulation and its analysis, and responsible for writing the manuscript details, figures, and revisions.
ACKNOWLEDGEMENTS
This research was partially supported by SAMAD sweaters Ltd., Bangladesh.
List of Abbreviations
MTO Make to order MTO
MTS Make to stock
ATO Assemble to order
ERP Enterprise Resource Planning
ETO Engineer to Order
WIP Work in process
OEE Overall Equipment Effectiveness
JIT Just-in-time
MRP Materials Requirements Planning
VMI Vendor Management Inventory
DRP Distribution Resource Planning
EOQ Economic Order Quantity