This study utilized the Aspen HYSYS Simulator Version 8.6 to simulate plant operations and optimize natural gas recovery using Technip’s feed gas composition. The focus was on investigating the effects of product recycling and determining the optimal feed tray position within the distillation column. Technip’s feed gas composition was selected due to its relevance in realworld applications, influencing the efficiency of methane recovery. The results indicated that maximum methane recovery occurred with zero product recycling and increasing the number of trays significantly enhanced methane recovery in the column overhead. Specifically, the analysis revealed a direct correlation between the number of trays and methane recovery efficiency. To support these findings, mathematical models were developed: one for predicting the optimal feed tray position represented as y=-0.01×2 +x-3y=-0.01×2+x-3, and two models for calculating the required number of trays for desired fractions of methane and natural gas liquids (NGLs) in the overhead.
## I. INTRODUCTION
Natural gas is increasingly recognized as a bridge fuel, facilitating the transition from current fossil fuel reliance to renewable energy sources (Mokhatab, 2006). It is the fastest-growing hydrocarbon, with an average growth rate estimated at $1.5 - 2.0\%$. The demand for natural gas is rising due to its clean-burning characteristics, which align with contemporary environmental standards. Thus, the industry's primary goal is to enhance the processing and production of hydrocarbons in an environmentally friendly and cost-effective manner (Abdel-Aal & Mohamed, 2003).
Natural gas can be categorized into two main types based on its source: conventional and non-conventional deposits (Peyerl & Figueiroa, 2016). Conventional natural gas typically originates from highly permeable rocks and is extracted using traditional vertical drilling techniques (Salah et al., 2021). In contrast, non-conventional gas may come from formations with lower permeability, requiring different extraction methods (GPSA, 2004). By 2030, natural gas is projected to replace coal as the second most widely used energy source globally, highlighting its growing significance in the energy landscape (Alireza, 2014).
A key aspect of natural gas production is the recovery of natural gas liquids (NGLs), which include ethane, propane, butanes, and natural gasoline (condensate). The extraction of NGLs is crucial for hydrocarbon dew point control in natural gas streams, preventing the formation of a liquid phase during transport. Furthermore, NGLs hold substantial economic value as separate products, often surpassing their worth when mixed with natural gas (Kidney & Parrish, 2006). Lighter NGL fractions can be sold as fuel or as feedstock for petrochemical plants, while heavier fractions can be utilized as gasoline-blending stock (GPSA, 2004).
Natural gas directly from wells contains various NGLs, which are typically removed to enhance economic returns (Larson & Carl-Fredrik, 2021). The economic incentive to separate NGLs arises from their potential as high-value commodities in markets related to petrochemicals and pharmaceuticals (EIA, 2012). This underscores the importance of efficient NGL recovery processes in maximizing revenue streams in the natural gas industry.
Emerging technologies in extraction and processing, such as advancements in hydraulic fracturing for non-conventional resources and innovative NGL separation methods, are reshaping the industry. Additionally, while the increased use of natural gas offers environmental benefits, it also presents challenges that need to be addressed through new technologies and policies.
## II. METHODOLOGY
### a) Modelling Environment
The NGL recovery plant with recycling was modelled using the ASPEN HYSYS V8.6 simulation environment. The fluid package PENG-ROBINSON was chosen for the modelled process as recommended by the ASPEN tutorial manual. (Gayubo, 2000)
Unit Operations Needed
The Unit-operations needed for the complete modelling of the process are given below:
Expander, Valve, reboiled absorber, Tee, Cooler, Compressor, Heater, Recycle, Heat Exchanger (Zaixing, 2018).
Inlet Feed Conditions
The inlet conditions of the natural gas were modelled according to the following conditions listed in Table 1.
Table 1: Inlet Feed Conditions
<table><tr><td>Temperature [C]</td><td>-34</td></tr><tr><td>Pressure [kPa]</td><td>6000</td></tr><tr><td>Molar Flow [kgmole/h]</td><td>40000</td></tr></table>
The component fractions are listed below:
### b) Specifications in the Fractionating Column
The specifications for the fractionating column are listed in Figure 1 and Figure 2 they contain the no of trays in the column, the inlet stages, the outlet stages and top and bottom operating pressures.
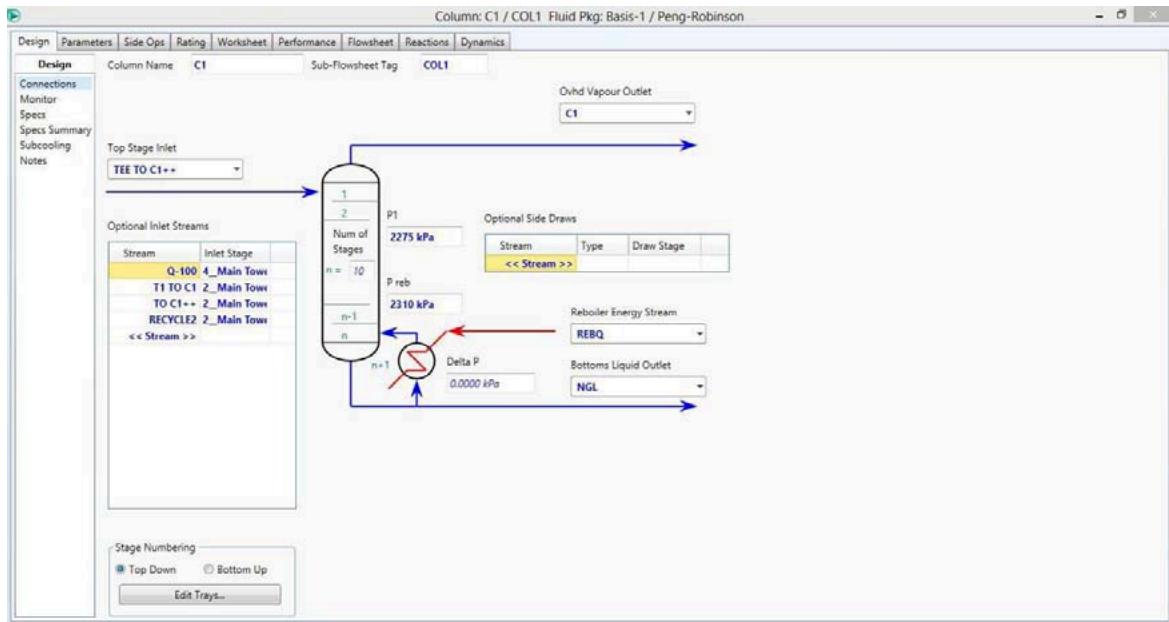
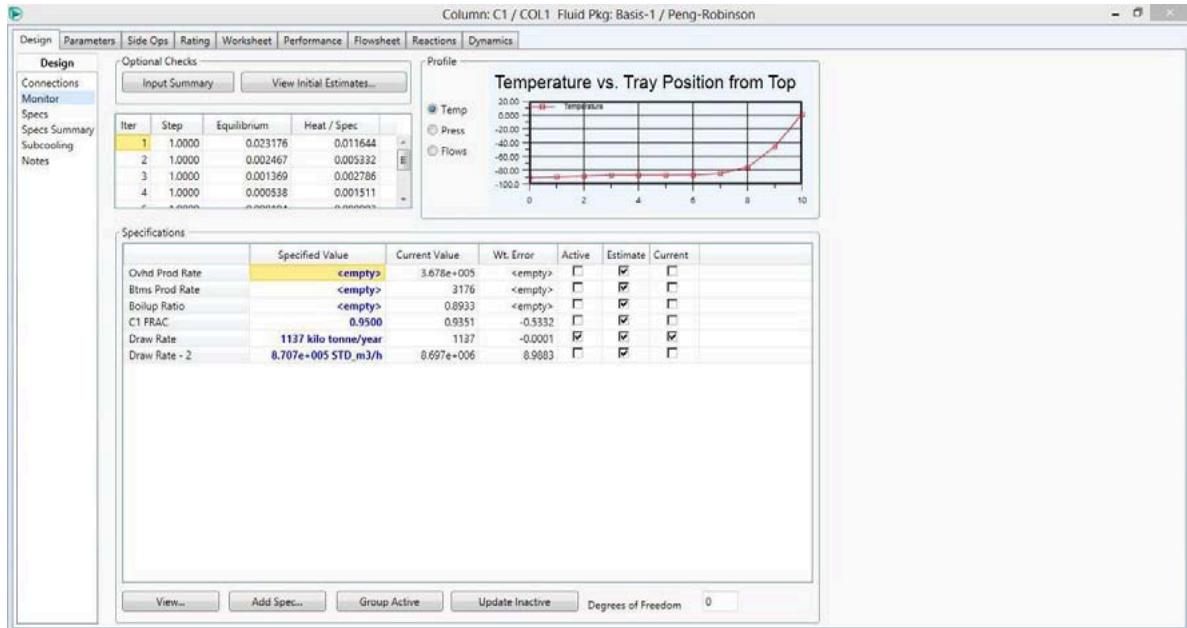 Figure 1: Column specifications 1
 Figure 2: Column specifications 2
### c) Sales Gas Compressor
The sales gas compressor was modeled as a one stage compressor for simplicity, under the conditions of different Adiabatic efficiencies ranging from $20\% - 75\%$, with the aim of observing the energy demand on the compressor with different recycling options (EIA, 2012.). The specifications of the sales gas are 6000kPa and 340C.
### d) Products Recycle
The overhead product of the column was sent to a Tee where it was split in two parts of the same composition; with splits starting at $5\% - 95\%$ recycled back into the column.
### e) Feed Inlet Trays
The inlet tray of the incoming natural gas was varied for a column with 10 trays, 20 trays and 30 trays. It would be determined by observing the inlet tray that gives us the maximum methane in the column overhead, minimum NGL in the column overhead, and Lower sales gas compressor power rating (Xinghe et al., 2018). The results from this analysis would be used in developing a model for easy prediction of the best feed tray position for this specific natural composition (Ghalambor, 2005)
## III. RESULTS AND DISCUSSION
### a) Result
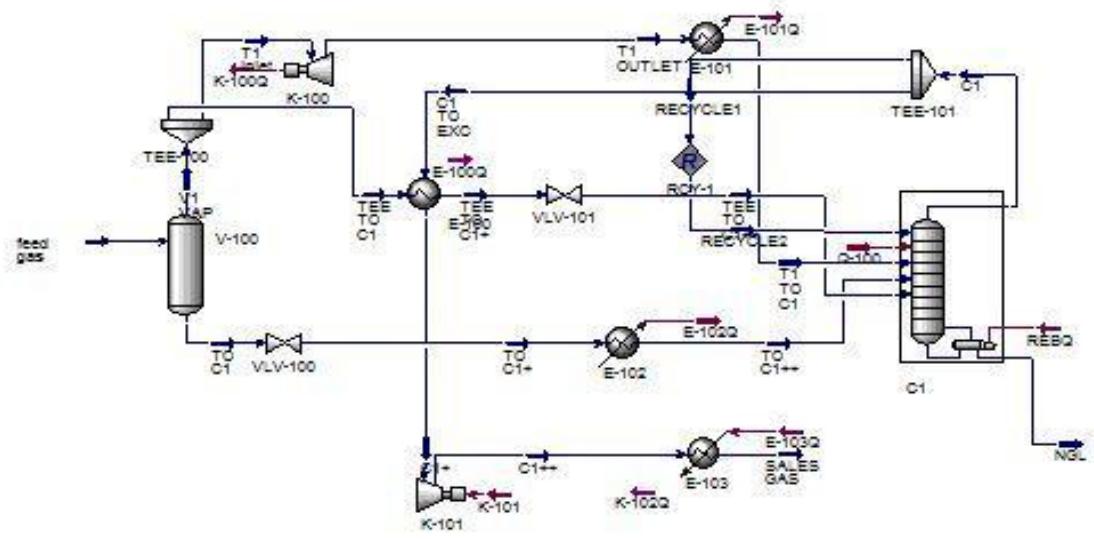 Figure 3: Complete NGL Recovery Plant
The incoming feed gas goes to a flash drum v-100, and the overhead vapour from the drum is then sent to a Tee feed splitter which split in equal proportions. one stream line from the feed splitter was sent to an expander to drop the pressure rapidly to achieve a corresponding drop in temperature and then sent to a cooler for further refrigeration and then sent to a column, and the other stream from the feed splitter is sent to a heat exchanger where the overhead product from the column is used for sub cooling it, and then sent to the separation column. The Bottom products of the flash drum is sent to a cooler and valve for further refrigeration and pressure drop and sent directly to the separation column. A stream containing mainly methane comes out of the column overhead.
### b) Effect of Product Recycle
The product recycle versus methane in overhead is shown in table 2 below.
Table 2: Product recycle vs. Methane in overhead
<table><tr><td>Products Recycle</td><td>Methane in Ovhead</td></tr><tr><td>0.0000</td><td>0.8887</td></tr><tr><td>0.0500</td><td>0.8883</td></tr><tr><td>0.1000</td><td>0.8880</td></tr><tr><td>0.2000</td><td>0.8872</td></tr><tr><td>0.3000</td><td>0.8865</td></tr><tr><td>0.4000</td><td>0.8858</td></tr><tr><td>0.5000</td><td>0.8851</td></tr><tr><td>0.6000</td><td>0.8849</td></tr><tr><td>0.7000</td><td>0.8841</td></tr><tr><td>0.8000</td><td>0.8845</td></tr><tr><td>0.9000</td><td>0.8854</td></tr><tr><td>0.9500</td><td>0.8852</td></tr></table>
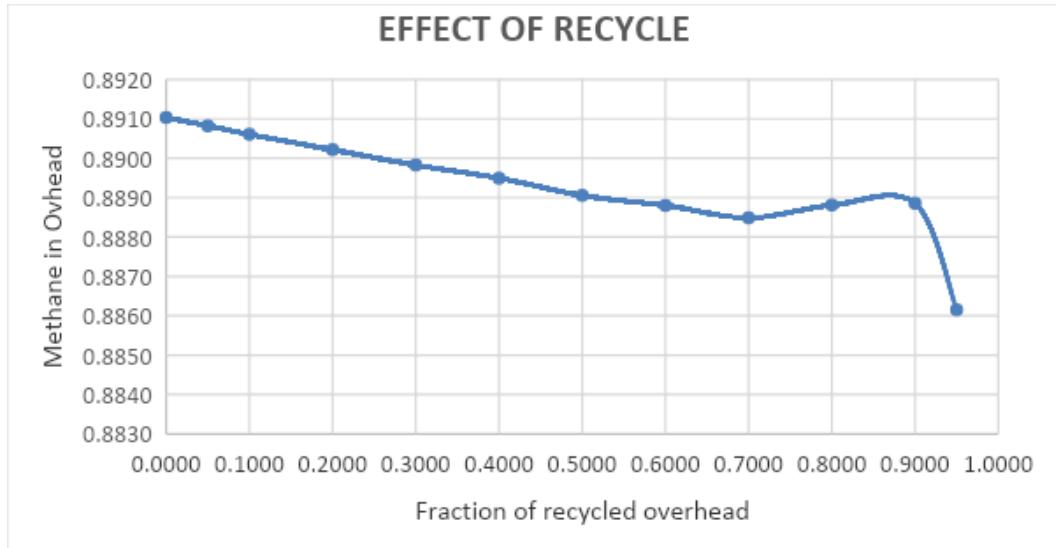 Figure 4: Graph Showing the Effect of Recycling on Methane Fraction in a Column Overhead
Feed Inlet Position:
Column with 10 Trays:
Table 3: Effect of tray position on methane fraction in column overhead and sales gas compressor power requirement for column with 10 tray
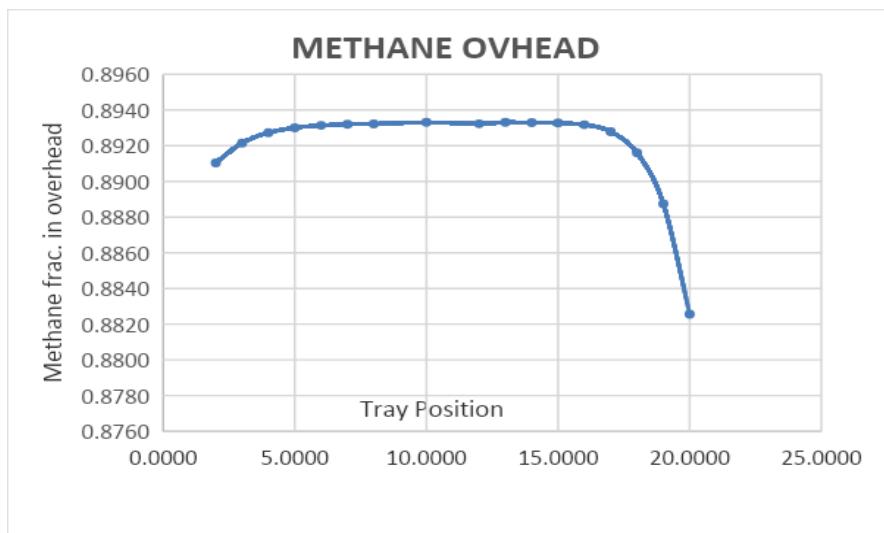
<table><tr><td>Tray</td><td>Methane in Overhead</td><td>Power Requirement of SG Comp</td></tr><tr><td>2.0000</td><td>0.8910</td><td>23261.2474</td></tr><tr><td>3</td><td>0.8921</td><td>23179.5078</td></tr><tr><td>4</td><td>0.8927</td><td>23152.3384</td></tr><tr><td>5</td><td>0.8930</td><td>23141.5127</td></tr><tr><td>6</td><td>0.8930</td><td>23139.9554</td></tr><tr><td>7</td><td>0.8927</td><td>23151.0407</td></tr><tr><td>8</td><td>0.8915</td><td>23193.7471</td></tr><tr><td>9</td><td>0.8887</td><td>23291.7624</td></tr><tr><td>10</td><td>0.8826</td><td>23489.5450</td></tr></table>
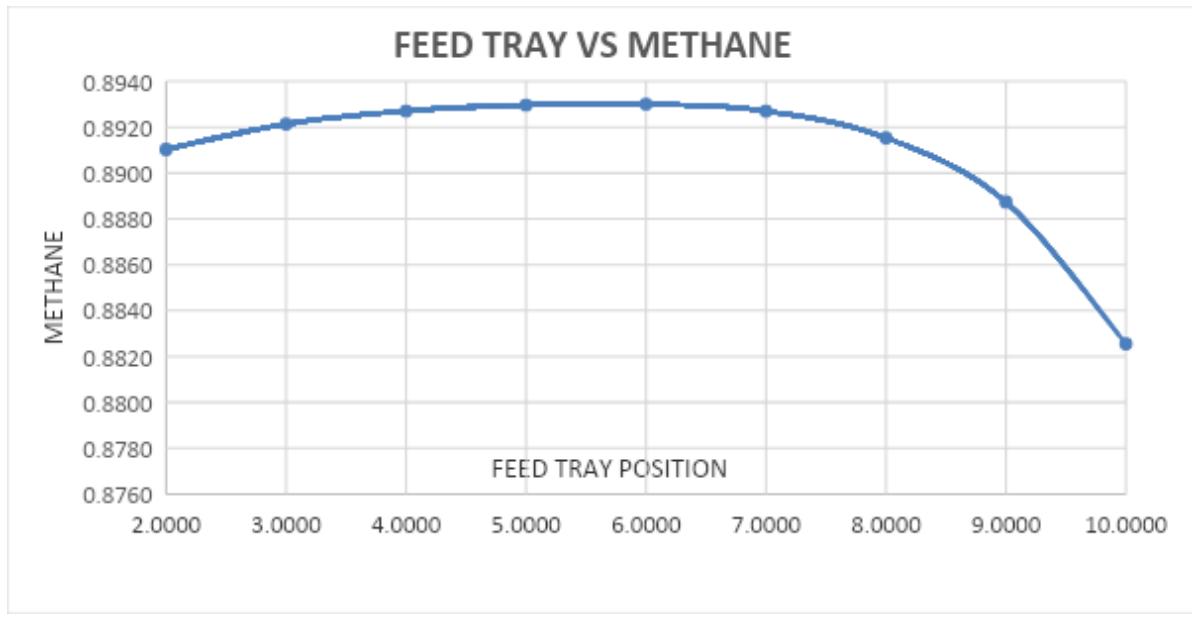 Figure 5: Feed tray vs. Methane in column overhead for column with 10 trays
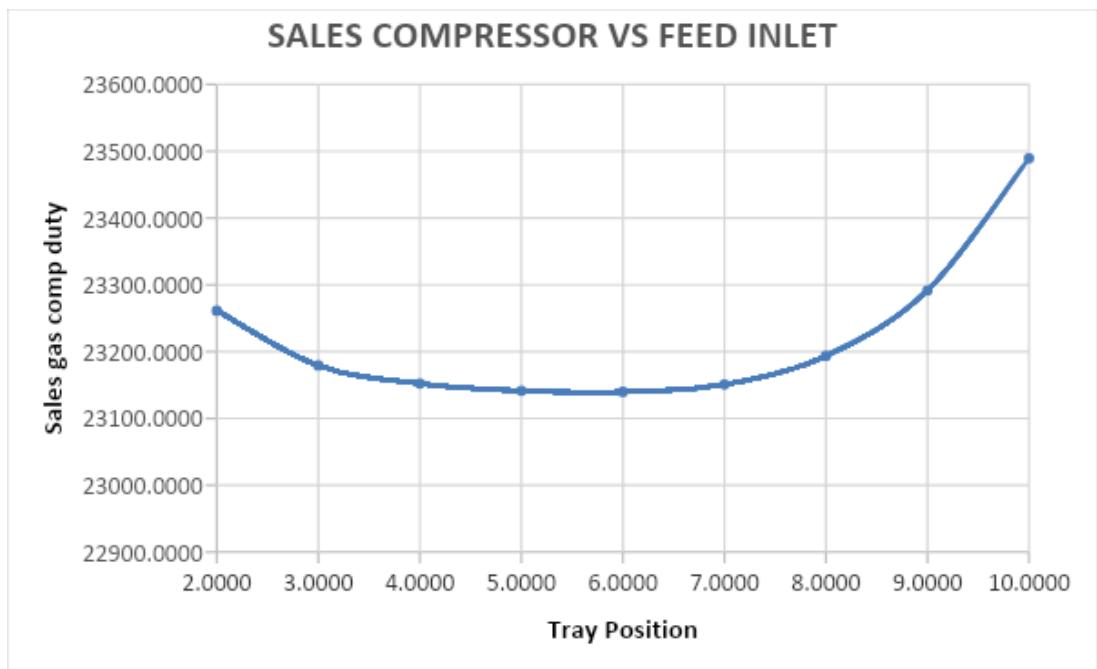 Figure 6: Feed tray vs. Sales gas compressor power requirement for column with 10 trays Column With 20 Trays


Table 4: Effect of tray position on methane fraction in column overhead, and sale gas compressor power requirement for column with 20 trays
<table><tr><td>Tray Postion</td><td>Methane</td><td>Power</td></tr><tr><td>2.0000</td><td>0.8910</td><td>23383.9375</td></tr><tr><td>3.0000</td><td>0.8921</td><td>23179.3346</td></tr><tr><td>4.0000</td><td>0.8927</td><td>23151.9647</td></tr><tr><td>5.0000</td><td>0.8930</td><td>23140.5291</td></tr><tr><td>6.0000</td><td>0.8931</td><td>23135.4195</td></tr><tr><td>7.0000</td><td>0.8932</td><td>23133.1497</td></tr><tr><td>8.0000</td><td>0.8932</td><td>23132.1299</td></tr><tr><td>10.0000</td><td>0.8933</td><td>23129.3333</td></tr><tr><td>12.0000</td><td>0.8932</td><td>23132.3115</td></tr><tr><td>13.0000</td><td>0.8933</td><td>23128.8161</td></tr><tr><td>14.0000</td><td>0.8933</td><td>23129.9213</td></tr><tr><td>15.0000</td><td>0.8933</td><td>23130.3923</td></tr><tr><td>16.0000</td><td>0.8932</td><td>23133.7765</td></tr><tr><td>17.0000</td><td>0.8928</td><td>23148.2351</td></tr><tr><td>18.0000</td><td>0.8916</td><td>23191.8348</td></tr><tr><td>19.0000</td><td>0.8887</td><td>23291.2662</td></tr><tr><td>20.0000</td><td>0.8826</td><td>23489.6270</td></tr></table>

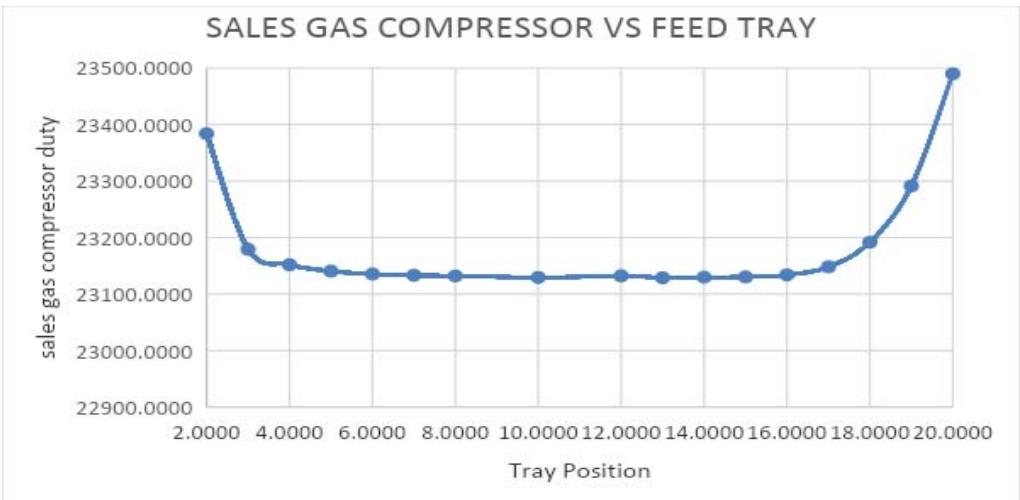 Figure 7: Feed tray vs. methane in column overhead for column with 20 trays
Table 5: Effect of tray position on methane fraction, NGL fraction in column overhead, and sales gas compressor power requirement for column with 30 trays.
<table><tr><td>Tray</td><td>Methane</td><td>Power</td></tr><tr><td>3</td><td>0.8922</td><td>23176.8016</td></tr><tr><td>4.0000</td><td>0.8928</td><td>23149.3691</td></tr><tr><td>10.0000</td><td>0.8933</td><td>23128.0054</td></tr><tr><td>15.0000</td><td>0.8933</td><td>23128.3660</td></tr><tr><td>20.0000</td><td>0.8933</td><td>23129.1485</td></tr><tr><td>30.0000</td><td>0.8825</td><td>23489.8744</td></tr></table>
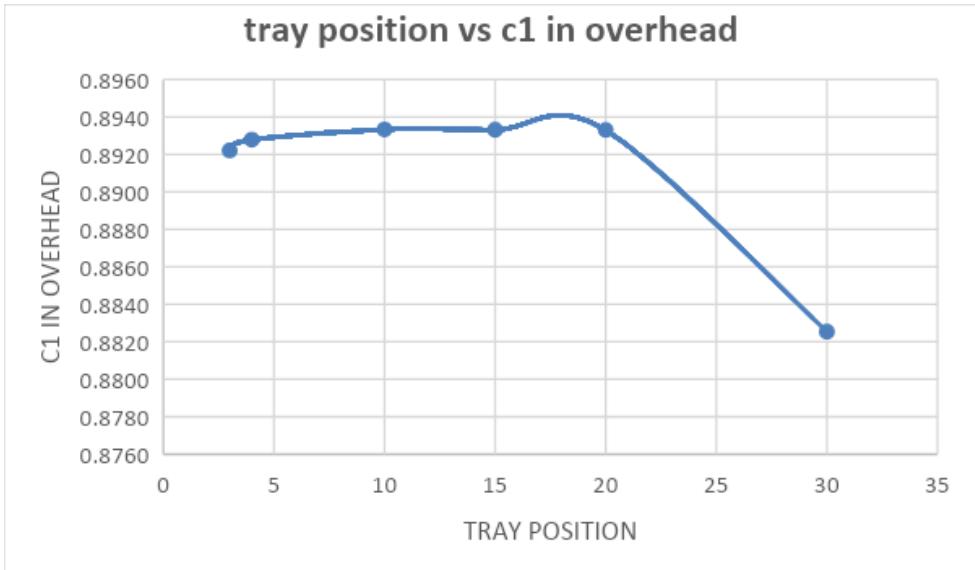 Figure 8: Feed trays vs. sale gas compressor power requirement for column with 20 trays Column with 30 Trays:
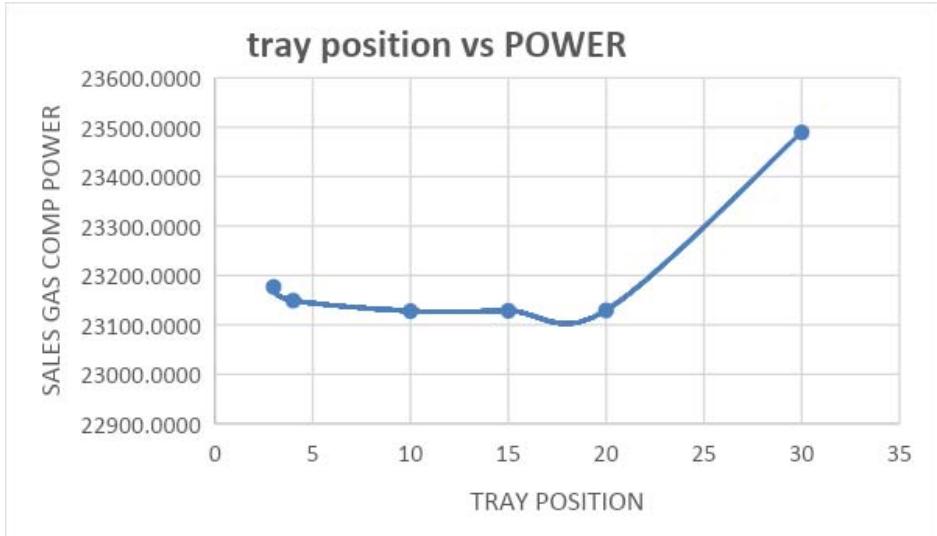 Figure 9: Feed trays vs. methane fraction in column overhead f or column with 30 trays
Optimum Feed Tray Position for Nth Number of Trays
Table 6: Optimum feed tray position for different number of trays
<table><tr><td>No Of Trays</td><td>Optimum Feed Tray Position</td><td>Methane Fraction In Column Overhead</td></tr><tr><td>10</td><td>6</td><td>0.8930</td></tr><tr><td>20</td><td>13</td><td>0.8933</td></tr><tr><td>30</td><td>18</td><td>0.8940</td></tr></table>
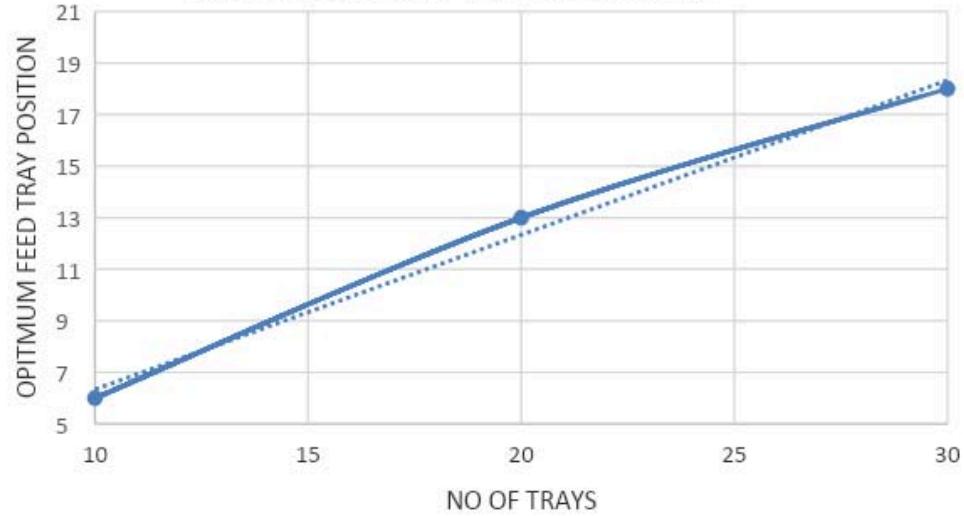 OPTIMUM FEED TRAY POSITION Figure 11: Graph showing optimum feed tray position for different number of trays
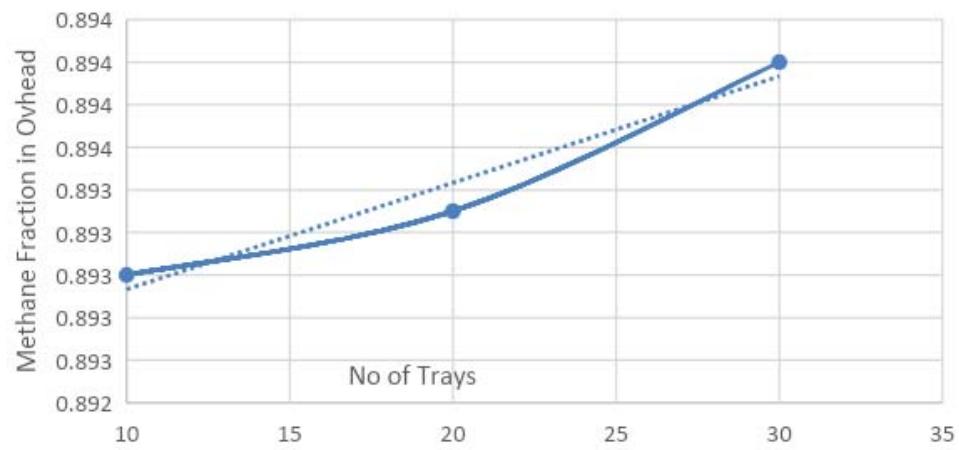 Methane fraction vs No of trays Figure 12: No of trays vs. methane fraction in the overhead
### c) Discussion
## i. Effect of Recycle on Methane Recovery
As illustrated in Figure 4 and Table 2, the methane fraction in the overhead is maximized at zero product recycle. With increasing product recycle, the methane recovery initially decreases, reaching a low point around $80\%$ recycle, before experiencing a resurgence at $90\%$ recycle. This behavior suggests
 Figure 10: Feed trays vs. Sale gas compressor power requirement for column with 30 trays

complex interactions within the separation process. At lower recycle rates, the presence of recycled products may dilute the concentration of methane, reducing overall recovery efficiency. However, at higher recycle rates, the increased concentration of lighter hydrocarbons in the recycled stream may enhance separation efficiency, leading to a peak in recovery. Understanding these dynamics is crucial for optimizing methane recovery in practical applications.
## ii. Optimum Feed Tray Position
Column with 10 Trays: From Figures 5, 6, and 11, it is evident that the 6th tray yields the maximum recovery of methane in the column overhead while also minimizing sales compressor power requirements. The recovery rises steadily until it peaks at the 6th tray, after which it declines. This indicates that maximum recovery does not linearly correlate with the overall recovery in the column overhead, highlighting the importance of selecting the optimal tray position based on specific operational parameters.
Column with 20 Trays: Figures 7 and 8 show that the 13th tray provides the optimal recovery of methane, coupled with minimal NGL overflow and the lowest compressor power requirement. The recovery rises to a continuous peak from trays 5 to 16, with the maximum occurring at tray 13. This again emphasizes that maximum recovery is not inversely proportional to overhead recovery, suggesting that other factors, such as tray efficiency and interactions within the column, must be considered.
Column with 30 Trays: In Figures 9 and 10, the 18th tray is identified as optimal for methane recovery and compressor power efficiency. The recovery pattern mirrors that of the previous columns, peaking at tray 18 before declining towards the final tray.
## iii. Optimum Feed Tray Position for Nth Number of Trays
Table 8 indicates that the fraction of methane in the overhead increases with the number of trays, suggesting that a higher tray count enhances methane recovery. A second-order polynomial mathematical model was developed to determine the optimum feed tray position based on the number of trays:
$$
y = - 0. 0 1 x ^ {2} + x - 3 (R ^ {2} = 1) \quad (E q u a t i o n 1)
$$
Where $x$ represents the number of trays, and $y$ represents the optimum feed tray position.
Additionally, another model predicts maximum methane recovery in the column overhead:
$$
y = 2 E - 0 6 x ^ {2} - 3 E - 0 5 x + 0. 8 9 3 1 \left(R ^ {2} = 1\right) \quad (E q u a t i o n 2)
$$
For calculating the minimum NGL fraction in the overhead, the following model was developed:
$$
y = 5 E - 0 7 x ^ {2} - 5 E - 0 5 x + 0. 0 3 5 2 \left(R ^ {2} = 1\right) \quad (E q u a t i o n 3)
$$
Where $X$ is the number of trays and $Y$ represents the fraction of NGL overhead.
## iv. Testing the Model
Assuming a desired methane mass fraction of $90\%$ in the overhead, calculations indicate that 67 trays are required for the desired separation, with the optimum feed tray position identified as the 19th tray using Equation 1.
## v. Critical Analysis and Economic Considerations
The findings highlight critical trade-offs in selecting specific tray positions and recycle rates. While maximizing methane recovery is essential, it is equally important to consider energy costs, equipment requirements, and operational stability. For instance, higher tray counts may improve recovery but could lead to increased operational costs and complexity.
Economic factors play a significant role in decision-making. Considerations such as energy costs, equipment investment, and operational expenses must be weighed against the benefits of enhanced recovery. A thorough sensitivity analysis could further demonstrate how varying parameters affect overall process efficiency and economic viability.
## vi. Implications of the Results
The results of this study on optimizing methane recovery from natural gas streams have several significant implications for both operational practices and theoretical frameworks in the industry.
Comparison to Expected Outcomes: The findings align well with industry expectations that increasing the number of trays enhances methane recovery. This is consistent with established principles in distillation and separation technology, where more trays typically allow for better mass transfer and separation efficiency. The observed maximum recovery at specific tray positions reinforces the importance of precise engineering in design.
Industry Benchmarks: The requirement of 67 trays for achieving $90\%$ methane recovery with the optimum feed tray position at tray 19 compares favorably to industry benchmarks. Many existing natural gas processing facilities operate with similar tray counts, but the specific selection of tray positions and the focus on recycling effects are innovations that could lead to improved efficiencies. These results can serve as a reference point for other facilities aiming to enhance recovery rates.
Notable Trends: A notable trend observed is the initial decrease in methane recovery with increased recycle rates, followed by a resurgence at higher rates. This counterintuitive behavior suggests complex interactions within the separation process that merit further investigation. Understanding this trend can help operators fine-tune recycle strategies to maximize recovery without incurring excessive energy costs.
Anomalies and Insights: While the overall findings are consistent with theoretical expectations, the specific peaks in recovery at certain recycle rates (80% and 90%) may indicate anomalies that warrant deeper analysis. Such variations could arise from specific interactions between recycled products and the feed gas, potentially leading to enhanced separation efficiency under certain conditions. Identifying the underlying mechanisms for these peaks could provide valuable insights for optimizing operational strategies.
Operational and Economic Implications: The results suggest that careful selection of tray configurations and recycle strategies can lead to significant operational efficiencies and cost savings. By maximizing methane recovery and minimizing NGL losses, operators can enhance the economic viability of their processes. These insights can guide decisions on equipment design and operational protocols, ultimately leading to more sustainable and profitable natural gas processing.
Recommendations for Practice: Operators in the field should consider implementing the study's findings in their operational strategies, particularly regarding tray selection and recycle management. Additionally, further research into the dynamics of recycle interactions and their impact on recovery efficiency could lead to even greater enhancements in process design.
## vii. Effectiveness of the Process
The effectiveness of the optimized methane recovery process demonstrates a solid framework for enhancing natural gas separation. The results indicate that the strategic selection of tray configurations and recycle rates can significantly improve methane recovery, achieving up to $90\%$ with 67 trays and the optimum feed tray positioned at tray 19. This level of recovery is commendable and aligns well with industry benchmarks, suggesting that the process is both viable and efficient.
### d) Potential Improvements and Alternative Methods
#### Use of Different Types of Expanders:
Integrating different types of expanders, such as turbo-expanders or mechanical expanders, could enhance the overall process by recovering energy from high-pressure gas streams. This energy recovery can reduce the energy consumption of the system, leading to lower operational costs and improved efficiency.
#### Advanced Cooling Techniques:
Implementing advanced cooling methods, such as cryogenic cooling or heat exchangers with enhanced heat transfer surfaces, could improve the separation efficiency. This would facilitate better temperature management within the column, ensuring optimal conditions for methane recovery and potentially increasing the overall yield of NGLs.
#### Alternative Separation Technologies:
Exploring alternative separation methods, such as membrane separation or adsorption techniques, might provide additional pathways for improving recovery rates and reducing costs. These technologies can sometimes operate under milder conditions and may offer better selectivity for desired components.
#### Process Intensification:
Employing process intensification strategies, such as combining multiple separation processes (e.g., distillation followed by membrane separation), could lead to improved efficiency and reduced footprint. This approach may enhance overall recovery rates while lowering energy consumption.
### e) Challenges and Limitations
#### Operational Complexity:
One challenge encountered is the operational complexity associated with optimizing tray configurations and managing recycle rates. The interactions between these variables can lead to nonlinear performance outcomes, making it difficult to predict optimal conditions reliably.
#### 1. Data Variability
Variability in feed gas composition can affect the performance of the separation process. This variability requires continuous monitoring and adjustment, which can be resource-intensive.
#### 2. Energy Consumption
Although the optimized configurations enhance recovery, they may also lead to increased energy consumption, particularly in systems with high tray counts. This can impact the overall economic viability of the process.
#### Mitigation Strategies:
#### 1. Enhanced Process Control
Implementing advanced process control systems and real-time monitoring can help mitigate operational complexity. These systems can dynamically adjust parameters based on feed composition and performance metrics, ensuring optimal conditions are maintained.
#### 2. Robust Modeling and Simulation
Developing more robust models that account for variations in feed composition and operational conditions can improve predictability. Simulation tools can aid in understanding the impact of different configurations and assist in decision-making.
#### 3. Energy Efficiency Audits
Conducting regular energy efficiency audits can identify areas for improvement in energy consumption.
Implementing energy recovery technologies can offset some of the energy demands of the system.
#### 4. Future Research Directions
Future work could focus on exploring the combined use of different separation technologies and their integration into existing processes. Investigating the effects of alternative feed compositions and operational strategies will also be crucial for enhancing the robustness of the process.
## IV. CONCLUSION
The results from this work provide a framework for predicting the number of trays required for the desired separation of methane and for determining the optimum feed tray position for the specified natural gas composition. The findings indicate that the methane fraction increases with the number of trays, demonstrating the importance of tray configuration in the separation process.
Several models were developed to calculate the optimum feed tray location for any given number of trays, as well as the percentage of methane in the column overhead. These models were validated by testing their performance in achieving $90\%$ methane recovery, resulting in a requirement of 67 trays to achieve the desired separation, with tray 19 identified as the optimum feed tray location. This specific number of trays and tray position were influenced by factors such as separation efficiency and energy requirements, aligning with industry standards for effective natural gas processing.
The implications of these findings for the natural gas industry are significant. By optimizing tray positions and configurations, operators can enhance the efficiency of separation columns, leading to improved recovery rates and reduced operational costs. Practitioners are encouraged to consider these models when designing or modifying natural gas processing systems to maximize methane recovery.
Future work could explore the integration of these models with real-time operational data to further refine their accuracy and reliability. Additionally, investigating the impact of varying feed gas compositions and operating conditions on tray performance could provide further insights into optimizing natural gas separation processes.
Overall, this study contributes valuable knowledge to the field of natural gas processing and highlights the potential for improved efficiencies through careful design and operational strategies.
## V. RECOMMENDATION
To enhance methane recovery from natural gas streams, it is recommended to implement the developed mathematical models for optimizing tray configurations and operational strategies. Conducting pilot studies to
Validating these models under real conditions is essential, along with establishing routine performance monitoring for key indicators. Exploring advanced technologies such as membrane separation and providing training for operational staff on the significance of tray selection and recycle rates will further improve efficiency. Additionally, a comprehensive economic analysis should evaluate the cost-benefit ratio of optimized configurations, while future research should focus on the impacts of varying feed compositions and environmental considerations. Collaborating with industry partners to share findings will help develop best practices and standards in natural gas processing.
Generating HTML Viewer...
References
14 Cites in Article
A Gayubo,J (2000). Unknown Title.
H Aal,M Eggour,M Fahim (2003). Petroleum and gas field processing.
H Abdel-Aal,A Mohamed (2003). Petroluem and Gas field Processing.
B Alireza (2014). Natural Gas Processing; Technology and Engineering Design.
Alireza Bahadori (2014). Basic Engineering Design for Natural Gas Processing Projects.
(2004). Engineering databook.
G Ghalambor (2005). Natural Gas Engineering Handbook.
Boyun Guo,William Lyons,Ali Ghalambor (2007). Petroleum Production System.
C Ikoku (1992). Natural Gas Production Engineering.
Israel Aye,Laura Chigozie,A,Constance (2015). Oil and Gas Environmental Dispute Resolution in Nigeria.
Arthur Kidnay,Arthur Kidnay,William Parrish (2006). Fundamentals of Natural Gas Processing.
D Larsson,Carl-Fredrik Flach (2021). Antibiotic resistance in the environment.
Saeid Mokhatab (2006). Acknowledgments.
D Peyerl,S Figueirôa (2016). Black Gold: Discussions on the Origin, Exploratory Techniques, and Uses of Petroleum in Brazil.
No ethics committee approval was required for this article type.
Data Availability
Not applicable for this article.
How to Cite This Article
Ifeanyi Eddy Okoh. 2026. \u201cOptimizing Methane Recovery from Natural Gas Streams: Insights from Aspens Hysis Simulation\u201d. Global Journal of Research in Engineering - C: Chemical Engineering GJRE-C Volume 24 (GJRE Volume 24 Issue C1): .
Explore published articles in an immersive Augmented Reality environment. Our platform converts research papers into interactive 3D books, allowing readers to view and interact with content using AR and VR compatible devices.
Your published article is automatically converted into a realistic 3D book. Flip through pages and read research papers in a more engaging and interactive format.
This study utilized the Aspen HYSYS Simulator Version 8.6 to simulate plant operations and optimize natural gas recovery using Technip’s feed gas composition. The focus was on investigating the effects of product recycling and determining the optimal feed tray position within the distillation column. Technip’s feed gas composition was selected due to its relevance in realworld applications, influencing the efficiency of methane recovery. The results indicated that maximum methane recovery occurred with zero product recycling and increasing the number of trays significantly enhanced methane recovery in the column overhead. Specifically, the analysis revealed a direct correlation between the number of trays and methane recovery efficiency. To support these findings, mathematical models were developed: one for predicting the optimal feed tray position represented as y=-0.01×2 +x-3y=-0.01×2+x-3, and two models for calculating the required number of trays for desired fractions of methane and natural gas liquids (NGLs) in the overhead.
Our website is actively being updated, and changes may occur frequently. Please clear your browser cache if needed. For feedback or error reporting, please email [email protected]
Thank you for connecting with us. We will respond to you shortly.