

I. INTRODUCTION
Palestine Radar Model (PRM) for predicting the number of infected cases of COVID-19 virus is a computerized model that can predict the number of the infected cases of COVID-19 virus in Palestine for any date starting from (1) April of 2020. This model is designed by using the Microsoft Office
Excel program. The results will be obtained directly after running the model; these results can help the Palestinian government, leadership and people with the expected development related to the expected number of infected cases of the COVID-19 virus in the coming days.
This study shows the expected number of the infected cases of COVID-19 virus in Palestine for the coming April month. The results are recorded, and they can put the Palestinian government, leadership and people in the light of the expected future.
II. A MISSION & BENEFITS OF PALESTINE RADAR MODEL
Palestine Radar Model (PRM) can help Palestine towards stopping the spread of COVID-19 virus by giving the expected numbers of future infected cases, as follows:
Firstly, For Palestine government and leadership:
Knowing the expected number of the future infected cases of COVID-19, will help the Palestine government and leadership how to manage the pandemic awesomely and with minimum loss by making suitable decisions and actions, especially that Palestine government has preferred using the prevention strategy that is based on (social spacing theory) before using the treatment strategy [2],[4]. These decisions and actions may include the following:
a) Continuing on emergency case with its all directions in Palestine lands.
b) Developing a more hard emergency case.
c) Continuing on people and society culture rising towards stopping the spread of COVID-19 virus in Palestine.
d) Ensuring the power of Palestine medical infrastructure for facing the coming future.
Secondly, For Palestine People and Society:
By applying the previous actions and decisions from the Palestine government and leadership, the safety of people and society will be increased as far as the more commitment and discipline from them.
III. STUDY METHODOLOGY
This study is theoretical and experimental research; it uses the linear prediction technique in the Microsoft Office Excel program by using the (Forecast Function) that is included in the statistical category of Microsoft Office Excel program library [9],[11].
In the Microsoft Office Excel Program, there are two familiar methods to implement the linear prediction, which are [9],[11],[12]:
a) Using the (Forecast) statistical function
Here, the linear prediction will be implemented directly. Since the (Forecast) statistical function is readily available in the Microsoft Office Excel program library. It can be used directly when all historical data are enough and ready.
b) Using the regression line equation
Here, the linear prediction will be implemented after finding the regression line equation, which is:
Where:
Y: The dependent variable. a: Regression coefficient.
X: The independent variable. b: The constant parameter.
So, the implementing of the linear predication in this method requires the following procedure:
Firstly, the finding of both parameters: the regression coefficient (a) and the constant (b) as follows:
The regression coefficient (a) can be obtained directly by using (Slope Function) that is included in the statistical category of Microsoft Office Excel program library. Also, the constant (b) can be obtained directly by using (Intercept Function) that is included in the statistical category of Microsoft Office Excel program library.
Secondly, writing the previous regression line equation. Thirdly, divide all historical data to be either independent variables or dependent variables and determine them.
This study uses the forecast statistical function method to implement the linear prediction, which will increase the efficiency of the study model, since it will save time and effort in using this model, by avoiding the use of regression line equation in the Microsoft Office Excel program which requires more time and effort due to its long procedure.
IV. How Does the Model Work?
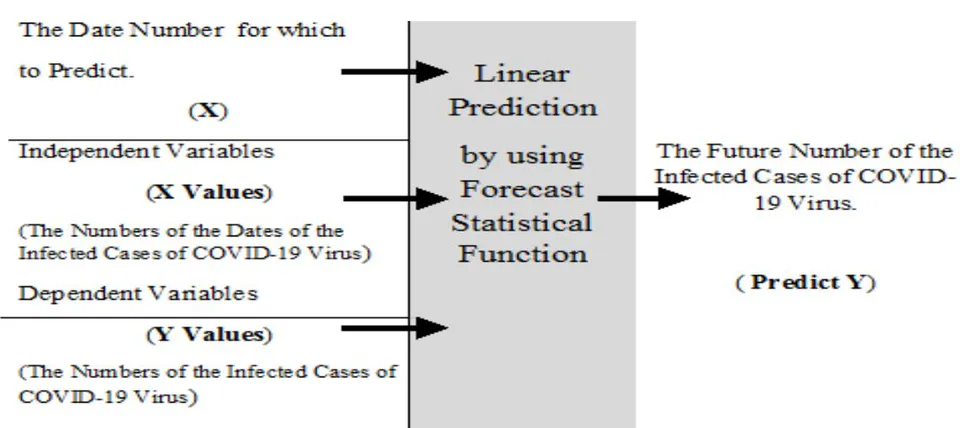
The Palestine Radar Model (PRM) uses the linear predication by using the (Forecast Function) that is categorized under Excel statistical functions. It will calculate and predict future values using existing historical values.
The Palestine Radar Model (PRM) uses the previous numbers of infected cases of COVID-19 with their dates in Palestine starting from the beginning of the (5 March 2020) to the end of (31 March 2020), as its historical data[3],[4].
The sequential numbers of the dates are used as independent variables (X Values), and the numbers of the infected cases corresponding to these dates, as dependent variables (Y Values).
Now, (PRM) can predict the future values of the infected cases of COVID-19 virus for future dates, by entering the corresponding numbers of these dates. The results will appear immediately. The following figure shows the (PRM):
V. RESULTS ACCURACY
The accuracy of the model results which are the expected numbers of the infected cases of COVID-19 virus in Palestine for the coming dates depends on the accuracy of input data of the model.
The input data of the model which are the historical numbers of the infected cases from the beginning of the (5 March 2020) to the end of (31 March 2020) and their corresponding dates are being recorded accurately according to the daily reports of the Palestine Ministry of Health [4].
So, this study expects accurate results with a surely normal percentage of error which comes from prediction.
VI. DESIGNING THE MODEL
The Palestine Radar Model (PRM) is designed by using Microsoft Office Excel Program. The model includes two main sections, as follows:
The first section is the (Input Section) which includes the following parameters:
a) The historical dates from the beginning of the (5 March 2020) to the end of (31 March 2020).
b) The corresponding sequential numbers of the previous dates.
c) The historical numbers of the infected cases from the beginning of the (5 March 2020) to the end of (31 March 2020).
The following figure shows the input section of the model design [1], [2], [4]: Figure 2: The First Section of the Model Design
| A | B | C | |
| 1 | Palestine Radar Model for Predicting the Number of Infected Cases of COVID-19 Virus | ||
| 2 | |||
| 3 | The Date | Number | The Number of Infected Cases of COVID-19 Virus |
| 4 | 5/3/2020 | 1 | 7 |
| 5 | 6/3/2020 | 2 | 7 |
| 6 | 7/3/2020 | 3 | 16 |
| 7 | 8/3/2020 | 4 | 19 |
| 8 | 9/3/2020 | 5 | 27 |
| 9 | 10/3/2020 | 6 | 27 |
| 10 | 11/3/2020 | 7 | 30 |
| 11 | 12/3/2020 | 8 | 31 |
| 12 | 13/3/2020 | 9 | 35 |
| 13 | 14/3/2020 | 10 | 38 |
| 14 | 15/3/2020 | 11 | 38 |
| 15 | 16/3/2020 | 12 | 39 |
| 16 | 17/3/2020 | 13 | 41 |
| 17 | 18/3/2020 | 14 | 44 |
| 18 | 19/3/2020 | 15 | 47 |
| 19 | 20/3/2020 | 16 | 48 |
| 20 | 21/3/2020 | 17 | 52 |
| 21 | 22/3/2020 | 18 | 59 |
| 22 | 23/3/2020 | 19 | 59 |
| 23 | 24/3/2020 | 20 | 60 |
| 24 | 25/3/2020 | 21 | 62 |
| 25 | 26/3/2020 | 22 | 86 |
| 26 | 27/3/2020 | 23 | 91 |
| 27 | 28/3/2020 | 24 | 97 |
| 28 | 29/3/2020 | 25 | 108 |
| 29 | 30/3/2020 | 26 | 116 |
| 30 | 31/3/2020 | 27 | 117 |
The second section is the (Output Section) which includes the expected numbers of the infected cases of COVID-19 virus in Palestine for future dates.
The study uses the model for predicting the infected cases of COVID-19 virus in Palestine for coming
The following figure shows the output section of the model design: Figure 3: The Second Section of the Model Design
| A | B | C | |
| 32 | (The Predicting Results for the Coming April Month) | ||
| 33 | The Date | The Number of Predicted Infected Cases of COVID-19 Virus | |
| 34 | 4/4/2020 | (??) Predicted Infected Cases | |
| 35 | |||
| 36 | 12/4/2020 | (??) Predicted Infected Cases | |
| 37 | |||
| 38 | 19/4/2020 | (??) Predicted Infected Cases | |
| 39 | |||
| 40 | 30/4/2020 | (??) Predicted Infected Cases | |
| 41 | |||
| 42 | |||
| 43 | (GOD Save our Home) | ||
| 44 | |||
Now, at each previous date, the study will use the Forecast statistical function, to find the predict number of the infected cases of COVID-19 in Palestine.
VII. OPERATING THE MODEL
At each previous date to predict (4/4/2020, 12/4/2020, 19/4/2020, 30/4/2020), the study will use the
Forecast statistical function, to find the predict number of the infected cases of COVID-19 in Palestine. The Excel window of the Forecast statistical function is as follows:
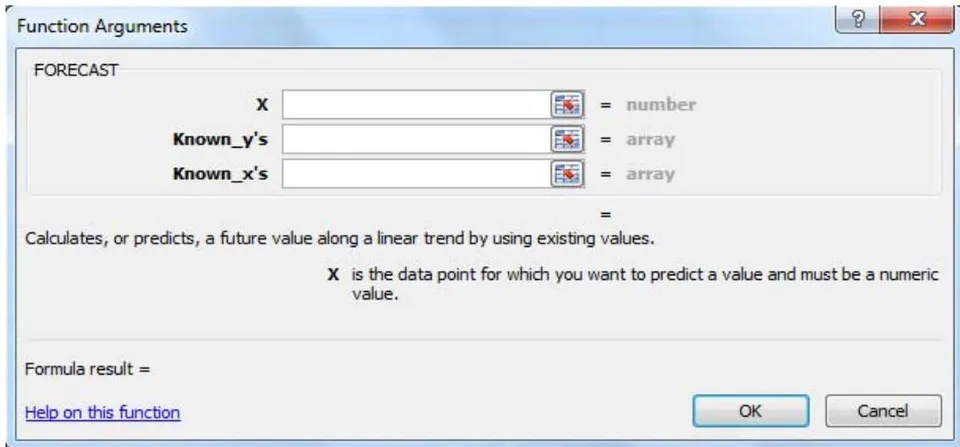
The entered data on the previous figure (4), are as follows:
X: The sequential number of the date for which to predict.
Y's: The numbers of the infected cases of the COVID-19 virus, which are the model-dependent variables.
X's: The sequential numbers of the dates of the infected cases of the COVID-19 virus, which are the model-independent variables.
Now, for the dates that the model looking to predict for them, the entered data of the Forecast function will be as follows:
| Dates to Predict | X | Y's | X's |
| 4/4/2020 | 31 | C4:C30 | B4:B30 |
| 12/4/2020 | 39 | C4:C30 | B4:B30 |
| 19/4/2020 | 46 | C4:C30 | B4:B30 |
| 30/4/2020 | 57 | C4:C30 | B4:B30 |
VIII. THE RESULTS After running the model, the results that are related to the expected numbers of the infected cases of COVID-19 virus in Palestine are as follows:
| A | B | C | |
| 32 | (The Predicting Results for the Coming April Month) | ||
| 33 | The Date | The Number of Predicted Infected Cases of COVID-19 Virus | |
| 34 | 4/4/2020 | 116.7130647(117) Predected Infected Cases | |
| 35 | |||
| 36 | 12/4/2020 | 147.2185592(147) Predected Infected Cases | |
| 37 | |||
| 38 | 19/4/2020 | 173.9108669(174) Predected Infected Cases | |
| 39 | |||
| 40 | 30/4/2020 | 215.8559219(216) Predected Infected Cases | |
| 41 | |||
| 42 | |||
| 43 | (GOD Save our Home) | ||
| 44 | |||
IX. RESULTS ANALYSIS
According to the model results which are shown in the previous figure (5), there is a negative side and also a positive side, as follows:
a) The Negative Side of the Results
As it is shown to the results in the figure (5), there is an increase for the expected numbers of the infected cases of COVID-19 virus in Palestine during the coming April. The expected number of the infected cases of COVID-19 virus in Palestine till to the end of 30 April 2020 is expected to reach to (216) infected case.
Now,
b) The Positive Side of the Results
As it is shown in whole study, from the beginning of 5 March 2020 to the end of 30 April 2020, there is a decrease for the (Growth Rate) of spreading the COVID-19 virus in Palestine by more than (15%).
i. Finding the (Growth Rate) of the Study
a. The historical data of the number of infected cases of COVID-19 virus in Palestine from the beginning of (5 March 2020) to the end of (31 March 2020) is: (117) infected cases. So, in (26) days of past March 2020, the number of infected cases is: (117).
b. The predicted data of the number of infected cases of COVID-19 virus in Palestine from the beginning ( April 2020) to the end of ( April 2020) is: (216 – 117) = (99) infected cases.
So, in (26) days of the coming April 2020, the number of infected cases is: (70).
So, previous calculations are concluded in the following table:
| Historical Data | Predicted Data | |
| Number of Days | 26 | 26 |
| Number of Infected Cases | 117 | 99 |
Therefore, the Growth Rate of spreading COVID-19 virus in Palestine is implemented by the following mathematical equation:
| Predicted | Number of Infected Cases -Historical Number of Infected Cases |
| Historical Number of Infected Cases | |
| ......eqn (4) | |
| = (99 - 117)/117 = (-0.1538) | |
And this means that the Growth Rate of spreading COVID-19 virus in Palestine for the coming (4) weeks will decrease by more than (15%).
X. CONCLUSION AND RECOMMENDATIONS
a) Conclusion
Palestine Radar Model (RPM) predicts the spreading of COVID-19 virus in Palestine for the coming
April 2020 that is ended in the following dates respectively: (4/4/2020, 12/4/2020, 19/4/2020, 30/4/2020), with two contradictory results as follows:
The bad results: there is an increase in the expected numbers of the infected cases of COVID-19 virus in Palestine during the coming April 2020. The expected number of the infected cases of COVID-19 virus in Palestine till to the end of 30 April 2020 is expected to reach to (216) infected case.
The good results: there is a decrease for the (Growth Rate) of spreading the COVID-19 virus in Palestine by more than (15%) till to the end of 30th April 2020. The study refers that for the awesome emergency case that the Palestinian government and leadership have applied on Palestine, which adopts the preventing strategy before treatment strategy, by applying the theory of social spacing through closing the schools and universities, limiting motion, asking people strongly for home-stay, Isolating the cities and towns, stopping the tourism activities, and closing the borders. In addition to the ongoing awareness activities for people and society about COVID-19 virus through the various media and also and the social media.
b) Recommendations
This study presents the following recommendations for Palestinian government and leadership and also for the society and people:
The study strongly asks from the Palestinian government and leadership to continue in applying the case of emergency in Palestine for the coming April 2020.
Ensuring from the ready of Palestine medical infrastructure to deal with the expected numbers of infected cases that this study predicts for the coming April 2020, especially, that the expected number of infected cases that is predicted by the study model is: (216) infected cases.
Activate and develop more awareness activities about preventing COVID-19 virus for society and people from the specialized sides of the government, especially after the success of the emergency case that has launched by Palestine government which may reduce the growth rate of spreading the COVID-19 virus by more than (15%) according to the results of this study, and which means the receding of the virus instead of the spreading it more.
The development of the emergency case to be stronger is better.
Asking society and people for more commitment towards Palestine leadership instructions and advises.