
I. INTRODUCTION
Survival analysis is a statistical method for data analysis where the length of time, corresponds to the time period from a well-defined start time until the occurrence of some particular event or endpoint , i.e. , Ata and Sozer (2007). It is a common outcome measure in medical studies for relating treatment effects to the survival time of the patients. In these cases, the typical start time is when the patient first received the treatment, and the end point is when the patient died or was lost to follow-up. These developments have led to the introduction of several new extensions to the original model. However the Cox PH model may not be appropriate in many situations and other modifications such as stratified Cox model or Cox model with time-dependent variables can be used for the analysis of survival data. The AFT model is another alternative method for the analysis of survival data. Hence, the importance is to compare the performance of the Cox models and the AFT models. This will be studied by means of real dataset which is from a cohort of TB/HIV co-infected patients managed in tertiary Directly Observed Treatment Short (DOTS)
Course centre for a period of six months among the Nigerian adults.
Cox regression model in the presence of non-proportional hazards was considered by Ata and Sozer (2007). They worked on alternative different models in the violation of proportional assumption. They analysed the treatment and prognosis effects with censored and survival data, makes the assumption of constant hazard ratio. David (2014) produced data for the simulation experiments that mimic the types of data structures applied researchers encounter when using longitudinal biomedical data. Validity was assessed by a set of simulation experiments and results indicate that a non-proportional hazard model performs well in the phase of violated assumption of the Cox proportional hazards. Jiezhi (2009) compared the proportional hazards (PH) model and parametric AFT models. The major aims of his work was to support the argument for consideration of AFT model as an alternative to the PH model in the analysis of survival data by means of real life data from TB and HIV in Uganda. There are two advantages of Cox proportional regression models, which are ability to incorporate time varying covariate effects and time-varying covariates (Cox, 1972). Ogungbola et al (2018) there research established that the model provides a better description of the dataset because it allows prediction of Hazard function, survival functions as well as time ratio. The result revealed that the Weibull model provided a better fit to the studied data. Hence, it is better for researchers of TB/HIV co-infection to consider AFT model even if the proportionality assumption is satisfied. Kazeem et al (2015) considered the application of survival analysis has extended the importance of statistical methods for time to event data that incorporate time dependent covariates. The Cox proportional hazards model is one such method that is widely used. An extension of the Cox model with time-dependent covariates was adopted when proportionality assumption are violated. The purpose of this study is to validate the model assumption when hazard rate varies with time. This approach is applied to model data on duration of infertility subject to time varying covariate. Validity is assessed by a set of simulation experiments and results indicate that a non-proportional hazard model performs well in the phase of violated assumptions of the Cox proportional hazards. Lindsay (2004) cameup with the Cox Regression Model to deal handle failure time data. Ayman (2012) established that the estimation of the parameters in Cox proportional hazard is presented by using Bayes methods based on Markov Chain Monte Carlo (MCMC) algorithm and duplicate the results using non-Bayes framework. Person (2002) compared the hazard ratio estimated from the Cox model to an exact calculation of the geometric average of hazard ratio when the underlying assumption of proportional hazard is false. He studied the effects of covariate measurement error on testing the assumption of proportional hazards is investigated. John et al (2006) observed prospective cohort study of 168 adult patients enrolled at diagnosis of ALI in 21 adult Intensive Care Unit (ICUs) in three Australian states with measurement of survival time, censored at 28 days. Cox model with time-varying covariates remains a flexible model in survival analysis of patients with acute severe illness. Schke (2004) presented some development that dealt with time varying effect of covariates. He also emphasized the use of semi-parametric models where some effects are time-varying and some are time-constant, thus giving the extended flexibility only for effects where a simple description is not possible. Time-varying effects may be modelled completely nonparametrically by a general intensity model, . Smoothing techniques have been suggested for estimation of ; see, e.g., Nielson and Linton (1995) and the references therein. Such a model may be useful when the number of covariates is small compared to the amount of data, but the generality of the model makes it difficult to get a clear, if any, conclusion about covariate effects. Yuanxin (2013) built up a Cox proportional hazards model by survival analysis using the SAS statistical package. To process the analysis, the proportional assumption or time dependence for individual factors is tested; variables are selected; and their interactions are considered to optimize the model. Due to strikingly impact of gender on the prediction, it is stratified. Therefore different baseline hazards are applied for the set of variables within each group. In the model, the parameters are estimated by maximum likelihood Newton-Raphson algorithm. The results show that gender, status of diabetes, age, body mass index, cholesterol and blood pressure are found impacting the diseases onset/development. Interestingly, the education level has its influence on it as well. In this research, we applied the model into the sputum conversion of the TB/HIV which are co-infected patients managed in tertiary DOTS centre for a period of 6 months among the Nigeria adults. We also make use of the knowledge of percentage of censoring, variation in sample sizes. All these contribute to the existing knowledge.
II. METHODOLOGY
a) Study and Sampling Procedure
The population target for this study comprises all Patients with Tuberculosis related cases/issues in the DOTs Clinic of NIMR who had been registered between 2011 and 2016. The research design is a cross sectional design. The study was carried out at the DOTs Clinic of the Nigerian Institute of Medical Research (NIMR). A parastatal under the Federal Ministry of Health that has treated over 5000 TB patients in the last 6 years. The Institute has a Directly Observed Treatment Short Course (DOTS) centre where it attends to patients infected with TB. All patients that were enrolled between 2011 and 2016 was included in the study; it enabled the completion of the 6months treatment cycle for those enrolled in 2016.
Log rank test: This was used to compare the death rate between two distinct groups, conditional on the number at risk in the groups. The log rank test hypothesis that;
: All survival curves are the same
: Not all survival curves are the same.
Log rank test approximates a chi-square test which compares the observed number of failures to the expected number of failure under the hypothesis. Chi-squared test is used.
A large chi-squared value implies a rejection of the null hypothesis for the alternative hypothesis.
b) Cox Proportional Hazard Model
The non-parametric method does not control for covariates and it requires categorical predictors. When we have several prognostic variables, we must use multivariate approaches. But we cannot use multiple linear regression or logistic regression because they cannot deal with censored observations. We need another method to model survival data with the presence of censoring. One very popular model in survival data is the Cox proportional hazards model, which is proposed by .
The Cox Proportional Hazards model is given by
where is called the baseline hazard function, which is the hazard function for an individual for whom all the variables included in the model are zero, is the values of the vector of explanatory variables for a particular individual, and is a vector of regression coefficients.
The corresponding survival functions are related as follows:
This model, also known as the Cox regression model, makes no assumptions about the form of (non-parametric part of model) but assumes parametric form for the effect of the predictors on the hazard (parametric part of model). The model is therefore referred to as a semi-parametric model. The beauty of the Cox approach is that this vagueness creates no problems for estimation.
Even though the baseline hazard is not specified, we can still get a good estimate for regression coefficients , hazard ratio, and adjusted hazard curves. The measure of effect is called hazard ratio. The hazard ratio of two individuals with different covariates x and is
This hazard ratio is time-independent, which is why this is called the proportional hazards model.
Limitation of Cox PH Model: Cox regression model in the case of violation of the assumption of proportional hazards. It is improper to use a simple Cox regression model with regard to the violation of proportional hazard assumptions as it can lead to false deductions.
c) Accelerated Failure Time Model
Accelerated Failure Time model (AFT model) is a parametric model that provides an alternative to the commonly used proportional hazards models. Whereas a proportional hazards model assumes that the effect of a covariate is to multiply the hazard by some constant, an AFT model assumes that the effect of a covariate is to accelerate or decelerate the life course of a disease by some constant.
The assumption of AFT model can be expressed as
Where is the survival function at the time t and the is the baseline survival function at the time t. From this equation (1), AFT model can states that the survival function of an individual with covariate x at the time t is same as the baseline survival function of the time . The factor is known as the acceleration factor. The acceleration factor is the key measure of association obtained in the AFT model. It is a ratio of survival times corresponding to any fixed value of survival time.
The general log-linear representation of AFT model for ith individual is given as
Where represents the log-transformed survival time, are the explanatory variables with the coefficients is the residual term and assumes a specific distribution and is the intercept and is the scale parameters respectively.
Types of AFT Models
There are various types of AFT models, they are as follows:
1) Exponential and Weibull Model
2) Log-normal AFT model
3) Log-logistic AFT model
4) Gamma AFT model
We shall be explaining just the first two in this research:
i. Exponential and Weibull AFT model:
The exponential distribution was studied in connection with kinetic theory of gasses . The survival function of can be expressed by the survival function of . If the , has an extreme value distribution then follows the exponential distribution. The survival function of Gumbel distribution is given by
The Survival function of Weibull AFT model is given by
And the cumulative hazard function of Weibull AFT is
ii. Log-normal AFT model:
If the , has standard normal distribution then Ti follows the log-normal distribution. The survival function of log-normal AFT model is given by
The cumulative hazard function of Log-normal AFT model is
iii. Log-logistic AFT model:
If the , has logistic distribution then Ti follows the log-logistic distribution. The survival function of logistic distribution is given by
The survival function of log-normal AFT model is given by
The cumulative hazard function of log-logistic AFT is given by
Various goodness of fit Test:
There are various goodness of fit test, they are:
1) Bayesian Information Criterion
2) Kolmogorov-Smirnov test
3) Cramer-von Mises Criterion
4) Anderson-Darling test
5) Shapiro Wilk test
6) Chi-squared test
7) Akaike Information Criterion
8) Hosmer-Lemeshow test
9) Kuiper's test
10) Kernelized Stein Discepancy
11) Zhangs , test
12) Moran test
AIC: To compare various semi-parametric and parametric models Akaike Information Criterion (AIC) is used. It is a measure of goodness of fit of an estimated statistical model. In this study, AIC is computed as follows
Where P is the number of parameters and K is the number of coefficients (excluding constant) in the model. For P=1, for the exponential, P=2, for Weibull, Log-logistic, Lognormal etc. The model which as smallest AIC value is considered as best fitted model.
For each distribution of , there is a corresponding distribution for T. The members of the AFT model class include the exponential AFT model, Weibull AFT model, log-logistic AFT model, log-normal AFT model, and gamma AFT model. The AFT models are named for the distribution of T rather than the distribution of or .
III. ANALYSIS AND DISCUSSION
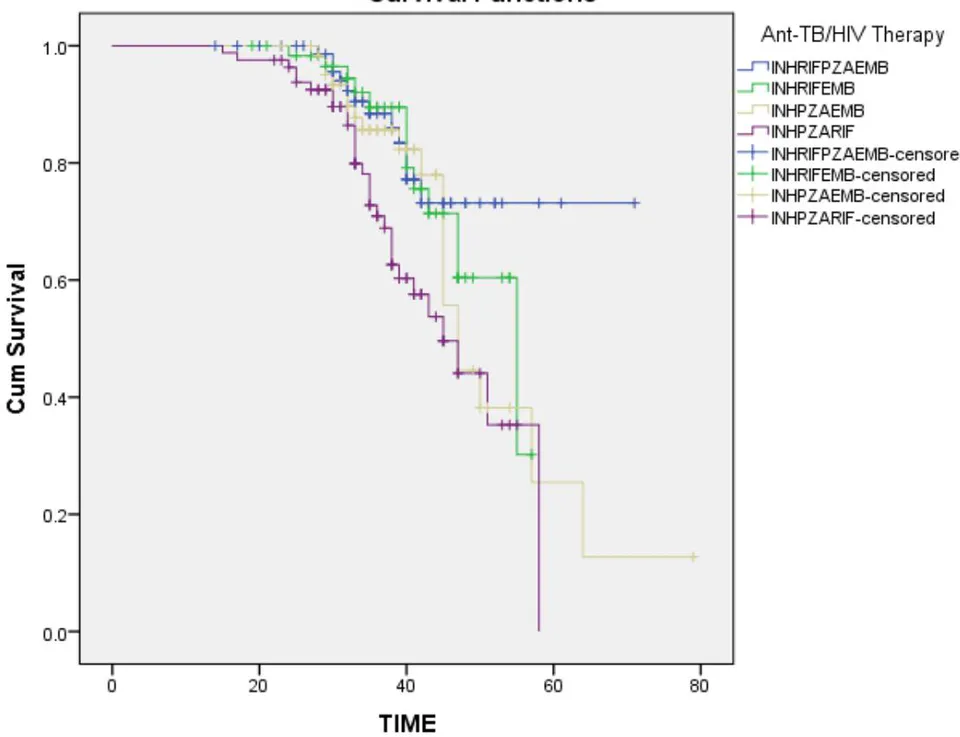
We can see from Fig 1. that the cumulative survival proportion appears to be much higher in the Anti-TB/HIV therapy (INHRIFEMB, INHRIFPZAEMB and INHPZAEMB) compared to the groups in which INHPZAEMB was used. In INHPZAEMB group, few participants resume this therapy. It would appear that INHRIFPZAEMB and INHPZAEMB of TB/HIV Therapy significantly prolong the time until participants resume event compared to the other interventions. The median survival time is at 40 years of age for INHPZARIF combination TB/HIV therapy while 45 years is expected for INPZAEMB therapy group. Many are censored in INHRIFEMB before reaching the age of 60 years with regarding sputum conversion of TB patients on therapy.
Note: EMB, INH, PZA, RIF and RPT represent Enthambutol, Isoniazid, Pyrazinamide, Rifampin and Rifapentine respectively.
LOG Rank Test
: The effect of the three regimens does not have significant to TB preventive therapy for TB/HIV co-infected adults.
: Not :
In Table 1. Since (.0192) < ( ), the effect of the three regimens does have significant to TB preventive therapy for TB/HIV co-infected adults. Then survival distributions are different in the population which make the result more statistically significance. By the log-rank test, in the preventive therapy, there is significant difference among three regimens of TB preventive therapy for TB/HIV co-infected adults, since the p-value is 0.0192 against 5% level of significance. The K-M curves for time to educate length and time to combined event of the preventive therapy is presented (Figure 1.).
a) Cox Proportional Hazard Model
In Table 2, since : SEX, HAEMO GLUC, BMI and LYMPHABS, then they are statistically significant. The coefficient for Creatinine is positive, telling us that greater Creatinine values are associated with greater hazard and therefore shorter survival. The coefficient for weight is negative –normal body weight will be associated with a lower hazard and longer survival among the therapy population. The coefficient of LYMPHABS is negative showing that there is no significant reduction in CD4 cells which will be associated with a lower hazard and longer survival. The CD4 cells are the cells that the HIV Virus kills. As HIV infection progresses, the number of these cells decline. When the CD4 counts drops below 200 due to advance HIV disease, a person is diagnosed with AID. A normal range for CD4 lies between 500-1500. If haemoglobin content is also reduced, then the possibility of survival will be greatly affected. The BMI estimate of parameter is also negative, and then there will be associated lower hazard and longer survival.
The results of a PH model fitted to this dataset are obtained (Table 3)
After a Cox PH model is fitted, the adequacy of this model, including the PH assumption and the goodness of fit, needs to be assessed. The PH assumption checking with graphical method and two statistical test methods.
Omnibus Test: From Table 4, since the P-value (0.009) < (0.05), we have statistical reasons to reject and conclude that the parameter of the model are more stable and can be totally relied on in evidence based decision making regarding the TB/HIV preventive therapy. Also, the log-likelihood supported the significant of the model parameter estimate.
b) Accelerated Failure Time Models
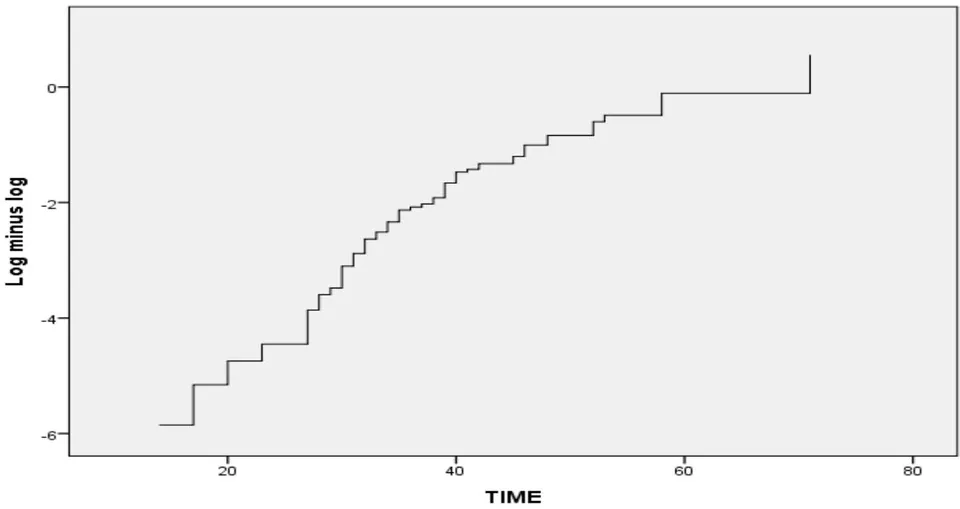
In Figure 2, the Cox proportional hazard model does not hold completely for this data, if it is completely hold then, the log minus log plot will be parallel. For this reason, the investigation of Accelerated Failure.
Time Model comes into play. In univariate AFT models, age, haemoglobin, body mass index, sex, and absolute lymphocyte count are not statistically significantly associated with time to sputum conversion of TB/HIV co-infected patients. The results from the different AFT models applied to the time to sputum conversion are presented in Tables 5, 6, 7, and 8. There is no big difference for the estimations in different models. Accelerated failure time models were compared using statistical criteria (likelihood ratio test and AIC). The Weibull in table 8 reveals that age and sex are statistically significant while HAEMO GLUC, BMI and LYMPHABS are not significant with their p-value greater than 0.05. We compared all these AFT models using statistical criteria (likelihood ratio test and AIC). The nested AFT models can be compared using the likelihood ratio (LR) test in Table 10. The Cox model, log-logistic model and the Weibull model are nested within the log-normal model (Table 10). According to the LR test, the weibull model fits better. However, the LR test is not valid for comparing models that are not nested. In this case, we use AIC to compare the models (Table 11), (The smaller AIC is the best). The Weibull AFT model appears to be an appropriate AFT model according to AIC compared with other models, although it is only slightly better than Log-logistic or Log-normal model. We also note that the Cox model and Log-normal model are poorer fits according to LR test and AIC. This provides more evidence that the PH assumption for this data is not appropriate. At last, we conclude that the Weibull model is the best fitting the AFT model based on AIC criteria.
IV. CONCLUSION
In this research, our findings revealed the absence of protection of TB/HIV preventive therapies on sputum conversion, death and combined event of the conversion and death. The study presents similar estimates of risk for the covariates with the previous study based on the baseline variables in the Cox Proportional Hazard model. But the PH assumption does not hold for LYMPHABS in this analysis. We also use.three different AFT models to fit the data. We find that the weibull AFT model fit better for this dataset. The univariate PH models, the SEX, HAEMO GLUC, BMI and LYMPHABS are lesser than p-value, then they are statistically significant. The coefficient for Creatinine is positive, telling us that greater Creatinine values are associated with greater hazard and therefore shorter survival. The coefficient for weight is negative–normal body weight was associated with a lower hazard and longer survival among the therapy population. The coefficient of LYMPHABS is negative showing that there is no significant reduction in CD4 cells which will be associated with a lower hazard and longer survival. Men have longer survival time and sputum conversion time than women. The risks of TB/HIV progression, death and the combined event of TB/HIV and death are higher among old adults.
Log-rank test was able to show us that effect of the three regimen have significant association to the TB/HIV co-infected preventive therapy. Moreso, through Omnibus Tests of Model, we were able to deduce that there is no significant difference in time to sputum conversion of the TB/HIV co-infected patients on therapy. Telling us that the model is statistically adequate and significant
According to the Cox PH model with time-dependent variables, the predictive effect of absolute lymphocytes count clearly changes at about 2 years. Before 2 years, the hazard is less than one, which indicates that the risk of TB/HIV as absolute lymphocyte count increases. According to the log-logistic AFT model, LYMPHABS prolongs the time to sputum conversion as it increases along the process. The PH model is routinely applied to the analysis of survival data. The study considered here provides an example of a situation where AFT model is appropriate and where the PH model provides a little better description of the data set. We have seen that the PH model is a less valuable and realistic alternative to the AFT model in some situations. AIC shows us that weibull AFT model fits better when compared to the other models.
This study is based on a large number of participants from Lagos residents in Nigeria, where the prevalence of TB infection and HIV are very high. In this study, the Cox PH model and the AFT model have been compared using TB/HIV co-infected data. Association of the TB/HIV preventive therapies with the sputum conversion is examined through the linkage of the signs and symptoms to replication of the virus. The Cox model expresses the multiplicative effect of covariates on the hazard. The AFT model provides an estimate of the survival function time ratios. In this research, we have analyzed the TB/HIV dataset using these alternative methods. This study provides an example of a situation where the AFT model is appropriate and where the PH model provides a little description of the data since log-minus-log plot is not parallel. The Cox proportional hazard assumption does not hold in this dataset.
We select the model that best describes the data. In addition, the example illustrates that the AFT model have a more realistic interpretation and provides more informative results as compared to Cox PH model for the available data. Therefore,
a) We suggest that using the Cox PH model may not be the optimum approach. The AFT model may provide an alternative method to fit some survival data.
b) Determining the effect of the three regimens may be additional values to researches.
The results from this model could then be compared with the standard AFT models and Cox PH models. In addition, further study can be carried out to evaluate the effects of practical cases such as large censoring.
ACKNOWLEDGEMENT
We will like to acknowledge the Director and Institutional Review Board (NIMR-IRB) of National Institute Medical Research, Yaba, Lagos for their approval for the effective use of their patients' data.
Appendices Table 1: Test for equality of Survival Distribution for Different level of TB/HIV Therapy
| Chi-Square | df | Sig. | |
| Log Rank (Mantel-Cox) | 9.930 | 3 | .019 |
| Breslow (Generalized Wilcoxon) | 8.570 | 3 | .036 |
| Tarone-Ware | 9.055 | 3 | .029 |
| Variable | Description | Codes/values |
| AGE | Age | year(s) |
| SEX | Patient's sex | 0 = Male, 1 = Female |
| STATUS | Marital status | 0 = Single, 1 = Married2 = Divorce, 3 = Widow |
| LYMPHABS | Absolute Lymphocytes count | |
| WEIGHT | Weight | Kg |
| BMI | Body Mass Index | |
| GLUC | Glucose | G |
| HAEMO | Haemoglobin | Mg/dL |
| CREAT | Creatinine level | Mg/Dl |
| B | Sig. | Exp(B) | 95.0% CI for Exp(B) | ||
| Lower | Upper | ||||
| CD4 | -.001 | .027 | .999 | .997 | 1.001 |
| Hemoglobin | -.160 | .035 | .852 | .735 | .989 |
| Creatinine | .002 | .188 | 1.002 | .999 | 1.005 |
| Status | -.004 | .301 | .996 | .989 | 1.004 |
| BMI | .366 | .048 | .694 | .138 | 3.477 |
| Weight | -.005 | .645 | .995 | .974 | 1.017 |
| Sex | -.520 | .04 | .595 | .343 | 1.030 |
| Glucose | -.679 | .009 | .507 | .238 | 1.081 |
Table 4: Omnibus Tests of Model Coefficients
| Overall (score) | Change From Previous Step | Change From Previous Block | ||||
| Chi-square | df | Sig. | Chi-square | Df | Sig. | Chi-square |
| 20.351 | 8 | .009 | 21.077 | 8 | .007 | 21.077 |
| Covariate | Life-Expn | Se(coeff) | Wald p | |
| CD4 | -0.013 | 0.989 | 0.034 | 0.689 |
| Weight | -0.061 | 0.928 | 0.097 | 0.510 |
| BMI | 0.5612 | 1.753 | 0.625 | 0.410 |
| Glucose | -0.022 | 0.978 | 0.016 | 0.168 |
| Haemoglobin | 0.133 | 1.146 | 0.178 | 0.457 |
| Creatine | -0.0001 | 0.999 | 0.006 | 0.984 |
| Covariate | Life-Expn | Se(coeff) | Wald p | |
| CD4 | -0.014 | 0.989 | 0.031 | 0.659 |
| Weight | -0.061 | 0.928 | 0.084 | 0.465 |
| BMI | 0.627 | 1.858 | 0.487 | 0.349 |
| Glucose | -0.023 | 0.977 | 0.016 | 0.852 |
| Haemoglobin | 0.146 | 1.158 | 0.161 | 0.009 |
| Creatine | -0.000 | 0.999 | 0.006 | 0.079 |
| Covariate | Life-Expn | Se(coeff) | Wald p | |
| CD4 | -0.011 | 0.919 | 0.034 | 0.50 |
| Weight | -0.075 | 0.908 | 0.097 | 0.440 |
| BMI | 0.336 | 1.3959 | 0.376 | 0.371 |
| Glucose | -0.022 | 0.978 | 0.015 | 0.145 |
| Haemoglobin | 0.136 | 1.146 | 0.176 | 0.438 |
| Creatine | -0.00001 | 0.999 | 0.005 | 0.984 |
| No of parameter | Log-likelihood | Testing against the Log-normal distribution | ||
| Distribution | m | L | LR | df |
| Cox model | 2 | -42.961 | 115.142 | 1 |
| Log-logistic | 2 | -100.532 | 326.460 | 1 |
| Weibull | 3 | -263.762 | 440.452 | 2 |
| Log-normal | 2 | -43.536 | ||
| Distribution | Log-likelihood | k | c | AIC |
| Cox Model | -42.961 | 6 | 1 | 256.214 |
| Log-logistic | -100.532 | 6 | 2 | 225.156 |
| Weibull | -263.762 | 6 | 1 | 218.079 |
| Log-normal | -43.536 | 6 | 2 | 235.019 |