
I. INTRODUCTION
The most important among the clinical forms of glaucoma is primary open-angle glaucoma (POAG), which, according to various authors, occurs in of cases. Due to the high prevalence of POAG, late detection and serious prognosis for visual functions, this disease occupies a special place in clinical ophthalmology [1].
The proportion of the disease caused by this type of pathology, requiring surgical treatment, is generally small. However, the absolute number of patients with this pathology is quite large: if, in general, in Uzbekistan, the absolute number of patients (2019) with various forms of eye diseases was more than 600 thousand people, then with glaucoma the number of patients was 9,000 [2, 3].
Despite significant advances in the medical treatment of this disease, the percentage of blindness and low vision as a result of glaucoma remains stable and does not tend to decrease. But with the timely detection of the disease, with the help of drug treatment, you can reduce the level of intraocular pressure (IOP).
The issue of introducing a more effective, but less expensive drug remains relevant [4].
The aim of the study was to conduct a pharmacoeconomic evaluation of Tafluprost vs Travoprost in patients with POAG.
II. MATERIALS AND METHODS
In this research pharmaco-economic methods of analysis, in particular relative risk calculation, probability of events calculation, cost-effectiveness analysis was performed in order to achieve the purpose of the investigation.
III. RESULTS AND DISCUSSIONS
To evaluate the cost-effectiveness of Tafluprost compared with Travoprost in patients with POAG, a Markov analytical model was implemented. The structure of the model was taken from the NICE Guide (2017). Patients were initially classified into glaucoma conditions based on visual field characteristics (Hoddap-Parrish-Anderson criteria) [5].
To monitor patients for more than 3 years, a 1-month cycle was used. During a Markov cycle, members of a cohort may stay at their stage, die, or progress. Because glaucoma can only be prevented from worsening further, none of the cohort members can regress along the clinical path. Based on the HPU (hectopascal unit of pressure) classification system, patients were divided using the mean deviation (MD) value into early (MD less than -6dB), moderate (MD less than -12dB) and severe (MD greater than -12dB). It was believed that the main impact of each strategy was to increase or decrease the risk of developing POAG. However, according to clinical data, the most detailed risk factor for treatment outcomes is adjusting for changes in IOP. To find the relative risk of developing glaucoma of each of the interventions, a systematic search was carried out, moreover, the probabilities of transition between stages were found using another search in the literature. Since the model assumed that an increase in IOP is associated with a further increase in the likelihood of developing glaucoma, this study showed that costs decrease when the progression of the disease is inhibited [6, 7].
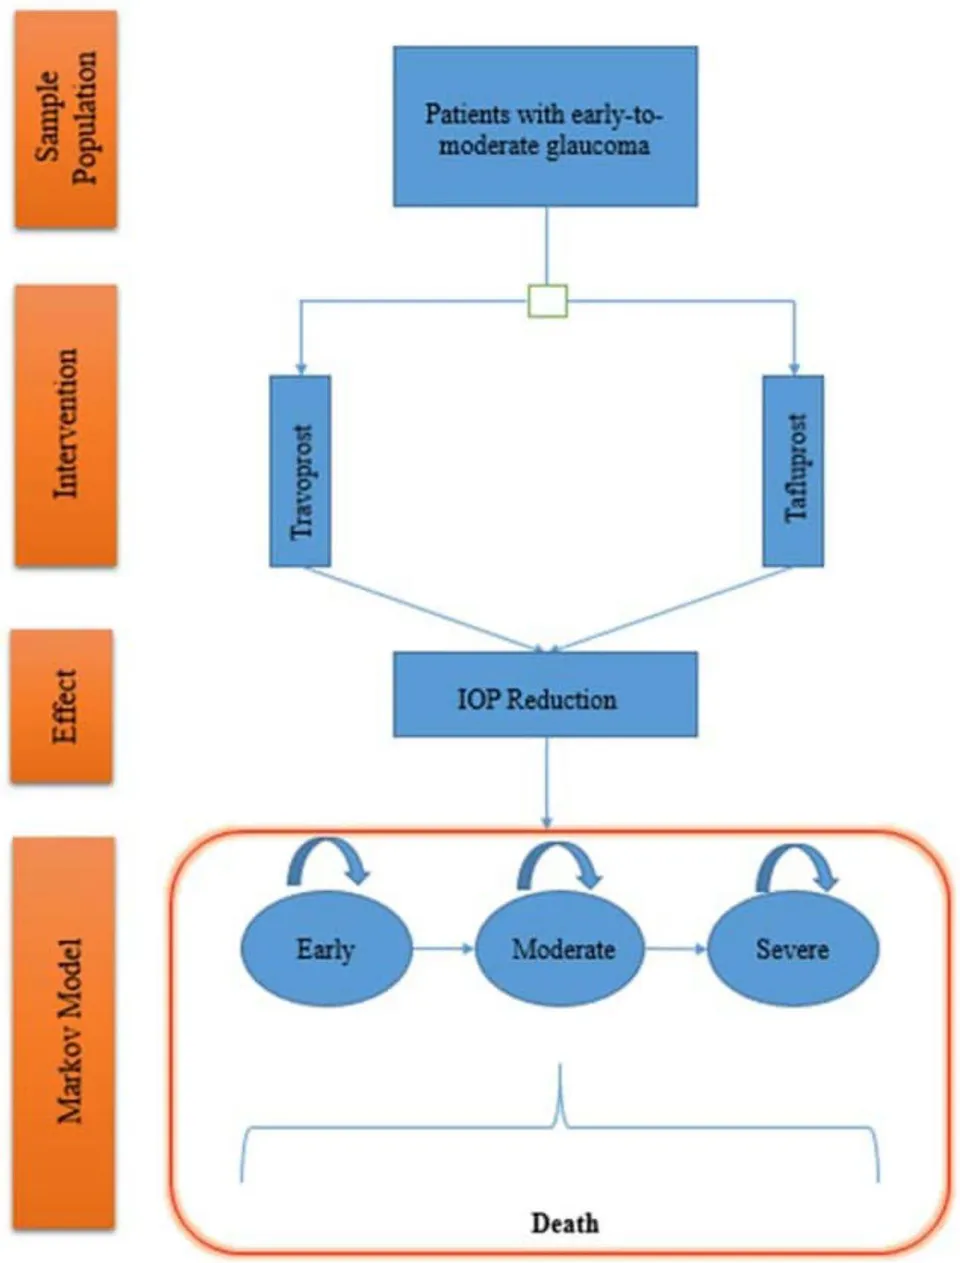
Several input parameters were used to populate the model. These baseline data were based on clinical evidence derived from effective evidence review, attempting to broadly allocate resources to guideline updates and supplementary databases. Model inputs have been reviewed and validated by clinical experts. More details on sources - clinical outcomes, utilities and costs are explained below.
Initially, the search was conducted to determine the likelihood of a treatment-related transition during the follow-up period. Since all the data obtained reflected a period of time that exceeded the duration of the cycle in our model, we converted the information into monthly probabilities (Table 1.). The incremental cost-effectiveness study presents the annual risk of progression to routine glaucoma with moderate to severe clinical treatments. Input parameters were based on 601 patients followed up for 5 years in the Primary Glaucoma Treatment Collaborative Study (PGTCS). Calculation of transition probabilities from early to severe glaucoma was based on various combinations of methods, including natural decline, from the study of early overt glaucoma to the NICE methodology [11]. The study reported transition probabilities by estimating the
number of months it takes a normal patient to change from one state of well-being, then to the next, which was found to decrease in efficiency-adjusted MD effectiveness each month. IOP and age were identified as significant risk factors. The total mortality of people over 65 years of age was obtained from WHO sources to calculate the Markov model.
| Glaucoma Stages | Average monthly probabilities | Min | Max | Author, Year |
| P (early to moderate) | 0.003779977 | 0.003023982 | 0.004535973 | Rein et al., 2009 Lichter et al., 2001 |
| P (moderate to severe) | 0.003779977 | 0.003023982 | 0.004535973 | Rein et al., 2009 Lichter et al., 2001 |
| Mortality | ||||
| Total mortality of the population over 65 years of age | 0.000483333 | 0.000386667 | 0.00058 | World Health Organization, 2016 |
Since glaucoma is a chronic disease, it has a great impact on many stages of a patient's life. Although glaucoma eventually leads to permanent blindness, the performance of daily activities and the quality of life recognized by individuals seriously affect health in the early stages of the disease. There are many potential causes of the impact of glaucoma on the patient's quality of life, such as loss of visual field, stress and anxiety due to tests in clinics, impairment and cost of medical care [13]. Many authors have investigated the impact of illness at health stages on the quality of life of patients. Utility values for early, moderate, and severe health conditions in glaucoma were derived primarily from two studies. The first study included a cross- sectional study of 434 patients with 5 common eye conditions, including glaucoma. Computerized preference scores were used to rate standard utilities from 0 (death) to 1 (excellent health). The second study analyzed the impact of the applied therapy on the utility of patients with glaucoma. The sample population consisted of 225 patients in the same age group as in our evaluation. To the best of our knowledge, a noteworthy finding from this study is that no interference was found between treatment and utility of glaucoma. When reviewing both studies, no rapid discrepancies were found between beneficial outcomes at different stages of glaucoma. Table 2 shows the detailed utility values used in the model.
| Health status | Utility | Min. | Max. | Author, Year |
| Early glaucoma | 0.92 | 0.736 | 1.104 | Lee et al. (2008) and Palette Guedes et al. (2015) |
| Moderate glaucoma | 0.89 | 0.712 | 1.068 | Lee et al. (2008) and Palette Guedes et al. (2015) |
| Severe glaucoma | 0.86 | 0.688 | 1.032 | Lee et al. (2008) and Palette Guedes et al. (2015) |
| Death | 0.00 | |||
Cost and resource utilization parameters were obtained from a clinical specialist who works at the Specialized Research Center for Eye Microsurgery in Tashkent.
To calculate the monthly intervention costs, we first derived the annual cost of POAG by multiplying the average unit cost by the expected resource use. Each stage of the disease includes the necessary diagnostic costs, the salaries of medical staff and the weighted cost of medicines. Average prices for prostaglandin analogues and eye drop with beta-blockers were obtained from local pharmacies in Tashkent. After the early stage of glaucoma, monotherapy with Travoprost (Travatan 2.5 ml) or Tafluprost (Teflotan 2.5 ml) was prescribed. However, patients with moderate progression are treated with combined beta-blockers and prostaglandin analogues. The operation is applied on both eyes in a severe condition of glaucoma. In accordance with the recommendations of experts, the frequency of medical diagnoses was set to 4 times a year, that is, once every three months. In addition, it is estimated that 15 vials of Teflotan and Travatan are consumed annually per patient. Meanwhile, the patient is annually prescribed 7 vials of timolol maleate, 5 ml each, and Oftan® Timolol, 5 ml each.
| The cost of treatment in one case | Medium Cost (UZS) | Minimum Cost (UZS) | Maximum Cost (UZS) |
| Diagnostics and laboratory tests | |||
| Visometry Test | 21,300 | 14.910 | 27.690 |
| Simple optical correction | 23,000 | 16,100 | 29,900 |
| Biomicroscopy | 40,000 | 28,000 | 52,000 |
| Simple perimetry | 23,000 | 16,100 | 29,900 |
| The cost of treatment in one case | Medium Cost (UZS) | Minimum Cost (UZS) | Maximum Cost (UZS) |
| Tonometry | 25,000 | 17,500 | 32,500 |
| Gonioscopy | 30,000 | 21,000 | 39,000 |
| Direct ophthalmoscopy | 30,000 | 21,000 | 39,000 |
| Reverse ophthalmoscopy | 40,000 | 28,000 | 52,000 |
| Consultation | 27,000 | 18,900 | 35.100 |
| Total diagnostic and lab costs per visit | 1,037,200 | 726.040 | 1,348,360 |
| Care costper visit (20 min) | 2.536 | 1.775 | 3.296 |
| Doctor cost per visit (20 min) | 4,620 | 3.234 | 6.006 |
| Total payroll costsfee | 7.156 | 5.009 | 9.302 |
| The cost of treatment in one case | Medium Cost (UZS) | Minimum Cost (UZS) | Maximum Cost (UZS) |
| Eye drops | |||
| Taflatan 2.5ml | 90,000 | 63,000 | 117,000 |
| Travatan 2.5ml | 140,000 | 98,000 | 182,000 |
| Timolol maleate5ml | 30,000 | 21,000 | 39,000 |
| Oftan® Timolol5ml | 25,000 | 17,500 | 32,500 |
| Annual cost of intervention per patient | early glaucoma (UZS) | Moderate glaucoma (UZS) | Severe glaucoma (UZS) |
| Tafluprost | 2,415,824 | 2,800,824 | 5,815,824 |
| Monthly intervention cost per patient | 201.319 | 233.402 | 484.652 |
| Travoprost | 3,165,824 | 3,550,824 | 6,565,824 |
| Comparator monthly cost per patient | 263.819 | 295.902 | 547.152 |
Cost-effectiveness study used actual numbers or averages as model parameters. This strategy gives the best estimate of the cost-effectiveness of the Tafluprost intervention, but does not take into account the uncertainty about model inputs or the likelihood of a different sequence of events. A widely used cost-effectiveness measure is to apply the incremental cost-effectiveness ratio (ICER) when comparing Tafluprost and Travoprost eye drops.
During the cost-effectiveness analysis, which gives the best estimate of the cost-effectiveness of Tafluprost, a sensitivity analysis was performed to assess the vulnerability of the model and clinical incidents. To assess the effect of changing one parameter or the parameter that had the greatest impact on the model results, we performed a one-sided sensitivity analysis. When performing a one-sided sensitivity analysis, the valid ranges of the model input data were used. This made it possible to evaluate the individual impact of model inputs on the results. To conduct the Monte Carlo simulation, the model was run on a cohort of 1000 patients and the selected inputs were randomly selected based on the assigned distribution. The results were presented in Table 5, then looking at the cost-effectiveness threshold at the country level, the prospects for the appropriateness of the proposed intervention were assessed.
| Variable | Range | |
| High | Low | |
| Overall mortality in patients over 65 years of age | 0.00058 | 0.00039 |
| Cost discount rate | 0.003 | 0.002 |
| Results discount rate | 0.003 | 0.002 |
| The cost of a severe stage per month Tafluprost | $630,047.60 | $339,256.40 |
| The cost of a severe stage per month Travoprost | $711,297.60 | $383,006.40 |
| Likelihood of switching from moderate to severe glaucoma with Tafluprost | 0.004535973 | 0.003023982 |
| Probability of going from early to moderate glaucoma with Tafluprost | 0.004535973 | 0.003023982 |
| Relative risk of Travoprost | 1.235337423 | 0.823558282 |
| Health Benefits of Early Glaucoma | 1.104 | 0.736 |
| Moderate stage cost per month Tafluprost | $303,422.60 | $163,381.40 |
| Health Benefits in Severe Glaucoma | 1.032 | 0.688 |
| Early-stage cost per month Tafluprost | $261,714.27 | $140,923.07 |
| Cost of the moderate stage per month Travoprost | $384,672.60 | $207,131.40 |
| Early-stage cost per month Travoprost | $342,964.27 | $184,673.07 |
| Benefits of Moderate Health in Glaucoma | 1.068 | 0.712 |
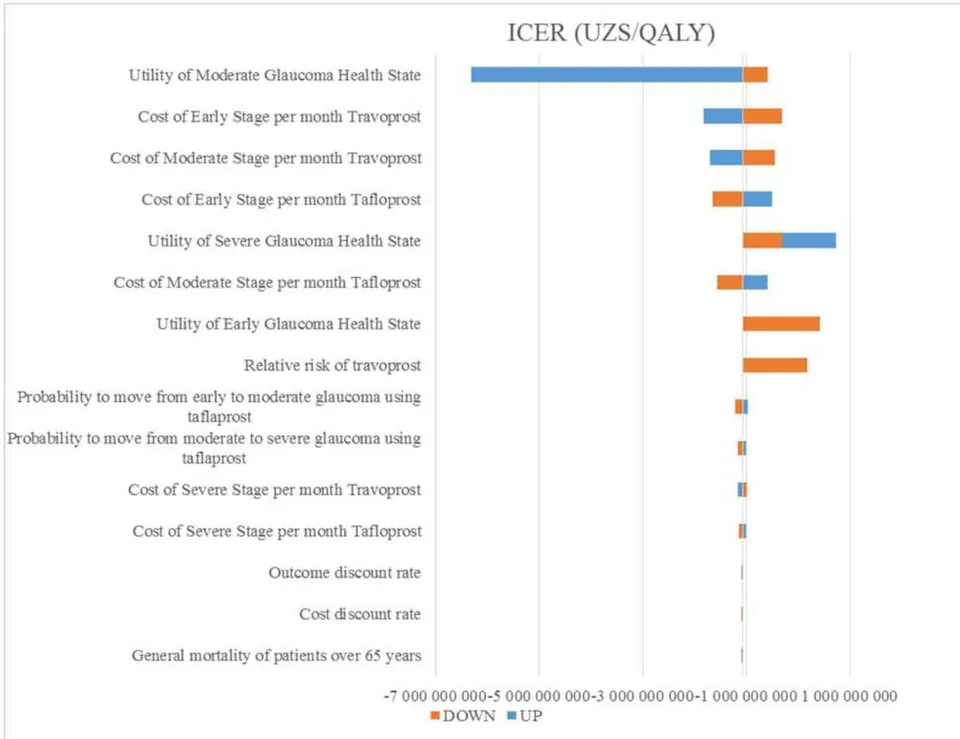
The results of a one-way sensitivity analysis suggested that the variable that strongly influenced the economic model was the utility of the moderate stage of glaucoma. In absolute terms, when the QALY health utility of moderate glaucoma declined, ICER increased nearly 6-fold. In addition, when the risk of spending on Travoprost in early to moderate glaucoma was modified, their ICER showed balanced volatility for both parties per QALY. The results of other models are relatively less sensitive than the above parameters (Fig. 1).
The results from the cost-effectiveness analysis for the reference case are presented in Table 6. On average, the new intervention dominated by Tafluprost is less costly and clinically more effective than the comparator drug (Travoprost). We calculated that a savings phenomenon could be observed in the treatment of patients with POAG (compared to the Brown study).etal.), so ICER was negative.
| Strategy | Average total cost | Average overall effect, QALYs | ICER UZS/QALY |
| Travoprost | 9,721,341 | 30.878 | -1 069 362 |
| Tafluprost | 7,582,616 | 30.880 |
that in the treatment of glaucoma, when using Tafluprost, you can save 2.138.725 UZS (Table 7).
Next, we performed a budget impact analysis. According to the results of the analysis, it can be seen
| Transition in treatment glaucoma on Tafluprost with Travoprost | Payment | the effect influence on budget, sum | A comment |
| 9,721,341 - 7,582,616 | = 2,138,725 | Saving funds |
The cost-effectiveness analysis based on the model showed that the treatment of patients with POAG with Tafluprost has a dominant advantage over the reference drug Travoprost. Despite marginal improvement in quality of life, the Tafluprost intervention resulted in cost savings due to less resource use. However, it is interesting to note that our results are not consistent with a recent US study comparing several prostaglandin analogs in the treatment of patients with glaucoma. Brown Research et al. (2019) showed that Tafluprost is more costly and effective than Travoprost. The additional allowance for the target group was about US(214,828. However, since the economic study took into account cost parameters related to a developed country such as the United States, it is inappropriate to compare with our findings from the perspective of Uzbekistan. Our analysis shows that the exclusive use of Tafluprost rather than Travoprost in the treatment of patients with glaucoma prevents additional economic burden. Under these model assumptions, it has been calculated that delaying progression in early states of glaucoma may prevent patients from taking additional glaucoma medications and even eye surgery in advanced stages of the disease. Based on this, we can assume that Tafluprost would be the most practical option in the reference center environment for the treatment of glaucoma, which would save money for the healthcare system in Uzbekistan.
The study has many strengths. A short analytical decision tree and a Markov model were used to collect epidemiological, clinical, resource utilization, and outcome estimates. The model included the likelihood of glaucoma progressing to advanced stages. In addition, these stages reflect both the clinical and economic consequences of glaucoma. The literature used to derive the specific parameters in our model is based on the sufficient size of the observation period and the target population. We used specific cost data for Uzbekistan, which was unprecedented in this area for individual interventions in the treatment of patients with POAG.
IV. CONCLUSIONS
According to the calculated results of pharmacoeconomic analyzes, Tafluprost was relatively less expensive and more clinically effective than Travoprost in patients with primary open-angle glaucoma. Alternative treatment with Tafluprost contributes to savings in the overall treatment procedure. Therefore, we recommend adding Tafluprost to the list of essential medicines.