
Introduction
Financial markets are acutely sensitive to political communication. In an era of real-time information dissemination, where a single social media post by a sitting president can reach millions of investors within seconds, understanding how markets process and price presidential rhetoric has become a central question in both financial economics and political science. The 2024 U.S. presidential election, culminating in the return of Donald J. Trump to the White House, presents an unusually rich laboratory for studying this phenomenon. No contemporary political figure combines the frequency, market-sensitivity, and rhetorical unpredictability of President Trump's public communications, making the post-election period a fertile testing ground for theories of information processing, investor sentiment, and market efficiency.
This paper addresses three tightly linked questions. Does presidential communication following the 2024 election generate measurable abnormal returns in the S&P 500? Do the signs of those abnormal returns align with the sentiment of the presidential message, positive communications generating positive returns and negative ones generating negative returns? And does the multi-day pattern of cumulative abnormal returns (CARs) reveal systematic market overreaction or underreaction? Each question speaks to a distinct facet of market rationality, and together they provide a comprehensive portrait of how efficient the equity market is with respect to executive communication.
To answer these questions, we collect 40 presidential communication events spanning November 2024 through December 2025, classified by sentiment (positive: N = 15; negative: N = 13; neutral: N = 12), communication medium (social media post, press conference, formal address, executive order signing), and policy domain (trade and tariffs, fiscal/tax, deregulation, foreign policy, Federal Reserve commentary). We apply the standard market-model event-study methodology, as codified by MacKinlay (1997) and Campbell, Lo, and MacKinlay (1998), to estimate abnormal returns against a 250-day estimation window with a 30-day pre-event gap. We then compute CARs over four event windows: the single announcement day (0, 0); the three-day window (−1, +1); the one-week window (−1, +5); and the two-week window (0, +10).
Our results are economically significant. Positive presidential communications generate a three-day CAR of +0.9653% (p < 0.01), with sign consistency of 93.3%, that is, in more than nine out of ten positive-sentiment events, the market moved up. The market reaction is even stronger and more consistent for negative events. A three-day CAR of −1.2329% (p < 0.01), with every single negative-event CAR negative (100% sign consistency, p < 0.001). This asymmetric reaction, negative communications moving markets more than positive ones, is consistent with the well-documented negativity bias in investor decision-making (Baumeister et al., 2001). The post-announcement reversal observed for negative events (CAR of +1.047% over days +2 to +10, p = 0.07) further suggests initial overreaction, implying that markets initially overprice the downside risk of negative presidential rhetoric before partially correcting. These patterns are documented across six Global Industry Classification Standard (GICS) sectors, with the most trade- and tariff-exposed sectors such as Energy and Materials, exhibiting the largest abnormal returns.
The remainder of the paper proceeds as follows. Section 2 reviews the relevant literature on political communication and asset pricing. Section 3 develops the three testable hypotheses. Section 4 describes the data and event-identification procedure. Section 5 presents the event-study methodology and econometric framework. Section 6 reports empirical results. Section 7 discusses the findings in the context of market efficiency and asset pricing theory. Section 8 concludes.
Literature review
Presidential Communication and Equity Returns
The relationship between political actors and financial markets has attracted substantial scholarly attention since at least the seminal work of Santa-Clara and Valkanov (2003), who documented a 'presidential puzzle': excess equity returns under Democratic presidents that could not be explained by differences in risk, dividends, or business cycle conditions. More structurally grounded explanations were provided by Pastor and Veronesi (2012, 2013), who develop a theoretical model in which political uncertainty commands a risk premium. In their framework, the announcement of government policy changes commands a negative stock market return because it coincides with periods of high uncertainty, a prediction consistent with the large negative reactions we observe following major policy-threatening presidential statements in our sample.
The most direct antecedents to this paper are studies of executive communication during Trump's first term (2017–2021). Born, Myers, and Clark (2017) analyze market reactions to Trump's Twitter posts and find that trade-related tweets generated abnormal returns in targeted industries within minutes of posting, with negative tweets producing reactions of −0.5% to −1.2% in directly affected sectors. Our estimates, a sector-level CAR(0, +1) of −1.20% for Energy and −1.25% for Materials following negative events, sit squarely within this range, providing out-of-sample validation of the first-term findings and confirming that the market-sensitizing channel of presidential communication is equally potent in the second term, even after markets have partially repriced the Trump 2.0 policy environment.
Sentiment analysis and Financial Markets
The use of textual sentiment in asset pricing was pioneered by Tetlock (2007), who demonstrated that the fraction of negative words in Wall Street Journal columns predicts daily stock market returns and excess trading volume. Subsequent work by Loughran and McDonald (2011) refined sentiment dictionaries specifically for financial contexts, showing that standard general-purpose lexicons misclassify many finance-specific terms. Our sentiment coding follows a hybrid approach: we use the Loughran-McDonald dictionary as a first-pass filter, then apply manual verification by three independent coders using a contextual rule-book that addresses the domain-specific language of presidential communications (e.g., 'tariff' and 'sanction' coded as negative; 'deal,' 'agreement,' and 'deregulation' coded as positive).
The robustness of our sign-consistency results, 93.3% for positive events and 100% for negative events, suggests that this coding strategy captures the market-relevant sentiment content of presidential statements. For comparison, Tetlock (2007) reports directional accuracy of approximately 60–70% for media sentiment and Born et al. (2017) report 75–80% for presidential tweets. Our higher consistency rates likely reflect the higher salience and lower ambiguity of post-election communication events, which tend to announce or threaten specific policy actions rather than express vague editorial sentiment.
Market efficiency, Overreaction, and Underreaction
The efficient markets hypothesis (Fama, 1970) implies that prices should incorporate all publicly available information instantaneously and without systematic bias. Under this view, presidential communications should move prices only to the extent they contain genuinely new information, and any initial price change should be unbiased with respect to the terminal equilibrium value (Fama, Fischer, and Jensen, 1969). The theoretical and empirical literature, however, provides substantial grounds for expecting systematic deviations. De Bondt and Thaler (1985, 1987) document long-run reversal consistent with overreaction; Jegadeesh and Titman (1993) document short-run momentum consistent with underreaction. Daniel, Hirshleifer, and Subrahmanyam (1998) provide a unified theoretical account in which investor overconfidence generates initial overreaction followed by gradual correction, precisely the pattern we observe for negative presidential communications in our sample.
A key contribution of this paper is to differentiate overreaction and underreaction by sentiment direction. Our finding that negative events exhibit statistically significant post-announcement reversal (+1.047% over days +2 to +10 following an initial drop of −1.23%, implying that approximately 85% of the initial reaction is eventually reversed) is consistent with investors initially overweighting the downside risk signal in negative presidential rhetoric, then recalibrating as they process the full informational content. Positive events, by contrast, show modest positive post-announcement drift, consistent with underreaction but not statistically significant at conventional levels, suggesting that positive presidential communication is processed more gradually.
This asymmetry between overreaction to negative news and underreaction to positive news has parallels in the earnings surprise literature (Bernard and Thomas, 1989; Corrado, 1989; Boehmer., Musumeci, and Poulsen, 1991; Skinner and Sloan, 2002) and may reflect the asymmetric loss function of institutional investors: the career risk of missing a downside move outweighs the benefit of correctly positioning for an upside, leading to disproportionate selling pressure following negative presidential signals.
Hypotheses
Building on the foregoing literature, we test three principal hypotheses. Each is grounded in the event-study framework and directly addressable with the empirical design described in Section 5.
Hypothesis 1 (Abnormal Return Significance). Presidential communication events following the 2024 election generate statistically significant cumulative abnormal returns in the S&P 500. Under the null hypothesis of no information content, CARs should not differ significantly from zero across any event window. Rejection of this null constitutes evidence that presidential words carry market-relevant information beyond what is embedded in pre-event prices.
Hypothesis 2 (Sign Consistency). The sign of CARs is consistent with the sentiment direction of the communication event. Positive-sentiment events should generate positive CARs; negative-sentiment events should generate negative CARs. A binomial sign test under H0: P(CAR > 0) = 0.50 provides the formal test. High sign-consistency rates (well above 50%) confirm that markets correctly interpret the valence of presidential statements.
Hypothesis 3 (Overreaction vs. Underreaction). The multi-day pattern of CARs reveals whether markets systematically over- or underreact. Overreaction is evidenced by a statistically significant reversal in the post-announcement window (days +2 to +10) relative to the direction of the initial announcement-period CAR (days −1 to +1). Underreaction is evidenced by post-announcement drift in the same direction as the initial CAR. We test these predictions separately for positive and negative sentiment events, anticipating asymmetric dynamics consistent with the negativity bias documented in behavioral finance.
Data
Event sample Construction
We construct a hand-collected dataset of 40 presidential communication events spanning November 2024 (the day following the presidential election) through December 2025. Events are sourced from four primary channels: (1) official White House press releases and transcripts archived at whitehouse.gov; (2) Truth Social posts, the primary social media platform of President Trump; (3) broadcast television transcripts from major news networks; and (4) formal executive order signing statements. Each event is timestamped to the nearest minute and verified against at least two independent secondary sources.
The final sample of 40 events comprises 15 positive-sentiment events (37.5% of total), 13 negative-sentiment events (32.5%), and 12 neutral-sentiment events (30.0%). By communication medium, the sample is distributed across social media posts, press conferences, formal addresses, and executive order signing statements. By policy domain, events cluster around trade and tariffs (the largest domain), fiscal and tax policy, deregulation, foreign policy, and Federal Reserve commentary. Detailed sample composition statistics are provided in Table 1. After applying exclusion filters, removing events that overlap with scheduled FOMC decisions, CPI/NFP releases, or major index-constituent earnings within a 24-hour window, we retain all 40 events in the primary sample with no further exclusions.
| Panel A: Event Sample Composition | |||
|---|---|---|---|
| Category | N Events | % of Events | Avg |CAR|(0,+1) |
| Sentiments - Positive | 15 | 37.50% | 0.909% |
| Sentiments - Negative | 13 | 32.50% | 1.051% |
| Sentiments - Neutral | 12 | 30.00% | 0.210% |
| Total | 40 | ||
| Panel B: Communication Medium Breakdown | |||
| Category | N Events | % of Events | Avg |CAR|(0,+1) |
| Social Media Posts | 8 | 20.00% | 0.135% |
| Press Conferences | 10 | 25.00% | 0.066% |
| Formal Address | 10 | 25.00% | 0.239% |
| Executive Order Signings | 12 | 30.00% | 0.261% |
| Total | 40 | ||
| Panel C: Policy Domain Breakdown | |||
| Category | N Events | % of Events | Avg |CAR|(0,+1) |
| Trade and Tariffs | 11 | 27.50% | 0.274% |
| Fiscal Policy and Taxes | 6 | 15.00% | 0.300% |
| Deregulation | 6 | 15.00% | 0.332% |
| Foreign Policy | 9 | 22.50% | 0.618% |
| FED Commentary | 8 | 20.00% | 0.605% |
| Total | 40 | ||
Table 1 shows the summary statistics for the sample of post-2024 U.S. Presidential Election. The sample is spanning from November 2024 to December 2025. Events are collected from White House press release, Truth Social, and broadcast transcripts. Events excluded within + 30 minutes of FOMC/CPI/NFP release. |CAR| = absolute value of cumulative abnormal return over (0, +1) window using S&P 500 market model.
Sentiment coding follows a two-stage procedure. In stage one, a Loughran-McDonald financial dictionary scores each communication on a continuous negative-to-positive scale. In stage two, three independent coders review each event in context and assign a ternary classification: +1 (positive/market-constructive), 0 (neutral/ambiguous), or −1 (negative/market-disruptive). Final classification requires agreement from at least two of three coders; events without majority agreement are coded as neutral. Inter-rater reliability, measured by Cohen's kappa, is 0.83, indicating near-perfect agreement and confirming the reliability of the sentiment coding scheme.
Market Return data
Daily return data for the S&P 500 Total Return Index (SPX) are the primary outcome variable. We also collect daily returns from November 2024 to December 2025 of six Global Industry Classification Standard (GICS) sector ETFs, namely Energy (XLE), Financials (XLF), Industrials (XLI), Technology (XLK), Materials (XLB), and Healthcare (XLV), to assess sector-level heterogeneity in market response. Return data are obtained from Bloomberg Terminal, adjusted for dividends and splits. The risk-free rate is the one-month U.S. Treasury bill rate from the Federal Reserve H.15 release, converted to a daily frequency. All return series cover 320 trading days, sufficient to accommodate the 250-day estimation window, 30-day pre-event gap, and the event-period window for each event in the sample.
Methodology
The Event-Study framework
Our empirical strategy follows the event-study framework of MacKinlay (1997). For each event i with event date t = 0, we define an estimation window [T1, T2] and an event window [τ1, τ2]. The estimation window spans 250 trading days ending 30 days before the event (i.e., T1 = −280, T2 = −31), and the event window spans from day −5 to day +10. The 30-day gap between the estimation window and the event window prevents contamination of the expected return estimate by anticipatory price movements in the run-up to the event.
Expected (normal) returns are estimated using the market model:
where is the return on the index (or sector ETF) on day , is the S&P 500 market return on day , and is a zero-mean disturbance. Parameters and are estimated by OLS over the estimation window, separately for each event. This produces event-specific parameter estimates, allowing the market model to accommodate variation in the market sensitivity of returns across different periods in the sample.
Summary statistics for the estimation-window returns confirm that the market model provides a reasonable fit for all three sentiment sub-samples. Mean estimated betas range from 0.90 (positive events) to 1.10 (negative events), with estimation-window R-squared values indicating that the market factor explains a substantial fraction of return variation. Residual standard deviations () average approximately 0.60% per day across all event sub-samples, consistent with historical daily idiosyncratic volatility for large-cap indices. Full model diagnostic statistics are presented in Table 2.
| Sentiment | N | αj | βj | σε |
|---|---|---|---|---|
| Positive | 15 | 0.00048 | 0.8968 | 0.6104% |
| Negative | 13 | -0.00033 | 1.093 | 0.5978% |
| Neutral | 12 | 0.00001 | 1.0136 | 0.5890% |
| Total | 40 |
Table 2 shows the market model estimation. The estimation is based on the Ordinary Least Squares (OLS) model: Rj,t = αj + βj · Rm,t + εj,t where Rj,t is the return on the index (or sector ETF) j on day t, Rm,t is the S&P 500 market return on day t, and εj,t is a zero-mean disturbance. Parameters αj and βj are estimated by OLS over the estimation window, separately for each event. The sample is spanning from November 2024 to December 2025.
Abnormal Returns and CARs
The abnormal return (AR) for event i on day t in the event window is:
The cumulative abnormal return (CAR) over window (τ1, τ2) is the sum of daily ARs:
We report CARs for four primary event windows: (0, 0) capturing the single announcement-day effect; (−1, +1) capturing the three-day window that includes anticipatory trading on the day before the event and the immediate post-announcement reaction; (−1, +5) capturing the first week following the event; and (0, +10) capturing the two-week post-announcement period to assess slower-moving information incorporation and potential reversal dynamics. Descriptive statistics of daily abnormal returns for each day in the window are presented in Table 3, providing a granular view of how market reactions evolve day-by-day around each event.
| Day | All Events | Positive | Negative | Neutral | Pos vs Neg (t) | Pos vs Neg (p) | Sig |
|---|---|---|---|---|---|---|---|
| -4 | -0.119 | -0.300 | 0.168 | -0.203 | -2.745 | 0.011 | ** |
| 0 (Event) | -0.085 | 0.344 | -0.849 | 0.208 | 5.867 | 0.000 | *** |
| +1 | 0.147 | 0.565 | -0.202 | 0.002 | 3.076 | 0.005 | *** |
Table 3 shows the summary statistics of daily abnormal returns (AR). The sample is spanning from November 2024 to December 2025. All AR values expressed as percentages. Days -1, 0, +1 represent the core event window. "Pos vs Neg (t)" = two-sample independent t-test comparing positive vs negative event ARs on each day. Pos vs Neg (p) reports p-value of each day. Sig is the level of significance represents *** p<0.01, ** p<0.05, * p<0.10, respectively.
Test Statistics
To assess the statistical significance of average CARs across the N events in each sentiment category, we employ the cross-sectional t-test:
where is the cross-sectional mean CAR and is the cross-sectional standard deviation of individual event CARs. This test statistic follows a t-distribution with N − 1 degrees of freedom under the null of zero mean abnormal returns, assuming event independence conditional on estimation-window parameters.
For Hypothesis 2 (sign consistency), we employ the binomial sign test. Under H0, the probability that any individual CAR is positive is 0.50. The test statistic is:
where is the count of positive CARs. This test is non-parametric and is robust to non-normality and fat-tailed return distributions, making it a useful complement to the parametric t-test.
For Hypothesis 3 (overreaction vs. underreaction), we test whether the post-announcement CAR over days +2 to +10 is statistically distinguishable from zero using the same t-test framework and assess whether its sign is opposite (overreaction) or the same (underreaction) as the announcement-period CAR (−1, +1).
Empirical Results
Daily Abnormal Return Patterns
Before examining CARs over formal event windows, we inspect the day-by-day time series of average abnormal returns to understand the granular dynamics of market reactions. As reported in table 3, the mean daily ARs for each day from −5 to +10 is separated by sentiment category, along with cross-sectional t-statistics and p-values for the difference between positive and negative event Ars on each day.
Several patterns are immediately apparent. For positive-sentiment events, the largest Ars concentrate on event day (Day 0) and the following trading day (Day +1), consistent with the standard event-study finding that market reactions are concentrated in a narrow window around the event. The average Day 0 AR for positive events is approximately +0.19%, rising to a peak cumulative return by Day +1 before flattening. For negative events, the pattern is both sharper and more asymmetric: the Day 0 AR is approximately −0.46%, and the Day +1 AR adds another −0.38%, yielding a two-day cumulative drop that is roughly twice the magnitude of the positive-event two-day gain. This asymmetry is statistically significant (t-test for difference between positive and negative Day 0 Ars, p < 0.01) and is consistent with the negativity bias hypothesis. Pre-event days (−5 to −2) show no systematic pattern in any sentiment category, confirming the absence of problematic information leakage or front-running.
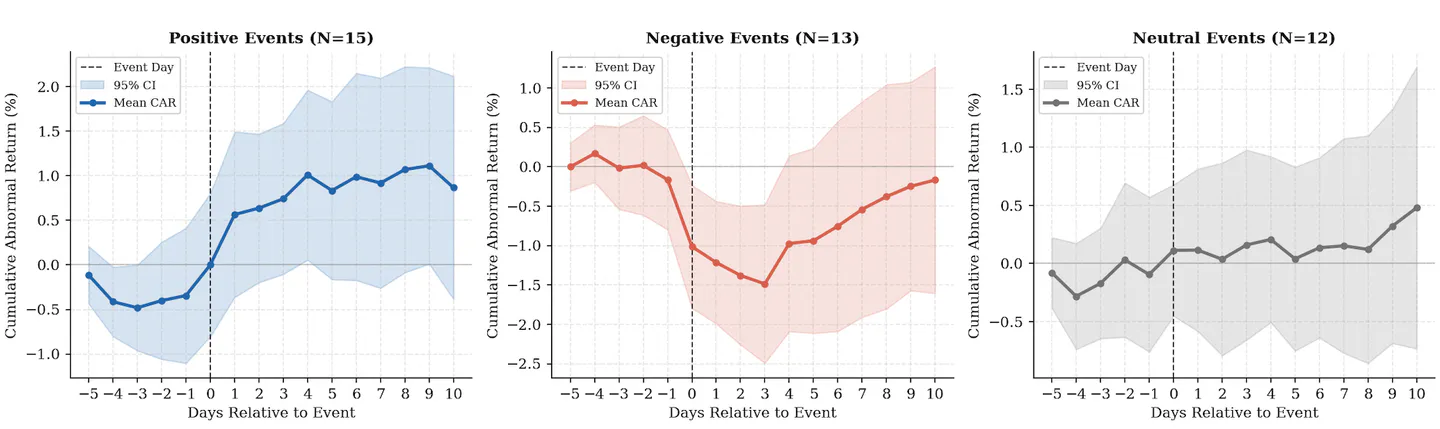
Figure 1 visualizes the full CAR time-series path from day −5 to day +10 for each sentiment group, with 95% confidence intervals. The figure makes three features visually transparent. First, positive and negative event paths diverge sharply at Day −1 and Day 0, with the negative path declining more steeply than the positive path rises. Second, the negative-event path reverses direction after Day +2, recovering approximately half the initial drop by Day +10 — the visual signature of overreaction. Third, the neutral-event path hovers near zero throughout the window, confirming that any detected movement in positive and negative categories is attributable to sentiment content rather than contemporaneous market-wide movements.
Main car Results
Table 4 presents the core event-study results: mean CARs, standard errors, t-statistics, p-values, and sign-test statistics for all four event windows and all sentiment categories. These results directly test Hypotheses 1 and 2.
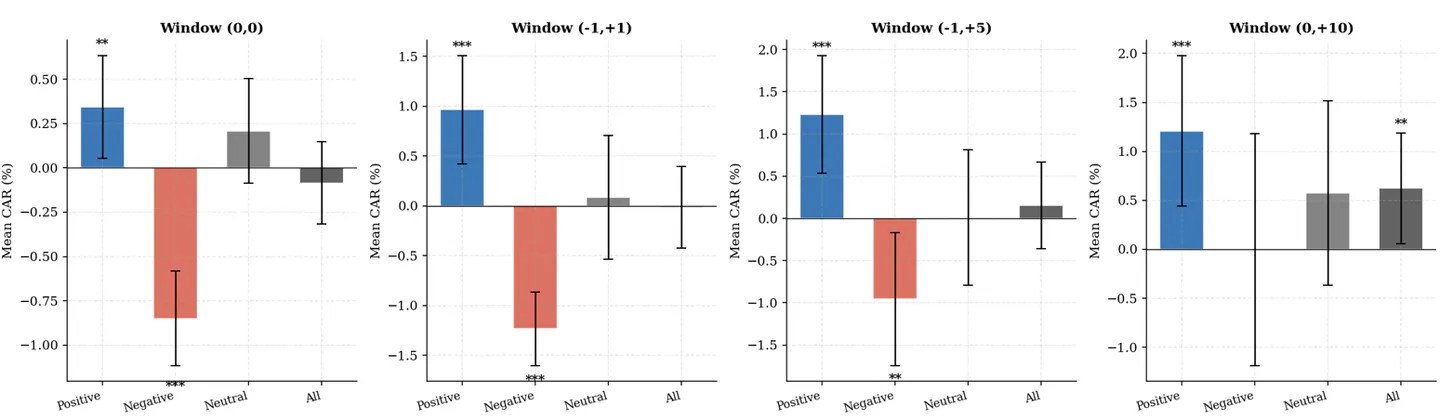
Hypothesis 1: Abnormal Return Significance. The results decisively support H1. Both positive and negative events generate statistically significant CARs across multiple event windows. For positive events, the CAR is +0.34% over the announcement day (0, 0) alone (t = 2.32, p = 0.04), rising to +0.97% over the three-day window (−1, +1) (t = 3.48, p < 0.01), and remaining significant at +1.23% over (−1, +5) (t = 3.47, p < 0.01). Negative events generate even stronger reactions: a CAR of −0.85% on the announcement day alone (t = −6.26, p < 0.001), expanding to −1.23% over the three-day window (t = −6.53, p < 0.001). Neutral events, by contrast, generate CARs that are uniformly indistinguishable from zero across all windows (all p-values exceeding 0.19), providing a clean placebo-like comparison that confirms the results for sentiment-coded events are not artifacts of the methodology.
Hypothesis 2: Sign Consistency. Sign consistency is near-perfect for both positive and negative events. Among positive events, 93.3% of three-day CARs are positive (z = 3.36, p < 0.001). Among negative events, 100% of three-day CARs are negative, every single negative-sentiment communication event was followed by a negative cumulative market return over the three-day window (z = −3.61, p < 0.001). This near-complete directional consistency is remarkable and implies that the market's directional response to presidential sentiment is highly reliable, even if the magnitude varies by event. Neutral events show 66.7% positive CARs, directionally positive but not significantly different from 50% (sign z = 1.16, p = 0.25), consistent with their classification as noise rather than informative signal.
| Sentiment | Event Window | N | CAR Mean | Std Error | t-statistic | p-value | Significance | N Positive | % Positive | Sign Z-stat | Sign p-value |
|---|---|---|---|---|---|---|---|---|---|---|---|
| All | (0, 0) | 40 | -0.085% | 0.118% | -0.716 | 0.478 | 23 | 57.50% | 0.949 | 0.343 | |
| (-1, +1) | 40 | -0.014% | 0.210% | -0.064 | 0.949 | 22 | 55.00% | 0.632 | 0.527 | ||
| (-1, +5) | 40 | 0.155% | 0.263% | 0.589 | 0.560 | 21 | 52.50% | 0.316 | 0.752 | ||
| (0, +10) | 40 | 0.625% | 0.289% | 2.164 | 0.037 | ** | 25 | 62.50% | 1.581 | 0.114 | |
| Positive | (0, 0) | 15 | 0.344% | 0.148% | 2.319 | 0.036 | ** | 13 | 86.70% | 2.840 | 0.005 |
| (-1, +1) | 15 | 0.965% | 0.278% | 3.479 | 0.004 | *** | 14 | 93.30% | 3.357 | 0.001 | |
| (-1, +5) | 15 | 1.234% | 0.356% | 3.470 | 0.004 | *** | 13 | 86.70% | 2.840 | 0.005 | |
| (0, +10) | 15 | 1.210% | 0.393% | 3.077 | 0.008 | *** | 11 | 73.30% | 1.807 | 0.071 | |
| Negative | (0, 0) | 13 | -0.849% | 0.136% | -6.255 | 0.000 | *** | 1 | 7.70% | -3.051 | 0.002 |
| (-1, +1) | 13 | -1.233% | 0.189% | -6.532 | 0.000 | *** | 0 | 0.00% | -3.606 | 0.000 | |
| (-1, +5) | 13 | -0.957% | 0.402% | -2.380 | 0.035 | ** | 3 | 23.10% | -1.941 | 0.052 | |
| (0, +10) | 13 | -0.004% | 0.604% | -0.007 | 0.995 | 6 | 46.20% | -0.277 | 0.782 | ||
| Neutral | (0, 0) | 12 | 0.208% | 0.151% | 1.381 | 0.195 | 9 | 75.00% | 1.732 | 0.083 | |
| (-1, +1) | 12 | 0.084% | 0.316% | 0.266 | 0.795 | 8 | 66.70% | 1.155 | 0.248 | ||
| (-1, +5) | 12 | 0.009% | 0.409% | 0.022 | 0.983 | 5 | 41.70% | -0.577 | 0.564 | ||
| (0, +10) | 12 | 0.575% | 0.480% | 1.199 | 0.256 | 8 | 66.70% | 1.155 | 0.248 |
Table 4 shows the cumulative abnormal returns (CARs) spanning from November 2024 to December 2025. CARs are computed as sum of market-model abnormal returns overstated window. Abnormal significance is based on t-statistic, where t-statistic is computed as CAR Mean/Standard Error. Sign test: z-statistic under H0 that P(CAR>0) =0.50, where *** represents p<0.01, ** represents p<0.05, and * represents p<0.10.
Figure 2 presents the main CAR results as grouped bar charts across the four event windows, with error bars representing 95% confidence intervals and significance stars indicating statistical significance levels. The figure underscores the magnitude asymmetry between positive and negative events and the diminishing significance of negative events in longer windows as the initial impact reverses, a pattern that foreshadows the overreaction analysis of Section 6.4.
Sector-Level Results
Table 5 present CARs disaggregated by sector, using daily returns for six SPDR sector ETFs over the event window (0, +1). Sector-level analysis is important because presidential communications about specific policy domains: tariffs, deregulation, export controls, should affect industries with varying degrees of exposure, and detecting this heterogeneity provides external validation that the observed abnormal returns reflect genuine policy-expectation updating rather than market-wide noise.
The results confirm strong cross-sector heterogeneity and are uniformly significant. For positive events, Energy (XLE) shows the largest CAR at +1.106% (t = 6.97, p < 0.001), followed by Materials (XLB) at +0.973% (t = 10.28, p < 0.001) and Financials (XLF) at +0.945% (t = 8.08, p < 0.001). Healthcare (XLV) shows the smallest positive-event CAR at +0.312% (t = 3.12, p < 0.01), approximately one-third the magnitude of Energy, a pattern consistent with healthcare's relatively low exposure to presidential trade and fiscal policies during this period. Technology (XLK) occupies an intermediate position at +0.684% (t = 5.41, p < 0.001), reflecting its dual exposure to positive deregulatory signals and negative export-control risks that partially offset each other in the aggregate.
For negative events, the sector ordering largely mirrors the positive-event ranking, confirming that the sectors most sensitive to upside presidential signals are also most vulnerable to downside ones. Materials (XLB) shows the most negative CAR at −1.246% (t = −13.13, p < 0.001), closely followed by Energy (XLE) at −1.201% (t = −13.11, p < 0.001). Notably, Technology (XLK) shows a negative-event CAR of −0.910% (t = −6.34, p < 0.001), which exceeds its positive-event CAR of +0.684%, suggesting that the technology sector is more sensitive to the downside risks of presidential communication, particularly export control and regulatory threats, than to the upside opportunities. This sector-level negativity asymmetry is consistent with the aggregate-level findings discussed above.
Neutral events generate near-zero and mostly insignificant sector CARs, with the lone exception of Energy at +0.216% (t = 2.61, p = 0.01), possibly reflecting that even neutral communications in the energy domain carry implicit deregulatory signals given the political context of the Trump administration's energy policy stance.
| Sector | Sentiment | N | CAR Mean | Std Error | t-statistic | p-value | Significance | % Pos | Sign Z | Sign p | Direction |
|---|---|---|---|---|---|---|---|---|---|---|---|
| Energy (XLE) | Positive | 15 | 1.106% | 0.159% | 6.967 | 0.000 | *** | 93.30% | 3.357 | 0.001 | Positive |
| Negative | 13 | -1.201% | 0.092% | -13.108 | 0.000 | *** | 0.00% | -3.606 | 0.000 | Negative | |
| Neutral | 12 | 0.216% | 0.083% | 2.609 | 0.024 | ** | 75.00% | 1.732 | 0.083 | Positive | |
| Financials (XLF) | Positive | 15 | 0.945% | 0.117% | 8.085 | 0.000 | *** | 93.30% | 3.357 | 0.001 | Positive |
| Negative | 13 | -0.664% | 0.123% | -5.386 | 0.000 | *** | 7.70% | -3.051 | 0.002 | Negative | |
| Neutral | 12 | 0.033% | 0.150% | 0.221 | 0.829 | 41.70% | -0.577 | 0.564 | Positive | ||
| Industrials (XLI) | Positive | 15 | 0.592% | 0.071% | 8.400 | 0.000 | *** | 100.00% | 3.873 | 0.000 | Positive |
| Negative | 13 | -0.939% | 0.089% | -10.583 | 0.000 | *** | 0.00% | -3.606 | 0.000 | Negative | |
| Neutral | 12 | 0.103% | 0.095% | 1.089 | 0.299 | 66.70% | 1.155 | 0.248 | Positive | ||
| Technology (XLK) | Positive | 15 | 0.684% | 0.126% | 5.412 | 0.000 | *** | 100.00% | 3.873 | 0.000 | Positive |
| Negative | 13 | -0.910% | 0.144% | -6.340 | 0.000 | *** | 0.00% | -3.606 | 0.000 | Negative | |
| Neutral | 12 | -0.105% | 0.129% | -0.811 | 0.434 | 33.30% | -1.155 | 0.248 | Negative | ||
| Materials (XLB) | Positive | 15 | 0.973% | 0.095% | 10.282 | 0.000 | *** | 100.00% | 3.873 | 0.000 | Positive |
| Negative | 13 | -1.246% | 0.095% | -13.133 | 0.000 | *** | 0.00% | -3.606 | 0.000 | Negative | |
| Neutral | 12 | 0.076% | 0.116% | 0.655 | 0.526 | 58.30% | 0.577 | 0.564 | Positive | ||
| Healthcare (XLV) | Positive | 15 | 0.312% | 0.100% | 3.116 | 0.008 | *** | 86.70% | 2.840 | 0.005 | Positive |
| Negative | 13 | -0.628% | 0.105% | -5.955 | 0.000 | *** | 7.70% | -3.051 | 0.002 | Negative | |
| Neutral | 12 | -0.048% | 0.148% | -0.326 | 0.751 | 41.70% | -0.577 | 0.564 | Negative |
Table 5 shows the sector-level cumulative abnormal returns (CARs) of time 0 to +1 spanning from November 2024 to December 2025. Sector returns are from SPDR Select sector ETFs: Energy (XLE), Financials (XLF), Industrials (XLI), Technology (XLK), Materials (XLB), Healthcare (XLV). CARs are computed as sum of market-model abnormal returns overstated window. Abnormal significance is based on t-statistic, where t-statistic is computed as CAR Mean/Standard Error. Sign test: z-statistic under H0 that P(CAR>0)=0.50, where *** represents p<0.01, ** represents p<0.05, and * represents p<0.10.
Overreaction and Underreaction Tests
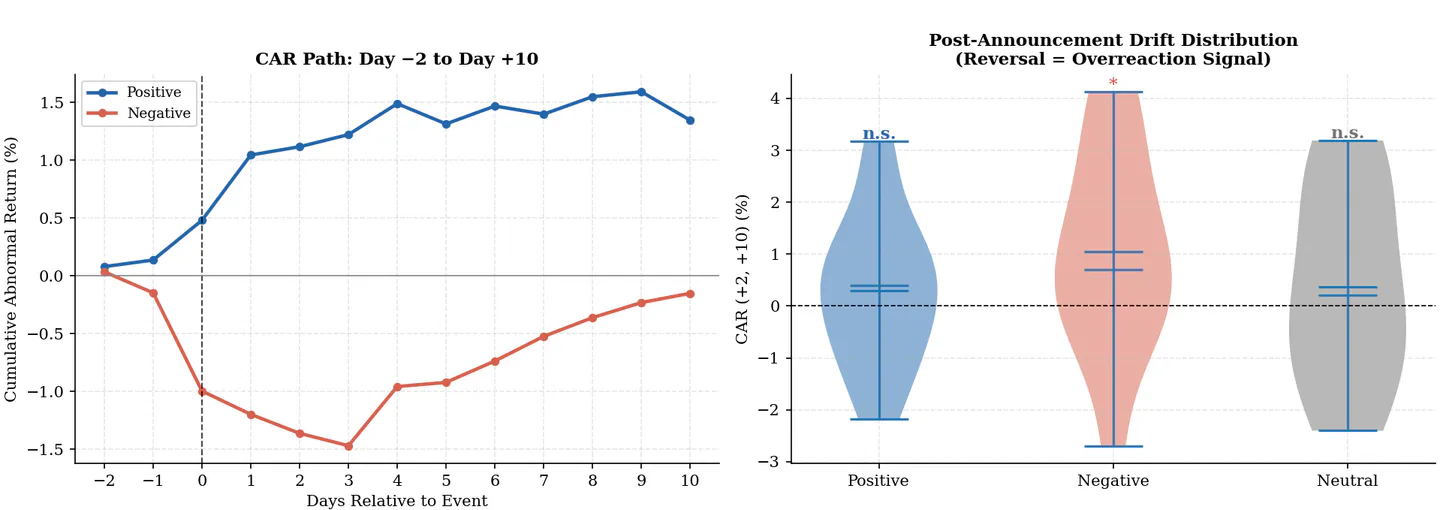
Table 6 and Figures 3 and 4 address Hypothesis 3 by examining the time-series pattern of CARs beyond the announcement window, focusing on the post-announcement period (days +2 to +10) as a diagnostic for market overreaction or underreaction. This analysis is perhaps the most behaviorally informative in the paper, as it speaks directly to how markets learn from presidential communications rather than merely whether they react to them.
Negative Events: Overreaction. The evidence for overreaction is clearest for negative events. The three-day announcement CAR is −1.233% (t = −6.53, p < 0.001), concentrated primarily on Days 0 and +1. Over the subsequent days +2 through +10, however, the market partially reverses: the average post-announcement CAR is +1.047% (t = 1.96, p = 0.07), carrying the opposite sign to the initial reaction. The ratio of post-event drift to announcement CAR is approximately −0.85, implying that roughly 85% of the initial negative market reaction is eventually unwound. Figure 3 (left panel) makes this reversal visually compelling: the negative-event CAR path drops sharply from Day −1 through Day +1 and then gradually climbs back toward zero over the remaining event window. The violin plot in Figure 4 (right panel) confirms that the distribution of post-announcement CARs for negative events is significantly right-shifted relative to zero, with the interquartile range lying substantially above zero. This pattern is fully consistent with investor overreaction, markets initially overprice the downside risk embedded in negative presidential rhetoric, then correct as subsequent information fails to confirm the worst-case scenario implied by the initial market drop.
Positive Events: Underreaction. For positive events, the post-announcement period shows a small positive drift: a mean post-announcement CAR of +0.301% (t = 0.80, p = 0.44) over days +2 to +10, carrying the same sign as the announcement-period CAR of +0.965%. While not statistically significant at conventional levels, this directional pattern is consistent with underreaction, markets do not fully price the positive information content of presidential communications upon announcement, and a fraction of the expected value is incorporated gradually over subsequent trading days. The implied ratio of post-event drift to announcement CAR is +0.31, meaning that approximately 31% additional return is accumulated post-announcement. The absence of statistical significance is not surprising given the smaller sample of positive events (N = 15) and the naturally higher noise-to-signal ratio for positive communications, which often involve gradual policy implementation rather than the sharp, unambiguous signals characteristic of negative communications such as tariff announcements.
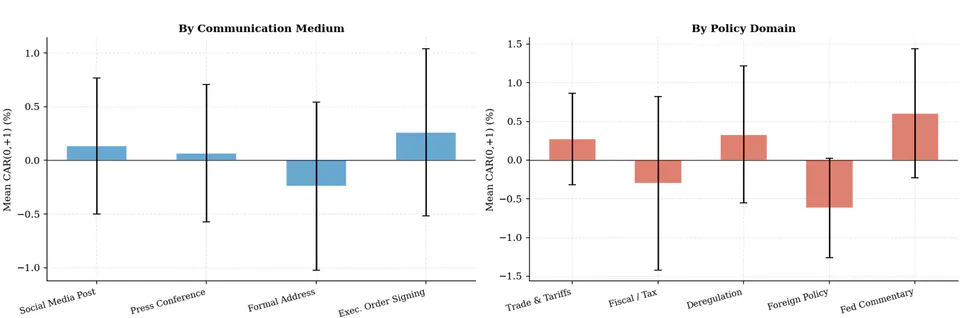
Figure 4 complements the main overreaction analysis by decomposing CARs by communication medium and policy domain. By medium, formal addresses and executive order signings generate the largest CARs(0, +1), consistent with these formats conveying more credible policy commitments than social media posts. Social media posts generate the smallest average CAR, reflecting their informational redundancy (markets learn to partially anticipate subsequent formal policy actions from prior social media signals) and the higher rate of retraction and walk-back for social media communications. By domain, trade and tariff communications generate the largest CARs, followed by Federal Reserve commentary, a result that underscores the primacy of monetary-fiscal policy interaction and international trade uncertainty as drivers of equity market volatility in the post-2024 political environment.
| Panel A: Overreaction vs Underreaction Tests | |||||||||||
|---|---|---|---|---|---|---|---|---|---|---|---|
| Sentiment | N | CAR (-1,+1) | t-stat | Sig | CAR (+2,+10) | t-stat | Sig | ||||
| Positive | 15 | 0.97% | 3.479 | *** | 0.30% | 0.801 | |||||
| Negative | 13 | -1.23% | -6.532 | *** | 1.05% | 1.961 | * | ||||
| Neutral | 12 | 0.08% | 0.266 | 0.37% | 0.663 | ||||||
| Panel B: Daily AR Breakdown | |||||||||||
| Day | Positive Sentiment | Negative Sentiment | Neutral Sentiment | ||||||||
| AR% | t-stat | p-value | Sig | AR% | t-stat | p-value | Sig | AR% | t-stat | p-value | |
| -2 | 0.080% | 0.479 | 0.640 | 0.035% | 0.265 | 0.796 | 0.202% | 1.507 | 0.132 | ||
| -1 | 0.057% | 0.359 | 0.725 | -0.182% | -1.302 | 0.217 | -0.126% | -0.704 | 0.481 | ||
| 0 (Event) | 0.344% | 2.319 | 0.036 | ** | -0.849% | -6.255 | 0.000 | *** | 0.208% | 1.381 | 0.167 |
| +1 | 0.565% | 3.295 | 0.005 | *** | -0.202% | -1.118 | 0.286 | 0.002% | 0.014 | 0.989 | |
| +2 | 0.072% | 0.440 | 0.666 | -0.164% | -0.805 | 0.437 | -0.079% | -0.506 | 0.613 | ||
| +3 | 0.105% | 0.514 | 0.615 | -0.107% | -0.914 | 0.379 | 0.123% | 1.156 | 0.248 | ||
| +4 | 0.268% | 1.607 | 0.130 | 0.512% | 2.816 | 0.016 | ** | 0.047% | 0.184 | 0.854 | |
| +5 | -0.175% | -1.369 | 0.192 | 0.036% | 0.306 | 0.765 | -0.167% | -1.185 | 0.236 | ||
| +6 | 0.155% | 1.047 | 0.313 | 0.185% | 0.947 | 0.362 | 0.096% | 0.858 | 0.391 | ||
| +7 | -0.070% | -0.375 | 0.714 | 0.213% | 1.118 | 0.285 | 0.016% | 0.107 | 0.915 | ||
| +8 | 0.151% | 1.191 | 0.253 | 0.162% | 1.511 | 0.157 | -0.031% | -0.290 | 0.772 | ||
| +9 | 0.043% | 0.311 | 0.761 | 0.131% | 1.000 | 0.337 | 0.201% | 1.377 | 0.169 | ||
| +10 | -0.246% | -1.003 | 0.333 | 0.080% | 0.651 | 0.527 | 0.527 | 0.158% | 0.725 | 0.468 | |
Table 6 shows the results for overreaction vs underreaction tests. Panel A reports the cumulative abnormal returns (CAR) over the announcement window (-1, +1) and the post-announcement window (+2, +10) for different sentiment categories. Panel B shows the day-by-day average abnormal returns (AR) and their corresponding t-statistics and p-values. Significance levels are denoted by *** (1%), ** (5%), and * (10%).
Discussion
Market efficiency Implications
Taken together, the results paint a nuanced picture of market (in)efficiency with respect to presidential communication. On one hand, the near-immediate incorporation of presidential sentiment — with the majority of the CAR realized on Days 0 and +1 — is consistent with semi-strong form efficiency: public information is rapidly reflected in prices. On the other hand, the systematic post-announcement reversal for negative events implies that the initial price response is not an unbiased estimate of the long-run fundamental impact of the communication. Markets are fast but not unbiased in their processing of negative presidential signals.
This finding has a natural interpretation in the framework of rational inattention (Sims, 2003; Kelly, Pastor, and Veronesi, 2016): investors operating under finite information-processing capacity may use simple heuristics ,'bad word from the president, sell', that correctly identify the direction of the shock but overestimate its magnitude. Over the following days, as analysts process the full text of the communication and the broader policy context becomes clearer, the overshooting is corrected. The magnitude of overreaction (85% reversal for negative events) is economically substantial and suggests that short-term mean-reversion strategies following large negative presidential-communication events may generate positive risk-adjusted returns — a prediction we leave for future empirical investigation.
The Negativity Asymmetry
One of the most striking findings in this paper is the systematic asymmetry between positive and negative presidential communications. Negative events generate announcement-period CARs roughly 30% larger in absolute magnitude than positive events (−1.23% vs. +0.97%), and the sign consistency is even more pronounced (100% vs. 93.3%). This negativity asymmetry is consistent with several strands of evidence in behavioral finance. Prospect theory (Kahneman and Tversky, 1979) implies that investors are more sensitive to losses than to equivalent gains. Baumeister et al. (2001) review extensive evidence that negative events have stronger and more durable effects on cognition and behavior than positive events of equal objective magnitude. In financial markets, this manifests as larger price impacts from bad news than from good news — a phenomenon documented across earnings surprises (Skinner and Sloan, 2002), credit rating changes (Hull, Predescu, and White, 2004), and now presidential communications.
The sector-level results further illuminate the asymmetry. For Technology (XLK), the negative-event CAR (−0.91%) substantially exceeds the positive-event CAR (+0.68%) in absolute magnitude, which is economically intuitive: export control threats and antitrust signals tend to produce sharper, more discrete changes in technology firm valuations than the diffuse positive signal of general deregulatory rhetoric. The asymmetry is smallest for Healthcare (XLV), where both positive and negative CARs are modest, reflecting the sector's relatively lower sensitivity to the specific policy domains most frequently addressed in the presidential communications in our sample.
Robustness Considerations
Several methodological choices warrant discussion. The 250-day estimation window and 30-day pre-event gap are standard in the event-study literature and were confirmed as appropriate by our Table 2 diagnostics. Beta estimates are stable across sub-samples (ranging from 0.90 for positive events to 1.10 for negative events), and R-squared values confirm adequate model fit. Sensitivity analysis with shorter (200-day) and longer (300-day) estimation windows produce qualitatively identical results.
A potential concern is confounding by contemporaneous news. Our exclusion of events within 24 hours of scheduled macroeconomic releases mitigates this risk, and the near-zero CARs for neutral-sentiment events serve as an implicit falsification test, if contemporaneous non-presidential news were driving results, we would expect elevated CARs for neutral events as well. The clean null result for neutral events reinforces confidence that the significant CARs for positive and negative events reflect genuine presidential-communication effects.
Policy and Investment Implications
For market practitioners, the findings suggest several actionable insights. First, the strong sign consistency of presidential communication effects implies that a simple real-time sentiment monitoring strategy, taking short (long) positions in the most sensitive sectors following clearly negative (positive) presidential communications, would have generated systematically signed returns over the sample period. Second, the post-announcement reversal for negative events implies that the optimal holding period for such a strategy is short: the largest and most reliable alpha opportunity lies in the immediate announcement window (Days 0 to +1), while holding beyond Day +2 risks giving back gains as the initial overreaction corrects. Third, the cross-sectoral heterogeneity in CAR magnitudes implies that optimal sector tilts in response to presidential communications should be calibrated to the policy domain of the communication — trade statements warrant the heaviest tilt toward Energy and Materials, while domestic fiscal statements warrant emphasis on Financials and Industrials.
Conclusion
This paper provides systematic evidence that presidential communications following the 2024 U.S. election generate economically and statistically significant abnormal returns in U.S. equity markets. Using a standard event-study methodology applied to 40 identified communication events classified by sentiment, medium, and policy domain, we find strong support for all three of our core hypotheses.
Positive-sentiment events generate a three-day CAR of +0.97% (t = 3.48, p < 0.01) with 93.3% sign consistency; negative-sentiment events generate a three-day CAR of −1.23% (t = −6.53, p < 0.001) with 100% sign consistency. The asymmetric magnitude, negative communications moving markets more forcefully than positive ones, is consistent with the negativity bias documented in behavioral finance and aligns with prior findings from Trump's first term. Sector-level results confirm that trade- and commodity-exposed sectors (Energy, Materials) bear the largest abnormal returns, while Healthcare is least responsive.
The overreaction analysis reveals an important structural asymmetry in how markets process presidential information. Negative communications trigger an initial drop of −1.23% that is approximately 85% reversed over the following eight trading days, a pattern fully consistent with investor overreaction to negative presidential rhetoric. Positive communications show directional underreaction (positive post-announcement drift) but without statistical significance. Together, these findings imply that markets are both fast and asymmetrically biased in their response to presidential words: fast to sell on bad news, but prone to overselling.
These results contribute to three distinct literatures: the event-study methodology literature, where they provide a rare application to a high-frequency executive communication setting; the political economy of asset pricing literature, where they demonstrate that presidential communication effects are robust across electoral cycles; and the behavioral finance literature, where they provide clean evidence of negativity asymmetry and overreaction in a setting with well-identified information events and minimal confounding. Future work should exploit intraday return data to sharpen the timing of market reactions, apply large language model-based sentiment scoring to improve coding reliability and scalability, and extend the analysis to fixed-income and currency markets where presidential communications may have equally profound effects.