
I. INTRODUCTION
Diabetes mellitus (DM) is the most prevalent chronic metabolic disease worldwide and a significant public health concern(1), with rapid increases and a considerable impact on individual wellbeing and healthcare costs (2-4). According to the International Diabetes Federation (IDF), one in 10 people globally (537 million) has diabetes (5,6) and approximately four million die from the disease each year. The projection for 2045 is that 783 million adults will be living with the condition (5-8).
DM affects people of different ages and genders and is a complex disease involving both genetic and environmental factors. The most common types are type 1 (DM1) and type 2 (DM2), with the latter accounting for of cases, and there is a higher risk of death from complications compared to healthy individuals (9).
Besides generating severe consequences due to the emergence of problems and complications, DM exerts an enormous impact on human physiology as well as cognitive, psychological, and social functioning (10-12). This disease incurs a significant social and economic burden, encompassing medical expenses, productivity loss, premature death, and intangible costs, such as diminished quality of life in many populations (11,13,14).
Capillary blood glucose measurements are essential for managing diabetes. However, the limitations of these assessments include poor patient adherence, physicians often encountering incomplete data, with few values measured throughout the day and scattered across irregular records, and patients and/or family members frequently forgetting to bring the blood glucose log to appointments (15,16) Additionally, difficulties in making lifestyle changes can lead to adverse effects in daily life, such as low self-esteem, anxiety, and depression, which directly affect quality of life (17).
The quality of life (QoL) is recognised as a vital aspect of health, associated with psychological wellbeing, mental health, stress, and personal experiences (18). However, perceptions of illness tend to become more negative when individuals have more comorbidities and depend more on others, which, in turn, impacts their QoL (19). Complications of DM increase morbidity and mortality, functioning as a stressor for the body (20). Over the years, many studies have demonstrated the detrimental effects on QoL in people with diabetes mellitus and severe or irreversible complications and comorbidities (4,6,12,17,19,21).
Psychological stress has increasingly been recognised as a risk factor for developing type 2 diabetes. Living with this diagnosis can also cause stress, as treatment requires constant discipline and can trigger fears related to hypoglycaemia and uncertainty about the future. These factors contribute to a cycle of emotional insecurity that can further worsen a person's psychological state (20). Evidence shows that external stressors, unsafe environments, and a poor understanding of the disease can disrupt glucose metabolism. If a stressor is perceived as negative, it is less about how often it occurs and more about how one interprets it and how it impacts or interferes with one's life (20, 22)
To measure stress in individuals with type 1 and type 2 diabetes, German researchers developed the Questionnaire on Stress in Diabetic Patients - Revised (QSD-R) in 1996. The final English version includes 45 items across eight domains. Given the limited availability of instruments in Brazil for assessing stress in people with diabetes, translating and culturally adapting the QSD-R in Brazil could provide a reliable and reproducible scale for collecting and analysing data on the stress experienced by these individuals, thereby contributing to the reorganisation of care practices. Therefore, the present study aimed to examine the psychometric properties of the Brazilian version of the Questionnaire on Stress in Diabetic Patients - Revised (QSD-R).
II. METHODS
a) Study Design
A methodological study with a quantitative approach was conducted at two public primary health care services and a private endocrinology clinic in the state of São Paulo, Brazil, from May 2023 to October 2024, following authorisation from the creator of the instrument.
b) Population of Study
The sample was selected by convenience and included individuals of both sexes aged 18 years and above with a diagnosis of diabetes mellitus who agreed to participate in the study. Illiterate individuals were excluded. Although there is no gold standard for validating a new instrument, it is recommended that the sample size be at least four to ten times the number of items, with a minimum of 180 individuals, to ensure adequate validity (23, 24). The invitation to participate in the study was extended after a medical appointment at an endocrinology clinic and by health professionals at public health services.
c) Data Collection Procedures
Three instruments were used for data collection. The Questionnaire on Stress in Diabetic Patients - Revised (QSD-R) comprises 45 items divided into eight domains: leisure time; depression; hypoglycaemia issues; self-medication; physical complaints; work; partner relationships; and doctor-patient relationships (22). Reliability, measured by Cronbach's alpha, ranged from 0.69 to 0.81. Each item describes a potential negative effect on daily life and is rated on a numerical scale from 0 to 5. The total score spans from 0 to 225, with each item rated from "not applicable" to "a very big problem" for each statement (22).
The second instrument applied was the Diabetes-39 Quality of Life Assessment Questionnaire (D-39), which has been adapted and validated for use in the Brazilian context and was reduced to 21 items (D-21). The instrument is originally in English and specifically conceived to assess health-related QoL in individuals with DM2. The validation and adaptation for Brazil had good internal consistency, with Cronbach's alpha of 0.917. The instrument in its final version in Portuguese (25) has 21 items distributed among four dimensions of quality of life: energy and mobility (Items 9; 10; 11; 29; 32; 34; 36), diabetes control and social burden (Items 5; 15; 17; 24; 28; 19; 20; 26), anxiety and worry (Items 2; 8; 22), and sexual functioning (Items 21; 23; 30). The D-21 also has a general assessment domain (two items) that encompasses the self-perception of QoL and diabetes severity (26). The instrument enables respondents to state how much their QoL was affected in the previous month by a particular action or activity, which is expressed in each item by placing an X on a point of the scale represented by a continuous line, with spaces occupied by numbers from 1 to 7, with 1 corresponding to QoL absolutely unaffected and 7 corresponding to significantly affected (25, 26).
The Hospital Anxiety and Depression Scale (HADS) was also utilised. This scale is divided into two subscales, each comprising seven items. Using defined values, the subscales indicate different levels of anxiety or depression: ; ; ; (27).
The authors developed an instrument to characterise participants using 14 categorical variables and sociodemographic data, including age, sex, marital status, education, occupation, number of residents in the household, family income, age at diagnosis of DM, type of diabetes, duration of diabetes treatment, insulin use, comorbidities, risk factors, tobacco use, alcohol consumption, psychoactive substance use, weight, height, and body mass index. The average response time was 15 minutes.
For the assessment of temporal stability, a retest was conducted with 20 individuals. For this, the random selection method was used, and the instrument was completed a second time between 14 and 20 days after the first interview (28).
d) Statistical Analysis
i. Descriptive Analysis
All variables were analysed descriptively. Normality of the distribution was assessed using the Kolmogorov-Smirnov test (29).
ii. Exploratory Factor Analysis
The Kaiser-Meyer-Olkin (KMO) test and Bartlett's test of sphericity were used to evaluate the suitability of the sample for factor analysis. These statistical procedures assess whether factor analysis is appropriate, indicating the sample's adequacy and the data's factorability. The criteria for adequacy were a KMO value above 0.50 and a statistically significant result on Bartlett's test of sphericity (30).
Horn's parallel analysis was utilised to test the hypothesis regarding the number of factors adopted by each scale, with the minimum residual factorisation method (MINRES) summarised by a scree plot. The traditional correlation matrix and Oblimin rotation were used to identify the latent structure of the scale. Factor loadings, commonality, complexity of the original items, cumulative variance, and the objective function were derived from exploratory factor analysis (EFA). In the factor extraction step, two criteria were adopted for the retention of factors: an absolute factor loading greater than 0.30 and the presence of at least three items per factor.
iii. Confirmatory Factor Analysis
In confirmatory factor analysis (CFA), multiple fit indices were used to evaluate how well the model fits the observed data. The comparative fit index (CFI) and Tucker-Lewis index (TLI) were utilised, with values ranging from 0.90 to 0.95 indicating an acceptable fit, while values of 0.95 or higher suggest a good fit. The root mean square error of approximation (RMSEA) was considered to indicate good fit when between 0.05 and 0.08, with . The standardised root mean square residual (SRMR) was also analysed, with acceptable values set at . The confirmatory factor minimum discrepancy (CMIN) and the CMIN/degrees of freedom ratio were also estimated. Standardised loadings were deemed adequate when exceeding 0.30 (31).
iv. Convergent Validity
In the absence of an equivalent instrument that could be considered the "gold standard" and that met the criteria of methodological excellence required for the present study, the Quality of Life Scale for Patients with Diabetes and the Hospital Anxiety and Depression Scale were used as parameters for analysing convergent validity. The normal distribution of the data justified the use of Pearson's correlation coefficients, which were interpreted as follows: , 0.4 to 0.6, and , indicating weak, moderate, and strong correlations, respectively (29).
v. Reliability
Reliability was assessed using internal consistency with Cronbach's alpha coefficient (32) and test-retest stability with the intraclass correlation coefficient (ICC) (33), with values above 0.7 considered acceptable for both (32, 33).
The data were analysed using the Statistical Package for the Social Sciences (SPSS) and the R platform for statistical computing, version 4.1.2. The level of significance was set at .
e) Ethical Aspects
This study received authorisation from the authors of the original study and approval from the Human Research Ethics Committee (protocol number: 56981522.0.0000.5411; approval certificate number: 5.333.924). The study was conducted following the guidelines of the Strengthening the Reporting of Observational Studies in Epidemiology (STROBE) (34) and Guidelines for the Process of Cross-Cultural Adaptation of Self-Report Measures(35).
III. RESULTS
a) Characterisation of the Sample
i. Sociodemographic Data
The sample comprised 315 participants diagnosed with diabetes. Most were women ; ). The average age was years. Married individuals ; and those with higher education ; were predominant. Slightly over half of the sample ; had a medical insurance plan or private healthcare. Regarding monthly family income, 84 earned between five and ten thousand Reais (Brazilian currency) (Table 1).
| Variable | n | % |
| Type of Care | ||
| Insurance/Private | 166 | 52.7 |
| Public | 149 | 47.3 |
| Age | ||
| Mean | 59.10 | 49** |
| SD* | ±13.86 | |
| Sex | ||
| Male | 125 | 60.3 |
| Female | 190 | 39.7 |
| Marital Status | ||
| Single | 38 | 12.1 |
| Married/Stable Union | 202 | 64.1 |
| Separated/Widowed | 75 | 23.8 |
| Monthly Family Income | ||
| < R$ 1,000 | 7 | 2.2 |
| R$ 1,000 to R$ 3,000 | 82 | 26.0 |
| R$ 3,000 to R$ 5,000 | 82 | 26.0 |
| R$ 5,000 to R$ 10,000 | 84 | 26.7 |
| >R$ 10,000 | 60 | 19.0 |
| Schooling | ||
| Primary School | 77 | 24.5 |
| High School | 100 | 31.8 |
| Higher Education | 137 | 43.6 |
| Non-demographic variables | n | % |
| Residents in same home | ||
| Lives alone | 49 | 15.7 |
| Lives with partner | 111 | 35.5 |
| Three to five residents | 148 | 47.3 |
| Six or more residents | 5 | 1.6 |
| Time since diagnosis | ||
| < 1 year | 21 | 6.7 |
| 1 to 5 years | 48 | 15.3 |
| 6 to 10 years | 69 | 22.0 |
| 11 to 20 years | 97 | 30.9 |
| > 21 years | 79 | 25.2 |
| Duration of treatment for DM | ||
| < 1 year | 30 | 9.6 |
| 1 to 5 years | 57 | 18.2 |
| 6 to 10 years | 66 | 21.0 |
| > 11 years | 161 | 51.3 |
| Type of DM | ||
| Type 1 | 54 | 17.1 |
| Type 2 | 261 | 82.9 |
| Use de insulin | ||
| Not used | 199 | 63.2 |
| < 1 year | 18 | 5.7 |
| 1 to 5 years | 27 | 8.6 |
| 6 to 10 years | 18 | 5.7 |
| > 11 years | 53 | 16.8 |
| Comorbidities | ||
| None | 126 | 40.0 |
| Some type of comorbidity | 189 | 60.0 |
| Risk Factor | ||
| None | 134 | 42.5 |
| Some risk factor | 181 | 57.5 |
b) Construct Validity
Step: Confirmatory Factor Analysis
Confirmatory factor analysis was performed using an initial model with five dimensions, based on robust error estimates. However, the final model did not fit well: comparative fit index (CFI): 0.786; robust Tucker-Lewis index (TLI): 0.768; RMSEA: 0.083. Reliability estimated by Cronbach's Alpha for the entire instrument was 0.96.
Step: Exploratory Factor Analysis (EFA)
The results of the Kaiser-Meyer-Olkin (KMO) test (0.95) and Bartlett's test of sphericity
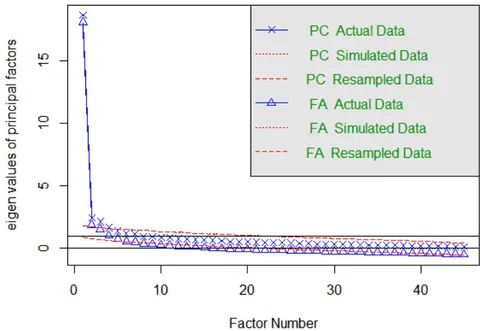
confirmed the adequacy of the sample for EFA. Among the 315 individuals, 44 were identified as outliers based on the distribution of the Mahalanobis distance. However, removing these individuals did not affect the KMO value. Horn's parallel analysis identified five oblique factors with eigenvalues greater than 1.0 (Figure 1).
EFA was performed to identify how the items clustered across the five factors (Table 2). After the first round of exploratory analysis, Items 10, 17, 18, 4, 14, and 20 were removed because they had loadings above 0.3 on more than one factor, and Items 11, 24, 25, 39, and 40 were eliminated due to loadings below 0.3. As a result, 34 questions remained, each with loadings of 0.3 or higher on only one factor, distributed across five domains with at least three items in each domain. Factor 1 contained the highest number of variables, with a total of eight items.
The instrument accounted for of the variance in the data. Communality values ranged from 0.26 (Q40) to 0.79 (Item 42), indicating varying levels of explanation for the factors within the items. Table 2 shows the factor loadings, commonality (h2), and complexity (com) of the EFA.
| ML 1 | ML 2 | ML 3 | ML 4 | ML 5 | H 2 | com | % Variance | |
| Item 1 | 0.03 | 0.08 | 0.00 | 0.04 | 0.66 | 0.53 | 1.0 | 4.34% |
| Item 2 | 0.20 | -0.03 | 0.14 | 0.12 | 0.50 | 0.55 | 1.6 | 2.73% |
| Item 3 | -0.20 | 0.14 | 0.25 | 0.23 | 0.30 | 0.35 | 4.1 | 1.94% |
| Item 4 | 0.39 | -0.11 | 0.72 | 0.23 | 0.28 | 0.42 | 2.7 | 1.73% |
| Item 5 | 0.03 | -0.07 | 0.72 | 0.13 | 0.07 | 0.63 | 1.1 | 1.60% |
| Item 6 | -0.05 | 0.29 | 0.05 | 0.03 | 0.36 | 0.32 | 2.0 | 2.20% |
| Item 7 | 0.13 | -0.14 | 0.20 | 0.48 | 0.14 | 0.46 | 1.9 | 4.43% |
| Item 8 | 0.14 | -0.02 | 0.79 | -0.08 | -0.06 | 0.63 | 1.1 | 1.58% |
| Item 9 | 0.22 | 0.00 | 0.21 | -0.01 | 0.41 | 0.45 | 2.1 | 1.98% |
| Item 10 | 0.11 | -0.01 | 0.37 | 0.09 | 0.37 | 0.54 | 2.3 | 1.72% |
| Item 11 | 0.29 | 0.13 | 0.12 | 0.18 | 0.23 | 0.50 | 3.5 | 1.17% |
| Item 12 | 0.22 | 0.17 | 0.00 | 0.06 | 0.46 | 0.52 | 1.8 | 1.98% |
| Item 13 | 0.17 | 0.14 | 0.24 | -0.11 | 0.44 | 0.52 | 2.3 | 2.05% |
| Item 14 | 0.43 | 0.56 | 0.11 | -0.04 | 0.21 | 0.56 | 2.3 | 1.75% |
| Item 15 | 0.63 | 0.05 | 0.17 | 0.04 | -0.04 | 0.56 | 1.2 | 2.75% |
| Item 16 | 0.54 | 0.14 | 0.12 | 0.05 | 0.08 | 0.57 | 1.3 | 2.03% |
| Item 17 | -0.06 | 0.51 | -0.11 | 0.11 | 0.31 | 0.46 | 1.9 | 2.24% |
| Item 18 | 0.54 | 0.15 | -0.07 | -0.05 | 0.32 | 0.57 | 1.9 | 2.47% |
| Item 19 | 0.18 | 0.60 | 0.15 | 0.00 | 0.07 | 0.68 | 1.4 | 2.60% |
| Item 20 | 0.53 | 0.47 | 0.15 | -0.06 | 0.22 | 0.69 | 2.3 | 2.12% |
| Item 21 | -0.06 | -0.04 | 0.84 | 0.11 | 0.02 | 0.73 | 1.1 | 5.16% |
| Item 22 | 0.25 | 0.36 | 0.03 | 0.15 | 0.16 | 0.53 | 2.7 | 1.67% |
| Item 23 | -0.09 | 0.12 | 0.27 | 0.47 | 0.12 | 0.50 | 2.0 | 2.38% |
| Item 24 | 0.27 | 0.16 | 0.19 | 0.29 | -0.05 | 0.47 | 3.4 | 1.33% |
| Item 25 | 0.23 | 0.18 | 0.24 | 0.07 | 0.19 | 0.46 | 4.0 | 1.07% |
| Item 26 | 0.06 | 0.13 | 0.06 | 0.38 | 0.17 | 0.37 | 1.8 | 1.22% |
| Item 27 | 0.57 | -0.08 | -0.02 | 0.26 | 0.03 | 0.51 | 1.4 | 2.64% |
| Item 28 | 0.13 | 0.82 | -0.08 | 0.02 | 0.01 | 0.75 | 1.1 | 5.10% |
| Item 29 | 0.07 | 0.06 | 0.00 | 0.78 | -0.05 | 0.69 | 1.0 | 4.60% |
| Item 30 | 0.70 | -0.04 | -0.03 | 0.16 | 0.16 | 0.71 | 1.2 | 4.20% |
| Item 31 | 0.63 | 0.18 | 0.16 | 0.06 | -0.10 | 0.65 | 1.4 | 3.25% |
| Item 32 | 0.05 | 0.07 | -0.05 | 0.71 | 0.01 | 0.57 | 1.0 | 3.94% |
| Item 33 | 0.35 | 0.11 | 0.12 | 0.29 | 0.03 | 0.49 | 2.4 | 1.72% |
| Item 34 | 0.02 | 0.86 | -0.01 | 0.04 | -0.07 | 0.74 | 1.0 | 5.26% |
| Item 35 | 0.26 | 0.28 | 0.04 | 0.36 | -0.22 | 0.44 | 3.5 | 2.04% |
| Item 36 | 0.58 | 0.02 | 0.11 | 0.10 | 0.00 | 0.50 | 1.1 | 2.26% |
| Item 37 | -0.01 | 0.06 | 0.60 | 0.05 | 0.13 | 0.51 | 1.1 | 2.58% |
| Item 38 | -0.13 | 0.53 | 0.14 | 0.06 | 0.24 | 0.52 | 1.7 | 2.69% |
| Item 39 | 0.15 | 0.15 | 0.14 | 0.13 | 0.21 | 0.34 | 4.3 | 0.73% |
| Item 40 | -0.08 | 0.18 | 0.23 | 0.02 | 0.27 | 0.26 | 2.9 | 0.96% |
| Item 41 | 0.36 | 0.03 | 0.27 | 0.17 | 0.12 | 0.54 | 2.6 | 1.79% |
| Item 42 | -0.09 | 0.87 | 0.05 | 0.08 | 0.00 | 0.79 | 1.0 | 5.33% |
| Item 43 | 0.11 | 0.18 | 0.65 | -0.06 | -0.03 | 0.60 | 1.2 | 3.37% |
| Item 44 | 0.02 | 0.47 | 0.27 | 0.03 | 0.05 | 0.48 | 1.6 | 2.10% |
| Item 45 | -0.03 | 0.24 | 0.56 | -0.10 | -0.01 | 0.42 | 1.4 | 2.70% |


c) Confirmatory Factor Analysis (CFA)
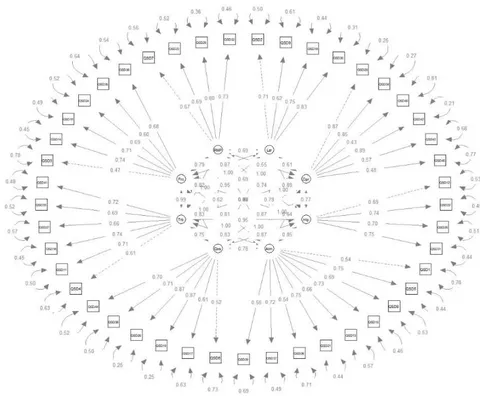
After excluding items, the instrument's structure was organised into five factors (F1, F2, F3, F4, and F5) based on the analysis of the factor clusters obtained in the initial steps. This analysis confirmed a redistribution of items that differed from the proposed model. The adjustment items indicated a good fit of the model to the data, as shown by , , RMSEA , and SRMR ; ; df ; p , with a ratio of 2.76. These results empirically support the theoretical structure of the instrument, which retained 34 variables across five factors, as illustrated in Figure 2.
Among the items of the new instrument related to the domains of the original instrument, Items 1, 5, 8, 13, 21, 26, and 37 form the "self-medication" domain. Items 28, 34, 42, 43, and 45 form the "depression" domain. Items 12, 22, and 31 belong to the "hypoglycaemia" domain. Items 2, 9, and 30 make up the "leisure time" domain. Items 3, 15, 35, and 36 belong to the "relationship with partner" domain. Items 6, 19, 38, and 44 are in the "physical complaints" domain. Items 7, 23, 29, and 32 fall within the "doctor-patient relationship" domain. Lastly, Items 16, 27, 33, and 41 comprise the "work" domain of the original instrument.
d) Convergent Validity
Table 3 displays the Pearson correlation matrix between factors derived from the exploratory analysis and latent variables identified in the confirmatory analysis of the original instrument, which the author refers to as domains. The "leisure time" domain showed a strong correlation with Factor 1. The "depression" domain was strongly correlated with Factor 2. The "self-medication" domain showed a strong correlation with
Factor 3. The "doctor-patient relationship" domain was strongly correlated with Factor 4. These robust correlations between factors and domains suggest consistency and validity in the measures used, confirming internal coherence within the instrument.

| QDS Total | QSD F1 | QSD F2 | QSD F3 | QSD F4 | QSD F5 | HADS A | HADS D | D39 Total | D39 D1 | D39 D2 | D39 D3 | D39 D4 | ||
| QDS Total | Rho | — | ||||||||||||
| p | — | |||||||||||||
| QSD F1 | Rho | 0.82 6*** | — | |||||||||||
| p | <.00 1 | — | ||||||||||||
| QSD F2 | Rho | 0.87 9*** | 0.66 0*** | — | ||||||||||
| p | <.00 1 | <.00 1 | — | |||||||||||
| QSD F3 | Rho | 0.85 2*** | 0.65 5*** | 0.628* ** | — | |||||||||
| p | <.00 1 | <.00 1 | <.001 | — | ||||||||||
| QSD F4 | Rho | 0.75 2*** | 0.69 4*** | 0.606* ** | 0.57 1*** | — | ||||||||
| p | <.00 1 | <.00 1 | <.001 | <.00 1 | — | |||||||||
| QSD F5 | Rho | 0.86 3*** | 0.68 1*** | 0.695* ** | 0.65 5*** | 0.627 *** | — | |||||||
| p | <.00 1 | <.00 1 | <.001 | <.00 1 | <.001 | — | ||||||||
| HADS A | Rho | 0.67 2*** | 0.52 7*** | 0.684* ** | 0.55 7*** | 0.467 *** | 0.54 3*** | — | ||||||
| p | <.00 1 | <.00 1 | <.001 | <.00 1 | <.001 | <.00 1 | — | |||||||
| HADS D | Rho | 0.58 0*** | 0.47 3*** | 0.623* ** | 0.38 8*** | 0.407 *** | 0.48 5*** | 0.74 4*** | — | |||||
| p | <.00 1 | <.00 1 | <.001 | <.00 1 | <.001 | <.00 1 | <.0 01 | — | ||||||
| D39 Total | Rho | 0.88 1*** | 0.73 2*** | 0.826* ** | 0.72 6*** | 0.638 *** | 0.74 5*** | 0.70 1*** | 0.634 *** | — | ||||
| p | <.00 1 | <.00 1 | <.001 | <.00 1 | <.001 | <.00 1 | <.0 01 | <.00 1 | — | |||||
| D39_D 1 | Rho | 0.80 4*** | 0.68 8*** | 0.801* ** | 0.62 8*** | 0.573 *** | 0.66 1*** | 0.67 9*** | 0.635 *** | 0.93 3*** | — | |||
| p | <.00 1 | <.00 1 | <.001 | <.00 1 | <.001 | <.00 1 | <.0 01 | <.00 1 | <.00 1 | — | ||||
| D39_D 2 | Rho | 0.84 5*** | 0.70 7*** | 0.723* ** | 0.71 2*** | 0.631 *** | 0.77 6*** | 0.61 5*** | 0.535 *** | 0.93 3*** | 0.82 9*** | — | ||
| p | <.00 1 | <.00 1 | <.001 | <.00 1 | <.001 | <.0 01 | <.0 01 | <.00 1 | <.00 1 | <.00 1 | — | |||
| D39_D 3 | Rho | 0.77 | 0.58 | 0.786* | 0.62 | 0.504 | 0.62 | 0.68 | 0.585 | 0.85 | 0.74 | 0.73 | - | |
| 0*** | 6*** | ** | 4*** | *** | 4*** | 1*** | *** | 4*** | 5*** | 2*** | ||||
| p | <.00 | <.00 | <.001 | <.001 | <.001 | <.001 | <.001 | <.001 | <.001 | <.001 | <.001 | - | ||
| D39_D 4 | Rho | 0.55 | 0.51 | 0.488* | 0.48 | 0.504 | 0.43 | 0.41 | 0.400 | 0.64 | 0.52 | 0.55 | 0.44 | - |
| 8*** | 4*** | ** | 5*** | *** | 6*** | 0*** | *** | 4*** | 6*** | 1*** | 6*** | |||
| p | <.00 | <.00 | <.001 | <.001 | <.001 | <.001 | <.001 | <.001 | <.001 | <.001 | <.001 | <.001 | - | |
e) Reliability
The reliability analysis was based on the internal consistency of the instrument using Cronbach's alpha and its temporal stability (test-retest) using the intraclass correlation coefficient (ICC). The results showed satisfactory internal consistency for all factors, ranging from 0.86 (Factor 5) to 0.93 (Factor 4), except for Factor
1, which had an ICC of 0.68. The overall scale achieved an ICC of 0.97.
Table 4 shows the mean values for the total QSD-R score at two assessment points, used to evaluate temporal stability. Minimal changes between the two assessments indicate good levels of stability over time, nearing the threshold for moderate reliability.
| Variable I | Test | Retest | ICC (95% CI) | P |
| QSD total | 53 (34-77) | 55 (34-76) | 0.97 (0,95-1.02) | 0.04 |
| F1 | 10 (8-14) | 9 (7-13) | 0.68 (0.48- 0.97) | 0.26 |
| F2 | 12 (7-18) | 14 (7-19) | 0.91 (0.83-1.02) | <0.001 |
| F3 | 12 (6-17) | 12 (7-17) | 0.88 (0.73-1.09) | <0.001 |
| F4 | 7 (6-15) | 6 (6-15) | 0.93 (0.90-1.06) | <0.001 |
| F5 | 10 (7-18) | 11 (7-16) | 0.86 (0.67-1.07) | <0.001 |
IV. DISCUSSION
The present study aimed to analyse the psychometric properties of the Brazilian Portuguese version of the Questionnaire on Stress in Diabetic Patients – Revised (QSD-R). The sample of adults with a medical diagnosis of type 1 or type 2 diabetes was predominantly women (60.3%), differing from the study that originally developed the QSD-R instrument (22) as well as a subsequent study (36), but similar to findings reported in a study that used the QSD-R to explore self-perceived stress in relation to hair cortisol (20) and another study that validated the instrument for the Portuguese adolescent population (37). Regarding other sociodemographic variables, married individuals (64.1%), those living with the disease for over ten years (30.9%), individuals with some risk factor (57.5%), and those with at least one comorbidity (60.9%) were predominant in the sample, as reported in other international studies (20,22,36).
To assess the adequacy of the data, an initial analysis was conducted using the Kaiser-Meyer-Olkin (KMO) index and Bartlett's Test of Sphericity. The KMO value was 0.95, indicating suitability for factor analysis, based on the criteria proposed by Kaiser (1974) (38), who considers values above 0.80 as indicative of satisfactory quality. Bartlett's Test of Sphericity yielded a statistically significant result ( , d.f. , ), suggesting that the correlations between the items are significantly different from zero. These findings suggest that the data are suitable for identifying an underlying factorial structure, justifying further factor analysis to evaluate the construct validity of the instrument.
In the initial step (confirmatory factor analysis based on the original eight-dimensional, 45-item model), the values obtained for the CFI (0.786) and TLI (0.768) fell below the recommended minimum ( 0.90), indicating that the proposed model did not fit the data adequately. Although the RMSEA (0.083) was within the acceptable range, the other indices did not suggest a good fit, highlighting the need to explore the model further through EFA. This was performed to develop a more reasonable and reliable model (39), based on the minimum retention criterion of three items per factor and factor loadings above 0.3. Consequently, 11 items were excluded from the original instrument (Items 4, 10, 11, 14, 17, 18, 20, 24, 25, 39, and 40), similar to the validation study of the instrument in Portuguese for Portugal (37). The new distribution of items within each factor was as follows: FACTOR 1 (QSD-R Items 15, 16,
27, 30, 31, 33, 36, and 41), FACTOR 2 (QSD-R Items 19, 22, 28, 34, 38, 42, and 44), FACTOR 3 (QSD-R Items 5, 8, 21, 37, 43, and 45), FACTOR 4 (QSD-R Items 7, 23, 26, 29, 32, and 35), and FACTOR 5 (QSD-R Items 1, 2, 3, 6, 9, 12, and 13).
The factorial structure obtained through EFA revealed five factors that explained of the total variance, demonstrating a coherent and appropriate theoretical organisation of the QSD-R instrument for the Brazilian population diagnosed with type 1 and type 2 diabetes. This result reinforces the construct validity of the scale and aligns with findings described in previous studies that employed the same instrument in different cultural contexts (20, 22, 36, 37).
Confirmatory factor analysis was then conducted by restructuring the instrument into five factors. All quality criteria for the model's fit were deemed satisfactory, with the final model showing high goodness of fit (CFI = 0.91; TLI = 0.87; RMSEA = 0.06; SRMR = 0.067; X2 = 1520.64; df = 517; p < 0.0001, with χ2/df ratio = 2.76), aligning with data reported in the literature (30). The results confirmed the construct validity of the instrument, indicating that the items are appropriately organised into five theoretical factors that allow a comprehensive assessment of factors related to stress in patients with diabetes.
The reliability of the scale was evaluated using Cronbach's alpha coefficient for internal consistency and the intraclass correlation coefficient (ICC) for assessing temporal stability (test-retest) (40, 41).
The results demonstrated good internal consistency of the QSD-R, with high Cronbach's alpha coefficients, especially for the "complaints" and "self-medication" domains (0.86 and 0.87, respectively), aligning with findings from a previous study that used the same instrument for similar purposes and the original research (22,37). Regarding the other scales used, Cronbach's alpha was 0.97 for the Diabetes-21 (final version in Portuguese) and 0.91 for the HADS. All factors met or surpassed the minimum acceptable threshold of 0.70, recommended as a cutoff for instruments under development or initial validation (42). It is important to note that the number of items significantly influences Cronbach's alpha coefficients in a measurement instrument (40).
The temporal stability of the scale was evaluated using the intraclass correlation coefficient (ICC), as recommended by COSMIN (43). The sample of 20 participants provided sufficient methodological evidence for overall ICC estimates of 0.91 (44). There was minimal variation between the test and retest results, indicating satisfactory levels of temporal stability and moderate reliability.
To assess convergent validity, correlations between the domains of the QSD-R and both the Diabetes-21 Scale and HADS were examined using Pearson's correlations between the factors derived from the exploratory analysis and the latent variables from the confirmatory analysis of the original instrument. Strong correlations were identified between the factors and domains of the original scale and the D39 scale, whereas a weaker correlation was observed between Factor 5 and HADS. These strong correlations between factors and domains support the consistency and validity of the measures used, confirming the internal coherence of the instrument.
V. CONCLUSION
The results obtained in this study show that the Brazilian version of the QSD-R has a structure comprising five factors and 34 items, organised with reliable consistency and a good fit to the proposed factorial model. This confirms the methodological robustness of the cross-cultural adaptation, ensuring the instrument's validity for use in Brazilian contexts.
The availability of this instrument – unprecedented in Brazil – marks a significant advance for the healthcare field, particularly in clinical settings focused on care for individuals living with diabetes. Its design aligns with institutional guidelines for implementing evidence-based interventions in health promotion, treatment, and therapies for the target population. Furthermore, the practical use of the instrument can help healthcare providers achieve more accurate diagnoses and monitor the effects of therapeutic strategies, thereby supporting improvements in clinical and research practices across Brazil.