## I. INTRODUCTION
The Program for the Development of Photovoltaic Solar Energy in Cuba, executed by the National Electric Union, as of 2013 covered the construction and commissioning of Photovoltaic Parks (PPv) located throughout the country, maintaining a growing trend in its introduction in the country. This has allowed more than 72 PPVs to be installed with a total power of 215 MWp out of a planned power of 700 MWp for 2030.
One of these is the PPv, "Santiago — CIES", located in the Abel Santamaría, Micro 3, Santiago de Cuba Municipality, province of the same name, in the part of the land occupied by the Solar Energy Research Center (CIES), at the following coordinates, Latitude: $20^{\circ} 00' 75''$ and Longitude: $75^{\circ} 77' 07''$.
The "Santiago - CIES" Photovoltaic Park of 2.5 MWp, is made up of two photovoltaic generators (GPv), made up entirely of 10,400 photovoltaic modules (MPv) of 250 Wp power (model DSM-250-C) assembled in Cuba, grouped into 520 work tables, conveniently interconnected to 130 three-phase grid connection inverters (ICR) (model SB 17000TL), manufactured by SMA, with a nominal power of $17\mathrm{kW}$ each. The PPv contributes its energy to the local electrical network at a nominal voltage level of $13.8\mathrm{kV}$, through two three-phase coupling transformers.
In 2016, CIES carried out a project linked to the national program of Renewable Energy Sources, entitled: Evaluation of the Photovoltaic Park Santiago - CIES of 2.5 MWp connected to the National Electric Union, whose main objective was to know the performance in operation of it, since, since its implementation, the technology had not been evaluated. The completion of it yielded the following results:
1. There is a GPv power deviation of $7.57\%$, lower than the nominal value declared by the manufacturer, which indicates that, due to the nominal power deviation in the GPv, the system stops producing
2. As for the ICRs, a total of 8 failures (replacement) were reported in 2016 with a delay time of approximately 6 days, which represents a loss of 3.88 MWh, which is equivalent to USD 1,044.00.
3. It is estimated that in 2016 the Santiago — CIES, PPv operated at $91\%$ of its nominal performance, therefore, the operational losses of the system in general amount to 25.2 MWh each month.
Like all technologies, grid connection photovoltaic systems are usually supervised according to standards established in each region and measurements can be analyzed annually. These indicators are calculated from data throughout the year to take into account the effect of seasonal variation. Due to the different levels of solar irradiance and ambient temperature, photovoltaic systems operate better at certain times of the year. The annual results can be compared with reference values to evaluate the performance of the system.
The use of the PR (performance ratio) or overall performance is a parameter derived from the efficiency of the system and is the most common method of evaluating the performance of the photovoltaic system, it is widely used as an indicator of quality of photovoltaic systems since, in 1993, and it was included in the IEC 61724 standard. This parameter is defined as the relationship between the energy that a photovoltaic system delivers to the grid and that which a hypothetical ideal system would deliver, understood as one whose solar cells always work at the reference temperature (25 °C) and that, therefore, otherwise, it was free of losses<sup>(1)</sup>. However, there are theoretical reasons and experimental evidence that show that this parameter varies throughout the year by as much as 10%, which prevents any value measured over a week from being considered representative of what happens throughout the year.
Based on what has been stated, it is concluded that there is limited information about the performance of Grid Connection Photovoltaic Systems (SPvCG) in Cuba. For this reason, it was proposed to develop the Operational Loss Quantification Procedure (SPvCG Degradation Index), based on the relationship between the expected power and the real power for different temperature and solar irradiance conditions, supported by a measurement tool calculation, graphical interface PVSET-CIES, for the evaluation and processing of the data, with which the efficiency of the SPvCG can be substantially improved, all of this, support the need to improve the system indicators and reduce losses by taking advantage of the existing technology.
## II. MATERIALS AND METHODS
1. Study of the state of the art. Generalities of photovoltaic systems: evaluation and mathematical models.
2. Procedure for the quantification of the operational losses of the SPvCG.
3. Implementation and validation of the procedure for the quantification of operational losses in the CIES 7.5 kWp PV microsystem, through statistical parameters.
4. PVSET-CIES Software. Generalities
## III. RESULTS
a) Study of the state of the art. Generalities of photovoltaic systems: evaluation and mathematical models.
Overall Performance or PR considers the expected efficiency of the system under ideal operating conditions. This is a parameter derived from the efficiency of the system and is the most common method of evaluating the performance of SPVs (1).
The PR has been widely used as a quality indicator for photovoltaic systems since it was included in the IEC 61724 standard in 1993. This parameter is defined as the relationship between the energy that a photovoltaic system delivers to the grid and that which a hypothetical ideal system would deliver, understood as one whose solar cells always work at the reference temperature (250C) and that, for the rest, was loss free.
The main advantage of the PR is that it is easy to obtain: all you need is the network's energy meter and an incident solar radiation sensor. Its main drawback is that it does not allow differentiation between thermal losses (due to the fact that the cells normally operate at temperatures above 25oC, which are unavoidable and unrelated to the design and operation of the system), from the rest of the losses, which do depend on it, it is that is, it does not distinguish between extrinsic (thermal) and intrinsic (the rest) losses.
For this reason, the so-called PR25 has recently been used, defined as the ratio between the energy actually produced by an SPv and that which would be produced by another hypothetical one with the same nominal power, which would not be affected by any type of loss and whose cells would operate at the same temperature as that of the real system (instead of 25 oC), as shown in equation 1.
$$
PR_{25} = \frac{E_{\mathrm{AC,REAL}} \cdot S^{*}}{P_{\mathrm{RG}}^{*} \Delta t \sum_{i} S_{i} \left[ 1 + \gamma \left(T_{\mathrm{C},i} - T_{\mathrm{C}}^{*}\right) \right]}
$$
where:
$$
S * \text{irradiance} (S T C = 1 0 0 0 W / m ^ {2})
$$
$$
T _ {\mathrm{C}} * = 2 5 ^ {\circ} \mathrm{C}
$$
$P_{RG}^{*}$ generator rated power. $\Delta t$ sampling time.
I: number of measurements.
$\gamma$: coefficient of variation of power with temperature, negative value, indicated by the manufacturer.
* Standard measurement conditions SCT
### b) Limitations
The use of the PR is a simple and effective method to evaluate the performance of photovoltaic systems. However, there are theoretical reasons and experimental evidence that show that this parameter varies throughout the year by as much as $10\%$. This prevents any value measured throughout a week from being considered representative of what occurs throughout the year.
On the other hand, $\mathsf{PR}_{25}$ (which considers the influence of the photovoltaic cell operating temperature), presents difficulties in estimating the maximum output power of the GPv, evidence of this is presented in (2), where the error The absolute result of the analysis of one day between the actual measured and the estimated power is 3 times greater than that estimated from the five-parametermathematical model, (3).
## IV. MATHEMATICAL MODELS OF THE PHOTOVOLTAIC GENERATOR AND GRID CONNECTION INVERTER
### a) Mathematical model of the GPv
There are several models to predict the energy production of a MPv, a string, or an array under certain conditions, most of these are based on current-voltage (I-V) relationships that result from simplifications applied to the diode model double $^{(4)}$:
- Model of 5 parameters.
- Model of three parameters.
- Sandia Array Performance Model (SAPM).
- King's model.
- Luft's equation and others.
- Hadj Arab equations and others.
For this research, the modified relationship was resolved using the 5-parameter model, popularized by (3) since, unlike the other models, it only requires information provided by the manufacturers and its concordance with experimental results has been demonstrated.
### b) ICR mathematical model
For the ICR, a model that simulates its efficiency based on two resistors is presented below: one in series with the input and another in parallel with the output. Between the two there will be an ideal investor, understood as the one in which there is no loss. This is a model with physical meaning $^{(5)}$, as opposed to other purely mathematical models $^{(6)}$. It has the advantage of simplicity over other models based on the topology of the electronic circuits constituting the inverters that have been presented by $(7,8,9)$ or on its behavior $^{(10)}$.
The equation that defines the behavior of the inverter efficiency is the following:
$$
\eta = \frac {2 R _ {s} P _ {a c}}{V _ {d c} ^ {2} \left[ 1 - \sqrt {1 - 4 \frac {R _ {s}}{V _ {d c} ^ {2}} \left[ \frac {V _ {a c} ^ {2}}{R _ {p}} + P _ {a c} \right]} \right]} \qquad (2)
$$
### c) Procedure for the quantification of the operational losses of the SPvCG
The energy losses that occur in a photovoltaic system, operational losses, are inherent in any photovoltaic system; they are associated with the inconsistency between the nominal efficiency declared by the manufacturer and the real one, the resistive energy losses in the cables or the losses due to component degradation. The actions aimed at minimizing operational losses aim to maintain the nominal operating conditions and ensure the warranty terms of the main elements that make up the system.
For this, the option that is exposed starts from considering that the behavior of the photovoltaic generator is calculated from the 5-parameter model (3), the input variables are: the incident irradiation (S) and the operating temperature of the cells solar (Tc), figure 1.
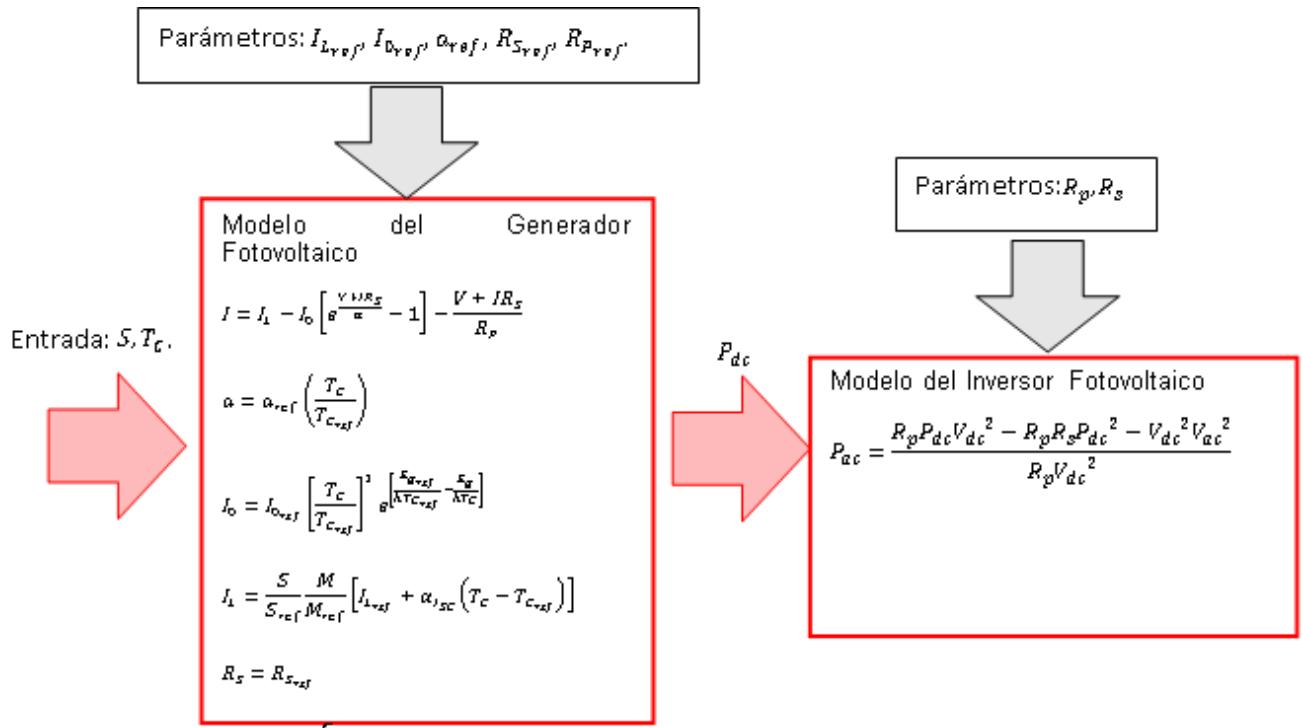 Figure 1: System of equations that define the behavior of the SPvCG
The procedure to quantify operational losses Consists of:
From a SPvCG Operation Database:
- Obtain the power, voltage and output current of the photovoltaic generator for the irradiation conditions (S) and temperature of the PV module (Tc) for a sufficient time to cover most of the spectrum of operating conditions (1).
- Calculate the power, voltage and output current of the GPv starting from the model described above, for the irradiation and temperature conditions of the Pv module obtained from the SPvCG operation database.
- Compare the power, voltage and current of the Operation Database with respect to those obtained from the model, and perform a polynomial adjustment for these variables.
The structure of the polynomials is defined below:
$$
\begin{array}{l} P _ {d c, E X P} = \left(a _ {P d c} + b _ {P d c} \left(T _ {C} - 2 5 ^ {\circ} C\right) + c _ {P d c} S\right) P _ {d c, S I M} \\; a _ {P d c} \quad \text{defined} \quad \text{b y} \quad \text{the} \quad \text{line} P _ {d c, E X P} = \left(a _ {P d c}\right) P _ {d c, S I M} \end{array}
$$
$$
\begin{array}{l} V _ {d c, E X P} = \left(a _ {V d c} + b _ {V d c} \left(T _ {C} - 2 5 ^ {\circ} C\right)\right) V _ {d c, S I M}; \quad a _ {V d c} \\\text{defined by the line} \quad V _ {d c, E X P} = \left(a _ {V d c}\right) V _ {d c, S I M} I _ {d c, E X P} = \left(a _ {I d c} + b _ {I d c} \left(T _ {C} - 2 5 ^ {\circ} C\right)\right) I _ {d c, S I M}; \quad a _ {I d c} \\\text{defined by the line} \quad I _ {d c, E X P} = \left(a _ {I d c}\right) I _ {d c, S I M} \end{array}
$$
where:
S, is Irradiance, expressed in $\frac{W^r}{m^2}$.
is the operating temperature of the Pv module, expressed in $[^\circ \mathrm{C}]$.
$\mathrm{P_{dc,EXP}}, \mathrm{P_{dc,SIM}}$ is the output power of the GPvmeasured and simulated respectively, expressed in [W].
$\mathrm{V_{dc,EXP}}, \mathrm{V_{dc,SIM}}$ is the output voltage of the GPv measured and simulated respectively, expressed in [V]. $\mathrm{I_{dc,EXP}}, \mathrm{I_{dc,SIM}}$ is the output current of the GPv measured and simulated respectively, expressed in [A].
### d) Analysis of data. Evaluation criteria
The evaluation process in the GPv is carried out using the 5 Parameter Model. Initially, the parameters for the standard measurement conditions are estimated and the maximum power at the GPv output is obtained, as well as the voltage and current at the point of maximum power, estimated for each of the pairs Irradiation and Operating temperature that make up the measurement table.
The maximum measured power is taken as a reference value for the polynomial adjustment of the surface formed by the simulated maximum power, based on (Irradiation and operating temperature). In the case of voltage, they are taken as pairs of coordinates
(Vdc,sim, Vdc,exp) for which a curve fit is made, the same happens for current (Idc,sim, Idc, exp).
Through these adjustments it is possible to determine the degradation of the GPv according to the coefficients a, b and c, where a is the main deviation coefficient. It is calculated as follows, d $(\%)$ = (1-a) *100%.
At this point, the degradation index obtained is compared with that corresponding to the system, taking into account the years of operation of the GPv. If the degradation is within the interval declared by the manufacturer, Datasheet, the current state of the GPv is taken as positive, if the estimated degradation exceeds the interval it is taken as negative and if it is lower, the system performance is taken as positive.
e) Implementation and validation of the procedure for the quantification of operational losses in the SPvCG 7.5 kWp PV microsystem, through statistical parameters For the validation of the procedure for the calculation of the degradation index, it was necessary to carry out field measurements with the curve tracer. 8 PV modules and the chain formed by these modules, which have an operating time of 9 years, were evaluated.
### f) Experiment Design for Field Measurements
First, the I-V 400 curve tracer was parameterized to evaluate modules manufactured by HELLIENE model 215 MA based on the information provided by the manufacturer's Datasheet. The instrument was connected to the module and measurements were obtained every 15 minutes, for two days, sufficient to cover the greatest number of operating conditions, taking as a premise what is referred to in the IEC 60891 standard. Then the chain formed by the eight modules used previously was evaluated for three days.
Field measurements with IV 400 curve tracer
The measurements were made with an I-V Curve tracer, brand HT, model I-V 400 manufactured by HT Instruments, complying with the standards of the IEC 60891 standard. This instrument directly allows obtaining the I- V curve and the characteristics of the main electrical parameters of the PV modules, up to a maximum of $1000\mathrm{V}$ and $10\mathrm{A}$, with an accuracy of $\pm$ $2\%$.
Table 1: Actual Measurements with the I-V Curve Tracer
<table><tr><td>Measurements</td><td>Pmax (Wp)</td><td>Voc (V)</td><td>Vmpp (V)</td><td>Impp (A)</td><td>Isc (A)</td><td>Irradiance \(\left(\frac{W}{{m}^{2}}\right) \)</td><td>Operating temperature (°C)</td></tr><tr><td>1</td><td>155.01</td><td>34.43</td><td>26.79</td><td>5.79</td><td>6.38</td><td>792</td><td>45.2</td></tr><tr><td>2</td><td>155.36</td><td>34.36</td><td>26.79</td><td>5.8</td><td>6.42</td><td>793</td><td>45.5</td></tr><tr><td>3</td><td>155.43</td><td>34.25</td><td>26.72</td><td>5.82</td><td>6.47</td><td>797</td><td>46.1</td></tr><tr><td>4</td><td>160.26</td><td>34.06</td><td>26.65</td><td>6.01</td><td>6.73</td><td>828</td><td>47.6</td></tr><tr><td>5</td><td>160.9</td><td>34.15</td><td>26.65</td><td>6.04</td><td>6.75</td><td>832</td><td>47.5</td></tr><tr><td>6</td><td>161.14</td><td>34.07</td><td>26.65</td><td>6.05</td><td>6.75</td><td>834</td><td>47.2</td></tr><tr><td>7</td><td>160.34</td><td>34.06</td><td>26.65</td><td>6.02</td><td>6.73</td><td>829</td><td>47.5</td></tr><tr><td>8</td><td>166.45</td><td>34.22</td><td>26.36</td><td>6.31</td><td>6.95</td><td>857</td><td>46.3</td></tr><tr><td>9</td><td>166.08</td><td>34.22</td><td>26.29</td><td>6.32</td><td>6.98</td><td>860</td><td>46.9</td></tr><tr><td>10</td><td>168.92</td><td>34.15</td><td>26.79</td><td>6.31</td><td>7.11</td><td>874</td><td>48.5</td></tr></table>
The measurement of the incident irradiance was carried out with a model HT 304 reference cell, of the same technology and material as the photovoltaic module, placed coplanar to the module and the measurement of the cell temperature, using a PT300N model resistance thermometer placed in the center of the back of the photovoltaic module. It should be noted that, in order to select the area where the resistance thermometer was placed, an inspection was previously carried out with a Thermographic Camera (FLUKE) to avoid false measurements of hot spots, discarding these candidates.
The Statistical Parameters used to Validate the Procedure Were:
- Coefficient of determination of the line is nothing more than the percentage of variation of the response that is explained by the model, that is, how well the result of the procedure fits the real measurements, this parameter varies from $0\%$ to $100\%$. The higher the value of the coefficient, the better the method will fit the data.
- Root Mean Square Error (RMSE) provides a measure of error in the same units as the variable under consideration.
- The percentage of the root mean square of the error (RMSPE), where the error is normalized with the use of the average of the measurements.
- The mean absolute error percentage (MAPE) gives a weighted measure of the previous parameter with respect to the actual measurements.
Starting from the 210 measurements obtained in the field as part of the tests carried out, the aforementioned statistical coefficients were calculated. It is essential to keep in mind that 8 PV modules and the chain formed by them were evaluated. Several measurements were obtained from each PV module, which were, averaged to obtain their degradation.
The fundamental objective of the procedure is to calculate the maximum power deviation of the photovoltaic generator between the power declared by the manufacturer and the real one, for the validation the deviation resulting from the procedure and that thrown by the curve tracer were related, as shown in the figure 2.
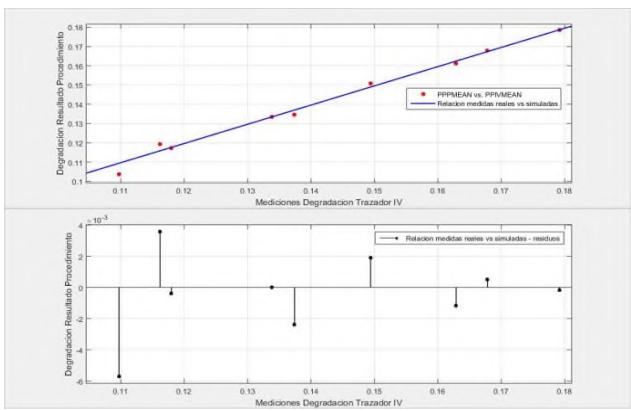 Figure 2: Relationship Between The DegradationResulting From The Procedure And Tracer I-V 400
In figure 2 it is possible to appreciate the relationship between the variables analyzed, a polynomial adjustment of the type $ax + b$ which resulted $a = 0.996$ y, $b = 0.001$ direct proportionality and of equal magnitude. Table 2 shows the values obtained, the results of the analysis and processing of the data.
Table 2: Results of the Statistical Indices for the validation of the Procedure
<table><tr><td>Statisticalindices</td><td>Validation result Procedure</td></tr><tr><td>R2</td><td>0.9896</td></tr><tr><td>RMSE</td><td>0.0021</td></tr><tr><td>RMSPE</td><td>1.4975</td></tr><tr><td>MAE</td><td>0.0017</td></tr><tr><td>MAPE</td><td>1.1498</td></tr></table>
The results obtained from the validation of the procedure corroborate its accuracy, achieving a determination coefficient of 0.9896, which tells us that approximately $99\%$ of the data can be explained by the fit line between these variables. Another precision indicator of the procedure is denoted by the calculated errors, $\mathrm{RMSPE} = 1.498\%$ and $\mathrm{MAPE} = 1.15\%$. Due to the aforementioned, we can affirm that the procedure performs well when calculating the deviation of the
## V. GENERALITIES
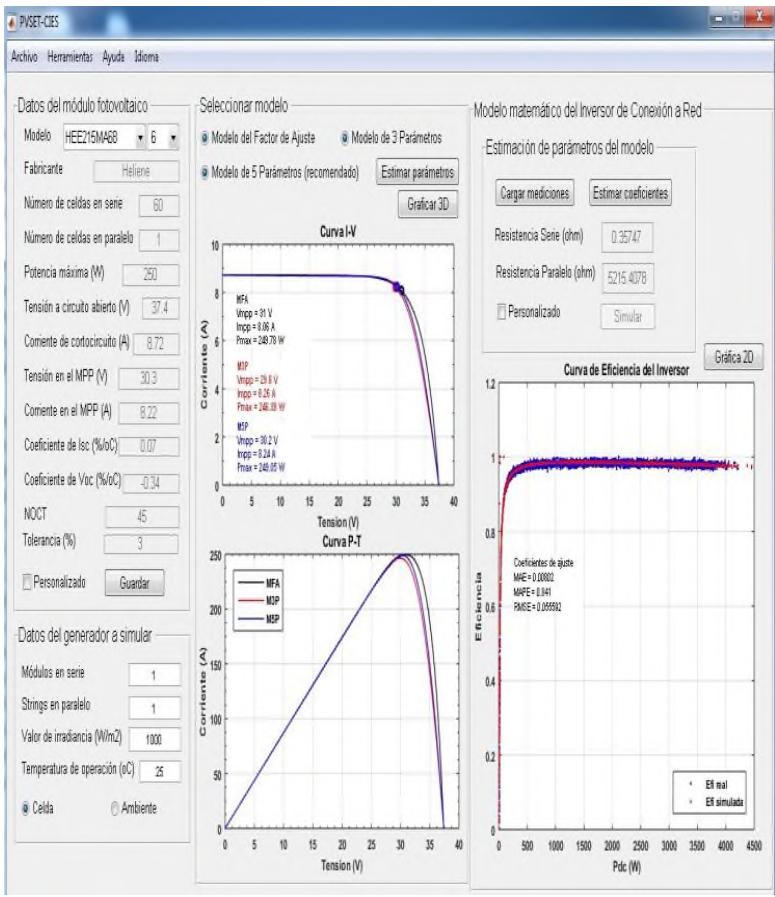
The PVSET-CIES graphic interface has the following stages, which are described below:
Simulation section
Based on mathematical models of the GPv and ICR, it is in charge of simulating their behavior for different environmental conditions, figure 3
 Figure 3: Simulation Window, PVSET-CIESGraphic Interface
The simulation section is formed by a simulation subsection of the photovoltaic generator, where the data of the photovoltaic module is loaded, in which the user can select the photovoltaic module (MPv) that makes up the generator to be simulated from a database that it is loaded automatically when the application starts, for which said database must be in the execution directory with the name "BDM.xls". In case the BDM file is not found or is invalid, the application displays an information box and creates a new empty database file (without MPv data) with the same name and structure. In the same way, if the MPv to be used is not present in said database, the user can enter the data manually by selecting the "Custom" option and save them as a new MPv by clicking the "Save" button. In the lower right part, the configuration of the GPv to be simulated with the corresponding environmental values is determined.
The middle section corresponds to the selection of the type of mathematical model to be used for the simulation of the GPv, in it there are three models, but as we already explained, the recommended model, with greater precision, is the one with 5 parameters. The output graphs are I-V and P-V, in which the maximum power point is located for the simulation environmental conditions.
Finally, the section on the right corresponds to the simulation of the Grid Connection Inverter. In which the user can establish the coefficients that define the mathematical model that simulates the inverter, or estimate them from a database of inverter operation. Said database must be in the execution directory with the name "BDI.xls".
### Evaluation section
Based on the data supplied in the simulation section (MPv and ICR parameters), it is responsible for evaluating their behavior for different operating conditions, obtained from the database, see figure 4.
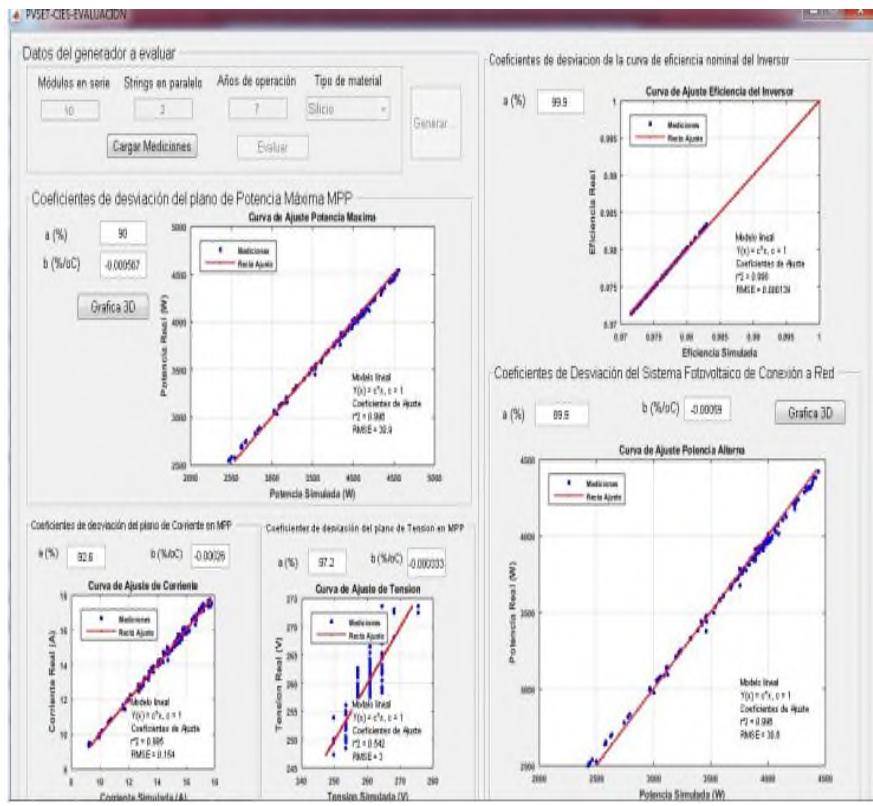 Figure 4: Evaluation Window, PVSET-CIESGraphic Interface
The evaluation window is in charge of showing the results obtained, as part of the implementation of the procedure for the quantification of operational losses in photovoltaic systems. It must be specified that, in the visualization field of the results of the power evaluation, the graphs on the left correspond to the evaluation of the GPv and the graphs on the right, upper, evaluation of the lCR and lower, to the SPvCG, respectively.
#### Graphic 3D
In the simulation section, the tool allows, based on the electrical characteristics of the MPv, to build the theoretical maximum power plane for the nominal conditions described by the manufacturer. In the evaluation section, the tool allows to build the real power plane for degraded conditions. Simulations can be performed for different ranges of irradiance and operating temperature, figure 5.
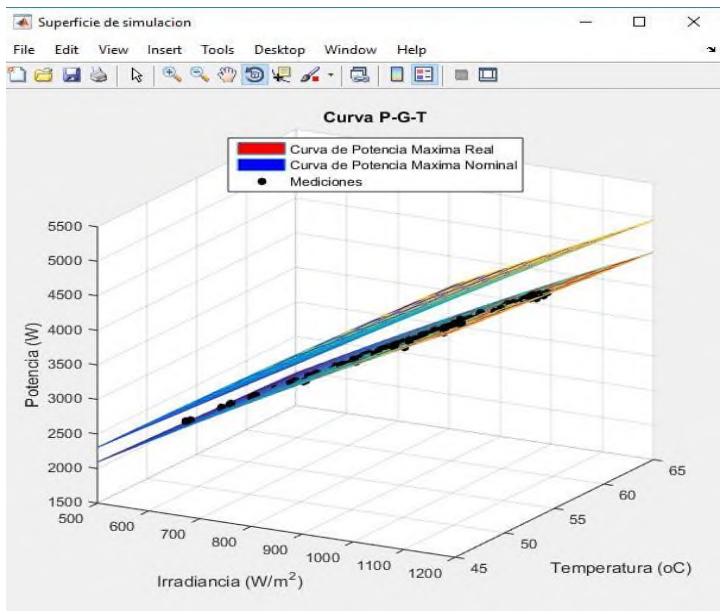 Figure 5: Maximum Power Plan for Nominal AndDegraded Conditions
## VI. CONCLUSIONS
The precise quantification of the operational losses in a SPvCG allows characterizing its operation and taking maintenance actions if required. This indicator, unlike the PR, does not depend on environmental conditions and is more rigorous in terms of calculating the power estimated by the model.
The results obtained from the evaluation of the GPv and ICR models corroborate their accuracy, achieving a correlation index greater than 0.98 in all cases. The fundamental disadvantage of the GPv model lies in the solution of the mathematical equations that define the system, but, with the computing resources and processing capacity available, the simulations are efficient and fast.
The validation of the procedure through statistical parameters corroborates its accuracy, achieving a coefficient of determination of 0.9896, as well as RMSPE=1.498% and MAPE=1.15%.
The Graphical Interface, PVSET-CIES, was developed, which allows the evaluation of the SPvCG in an interactive and easy way for the user. The tool provides information on energy losses and system degradation, which serves as a prerequisite for decision makers to develop maintenance and/or repair programs that keep the SPvCG at optimum operating levels.
[^210]: I-V curve measurements were made to the PV modules, with the environmental variables in this range: Irradiance $\left[565\frac{W}{m^2}\right]$; 1146 $\frac{W}{m^2}$ and operating temperature $[41.3^{\circ}C;59.7^{\circ}C]$. Table 1 shows the information provided by the instrument, the result of 10 of the measurements made. The measurements went through a filtering process before being used for the validation of the method, based on what is referred to in the IEC 60891 standard. _(p.4)_
Generating HTML Viewer...
References
13 Cites in Article
E Lorenzo (2011). Predicción y ensayo de la producción de la energía FV conectada a la red.
J Sánchez (2016). Photovoltaic Panel Characterization by Using Artificial Neural Networks and omparison with Classical Models.
W De Soto,S Klein,W Beckman (2004). Improvement and validation of a model for photovoltaic array performance.
Hongmei Tian,Fernando Mancilla-David,Kevin Ellis,Eduard Muljadi,Peter Jenkins (2012). A cell-to-module-to-array detailed model for photovoltaic panels.
Chivelet (1994). Modelado y fiabilidad de inversores para instalaciones fotovoltaicas autónomas a partir de medidas con cargas resistivas y reactivas.
M Jantsch (1992). APLICACIONES DE LA ENERGÍA FOTOVOLTAICA.
H Eldemoser (1998). New high efficiency current fed DC-to-AC inverters.
A Simmons,I (2000). Current waveform quality from gridconnected PV inverters and its dependence on operating conditions.
D Schulz,R,H (2000). RADIACIÓN SOLAR TERRESTRE.
L Castañer,R,A Carles,D (1995). Photovoltaic system simulation using a standard electronic circuit simulator.
Roger Anner,Proenza Yero,José Emilio Camejo Cuán,Rubén Heredia (2021). Procedure for the quantification of the degradation index of Photovoltaic Generators.
Roger Anner,Proenza Yero,José Emilio Camejo Cuán,Rubén Heredia (2021). Validation of the procedure: Quantification of the degradation index of Photovoltaic Grid Connection Systems.
Proenza Yero,Roger Anner; Camejo Cuán,José Emilio; Ramos,Rubén; Massipe Heredia,Juan Hernández,; Raúl,Luis Vázquez Seidedos Sistemas fotovoltaicos conectados a red: una propuesta para evaluar y cuantificar fallos en el generador fotovoltaico.
No ethics committee approval was required for this article type.
Data Availability
Not applicable for this article.
How to Cite This Article
Roger Anner. 2026. \u201cPVSET- CIES Graphic Interface. Quantification of the Degradation Index of Photovoltaic Systems\u201d. Global Journal of Research in Engineering - J: General Engineering GJRE-J Volume 23 (GJRE Volume 23 Issue J3).
Explore published articles in an immersive Augmented Reality environment. Our platform converts research papers into interactive 3D books, allowing readers to view and interact with content using AR and VR compatible devices.
Your published article is automatically converted into a realistic 3D book. Flip through pages and read research papers in a more engaging and interactive format.
Our website is actively being updated, and changes may occur frequently. Please clear your browser cache if needed. For feedback or error reporting, please email [email protected]
Thank you for connecting with us. We will respond to you shortly.