Du to COVID-19, which started in 2020, Japanese people have continued to live in selfrestraint until today. As a result, lifestyle habits have drastically changed. There are concerns about living indoors rather than going out, lack of exercise, increased alcohol consumption, irregular eating habits, and lack of sleep or excess sleep. In June 2022, we were finally able to hold a small number of health classes, and we conducted a questionnaire survey on the current living situation so that we will report the results. Participants were 20 elderly females who had been informed about the study and agreed to a consent form. Participants measured their height, weight, blood pressure, and completed a self-reported questionnaire. The content of the self-reported questionnaire survey was the smoking habit, drinking habit, exercise habit, sleeping time, and supplement intake. Participants were also asked about co-habitation.
## I. INTRODUCTION
Due to the COVID-19 epidemic, which has continued for three years since 2022, Japanese people are live self-restraint at home. Due to COVID-19, by staying at home, this influences the diet, exercise habits, sleep times, etc., in Japanese life. Therefore, in this study, we conducted a questionnaire survey on the lifestyle habits of 20 elderly females in a small-group health class for the first time in three years.
## II. MATERIAL AND METHODE
Participants signed and sealed a research consent form after receiving an explanation of the research. Participants sanitized their hands with alcohol, wore masks, and measured their body temperature in a ventilated room. In addition, the participants answered a self-reported questionnaire while sitting in seats separated by acrylic panels with a seating distance of 1 m or more. The items of the questionnaire survey for the participants were whether or not they lived together, whether or not they had support or nursing care, whether or not they quit smoking, whether they used alcohol, whether they took supplements, their exercise habits, and their sleep times. Participants also had their height, weight, and blood pressure measured.
There are no companies, etc., with COI relationships in this research.
## III. RESULTS
Table 1 shows the ling conditions of the participants (the number of co-habitants and the presence or absence of support or nursing care), and Table 2 shows the participant's height, weight, and blood pressure. Most of the participants $(60\%)$ lived as married couples. Twenty percent of the participants lived alone. There were 20 female participants with an average age $\pm$ Standard deviation of $78.5 \pm 18.6$ years. Participant's mean blood pressure was within the normal range.
Table 1. Living situation survey results (20 elderly females)
<table><tr><td rowspan="2">Number of people living together</td><td>Alone</td><td>2 people</td><td>3 people</td><td>4 people</td><td>5 people</td><td>6 people</td></tr><tr><td>4</td><td>12</td><td>3</td><td>0</td><td>0</td><td>1</td></tr><tr><td rowspan="2">Status of support and nursing care</td><td>none</td><td>support 1</td><td>support 2</td><td>nursing care 1</td><td>nursing care 2</td><td>nursing care 3 or higher</td></tr><tr><td>19</td><td>1</td><td>0</td><td>0</td><td>0</td><td>0</td></tr></table>
Table 2. Body and blood pressure information of health class participants (20 elderly females)
<table><tr><td></td><td>Age</td><td>Hight</td><td>Weight</td><td>Systolic blood pressure</td><td>Diastolic blood pressure</td></tr><tr><td>Average value</td><td>78.5</td><td>152.3</td><td>60</td><td>118.6</td><td>78.4</td></tr><tr><td>Standard deviation</td><td>18.6</td><td>25.6</td><td>19.4</td><td>19.7</td><td>7.3</td></tr></table>
Sixty percent of the participants answered that they do not smoke. Thirty-five percent of participants said they had quit smoking. Thirty-five percent of participants responded that they do not drink(Table 3). Of the participants, $60\%$ were alcohol drinkers, mainly drinking beer and wine (Table 4.)
Table 3 Smoking and drinking status of health class participants (20 dlderly females)
<table><tr><td rowspan="2">Smoking</td><td>No smoking</td><td>Stop to smoking</td><td>Smoking</td><td>No answer</td></tr><tr><td>12</td><td>7</td><td>0</td><td>1</td></tr><tr><td rowspan="2">Drinking</td><td>No drinking</td><td>Stop to drinking</td><td>Drinking</td><td>No answer</td></tr><tr><td>7</td><td>1</td><td>12</td><td>0</td></tr></table>
Table 4 Drinking frequency and content of 12 participants who drink alcohol (20 dlderly females)
<table><tr><td rowspan="2">Frequency</td><td>Every day</td><td>5~6/week</td><td>3~4/week</td><td>1~2/week</td><td>1~2/month</td></tr><tr><td>4</td><td>3</td><td>1</td><td>2</td><td>2</td></tr><tr><td rowspan="2">Content</td><td>Japanese Sake</td><td>Cocktails</td><td>Beer</td><td>Wine</td><td>other</td></tr><tr><td>1</td><td>1</td><td>7</td><td>3</td><td>0</td></tr></table>
Among the participants, $40\%$ took supplements such as calcium, iron, vitamin B, vitamin C, cod liver oil, chlorella, and green juice (Table 5).
Table 5 Frequency and Type of Supplement of health class participants (20 dlderly females)
<table><tr><td rowspan="2">Frequency</td><td>Do not take</td><td>sometimes</td><td>every day</td><td>no answer</td></tr><tr><td>11</td><td>2</td><td>6</td><td>1</td></tr><tr><td rowspan="2">Type</td><td>Ca</td><td>Fe</td><td>Vitamin B</td><td>Vitamin C</td></tr><tr><td>1</td><td>1</td><td>1</td><td>1</td></tr><tr><td rowspan="2">Type</td><td>Chlorella</td><td>Cod liver oil</td><td>Green juice</td><td>Others</td></tr><tr><td>1</td><td>1</td><td>1</td><td></td></tr></table>
Of the participants, $20\%$ had no exercise habits, and $35\%$ took walks (Table 6).
Table 6 Exercise habits (20 dlderly females)
<table><tr><td rowspan="2">Amount of exercise per week</td><td>Almost never</td><td>1~2 hours</td><td>3~4 hours</td><td>more than 5 hours</td><td>No answer</td></tr><tr><td>4</td><td>6</td><td>6</td><td>3</td><td>1</td></tr><tr><td rowspan="2">Amount of exercise per one year</td><td>Almost never</td><td>Sometimes</td><td>once a week</td><td>2 times a week</td><td>No answer</td></tr><tr><td>4</td><td>2</td><td>8</td><td>5</td><td>1</td></tr><tr><td rowspan="2">Frequency of walks</td><td>Almost never</td><td>1 time per week</td><td>2~3 times per week</td><td>every day</td><td>No answer</td></tr><tr><td>6</td><td>3</td><td>3</td><td>7</td><td>1</td></tr></table>
Among the participants, $30\%$ had 6 hours of sleep, followed by $20\%$ with 8 hours and $20\%$ with 7 hours (Table 7).
Table 7 Sleep hours, Bedtime, and Wake up time (20 dlderly females)
<table><tr><td rowspan="2">Sleep
hours</td><td>4 hours</td><td>5 hours</td><td>6 hours</td><td>7 hours</td><td>8 hours</td><td>No answer</td></tr><tr><td>2</td><td>2</td><td>6</td><td>4</td><td>5</td><td>1</td></tr><tr><td rowspan="2">Bedtaime</td><td>21 o'clock</td><td>22 o'clock</td><td>23 o'clock</td><td>24 o'clock</td><td>Irregular</td><td>No answer</td></tr><tr><td>2</td><td>6</td><td>8</td><td>2</td><td>2</td><td>0</td></tr><tr><td rowspan="2">Wake up
taime</td><td>4 o'clock</td><td>5 o'clock</td><td>6 o'clock</td><td>7 o'clock</td><td>Irregular</td><td>No answer</td></tr><tr><td>1</td><td>3</td><td>11</td><td>2</td><td>3</td><td>0</td></tr></table>
## IV. DISCUSSION
In this study, the participants lived independently (few people needed care or support), smoked less (only $20\%$ ), and drink less. Drinkers were mostly beer, around 350ml.
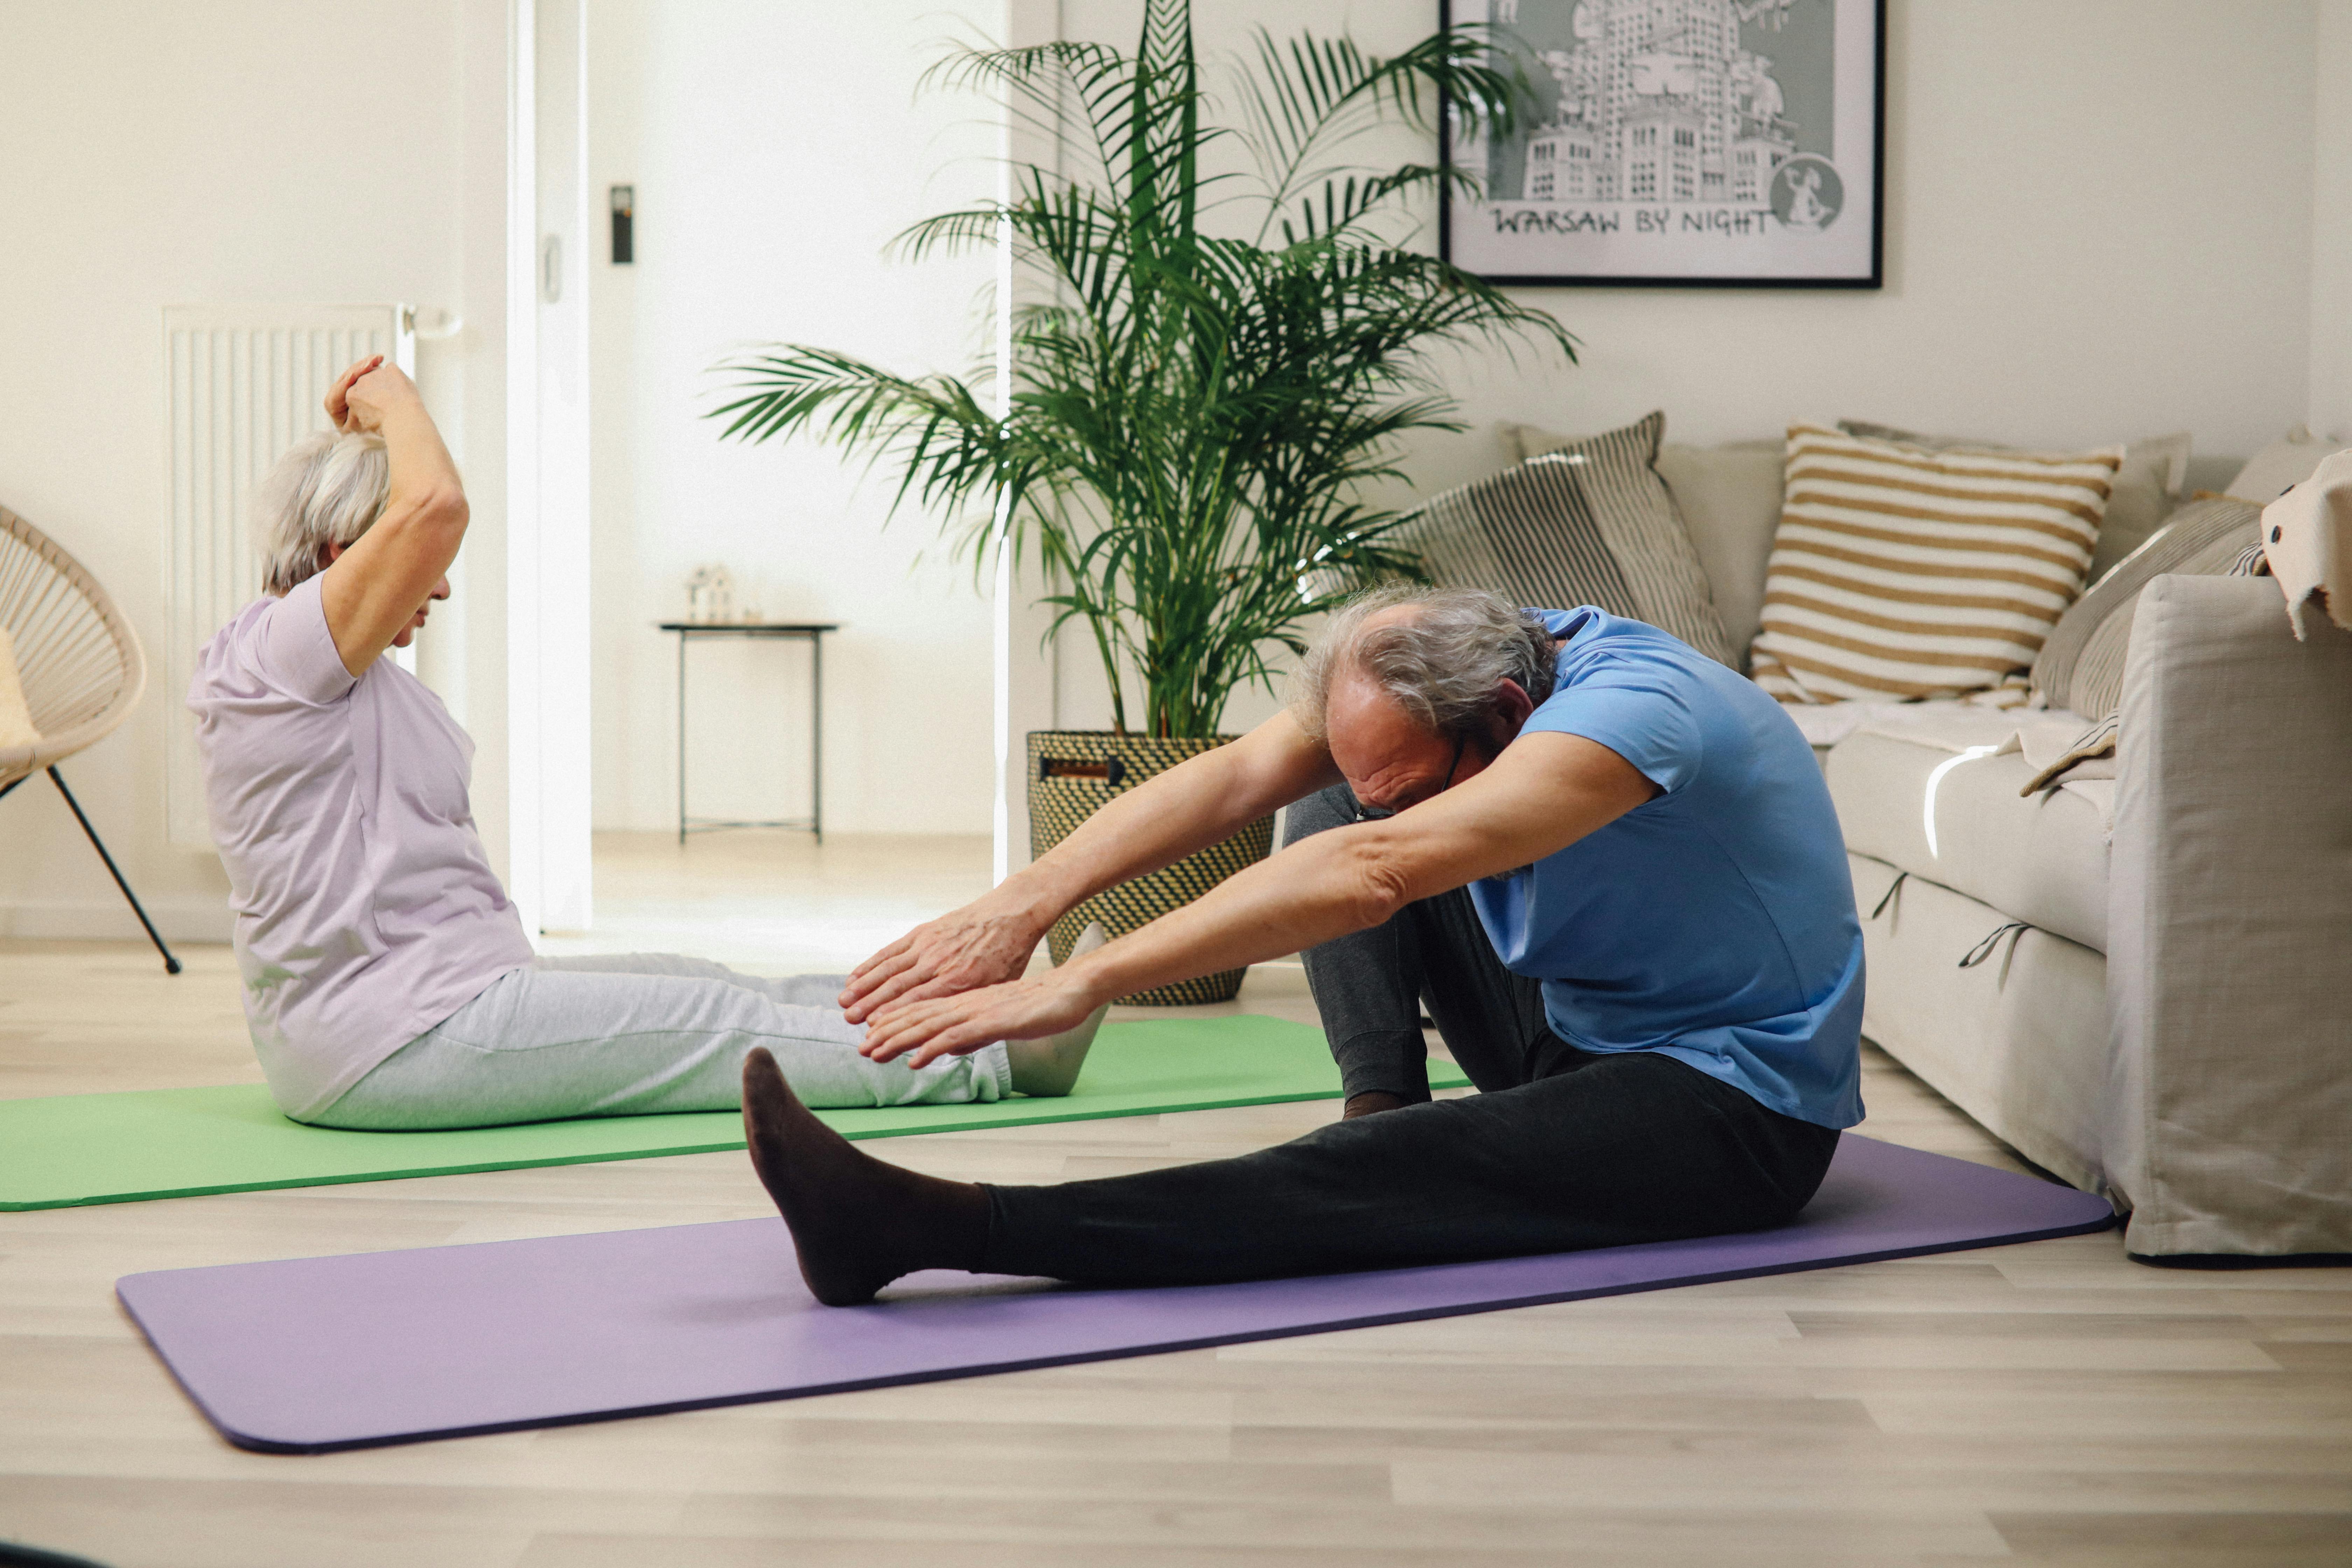
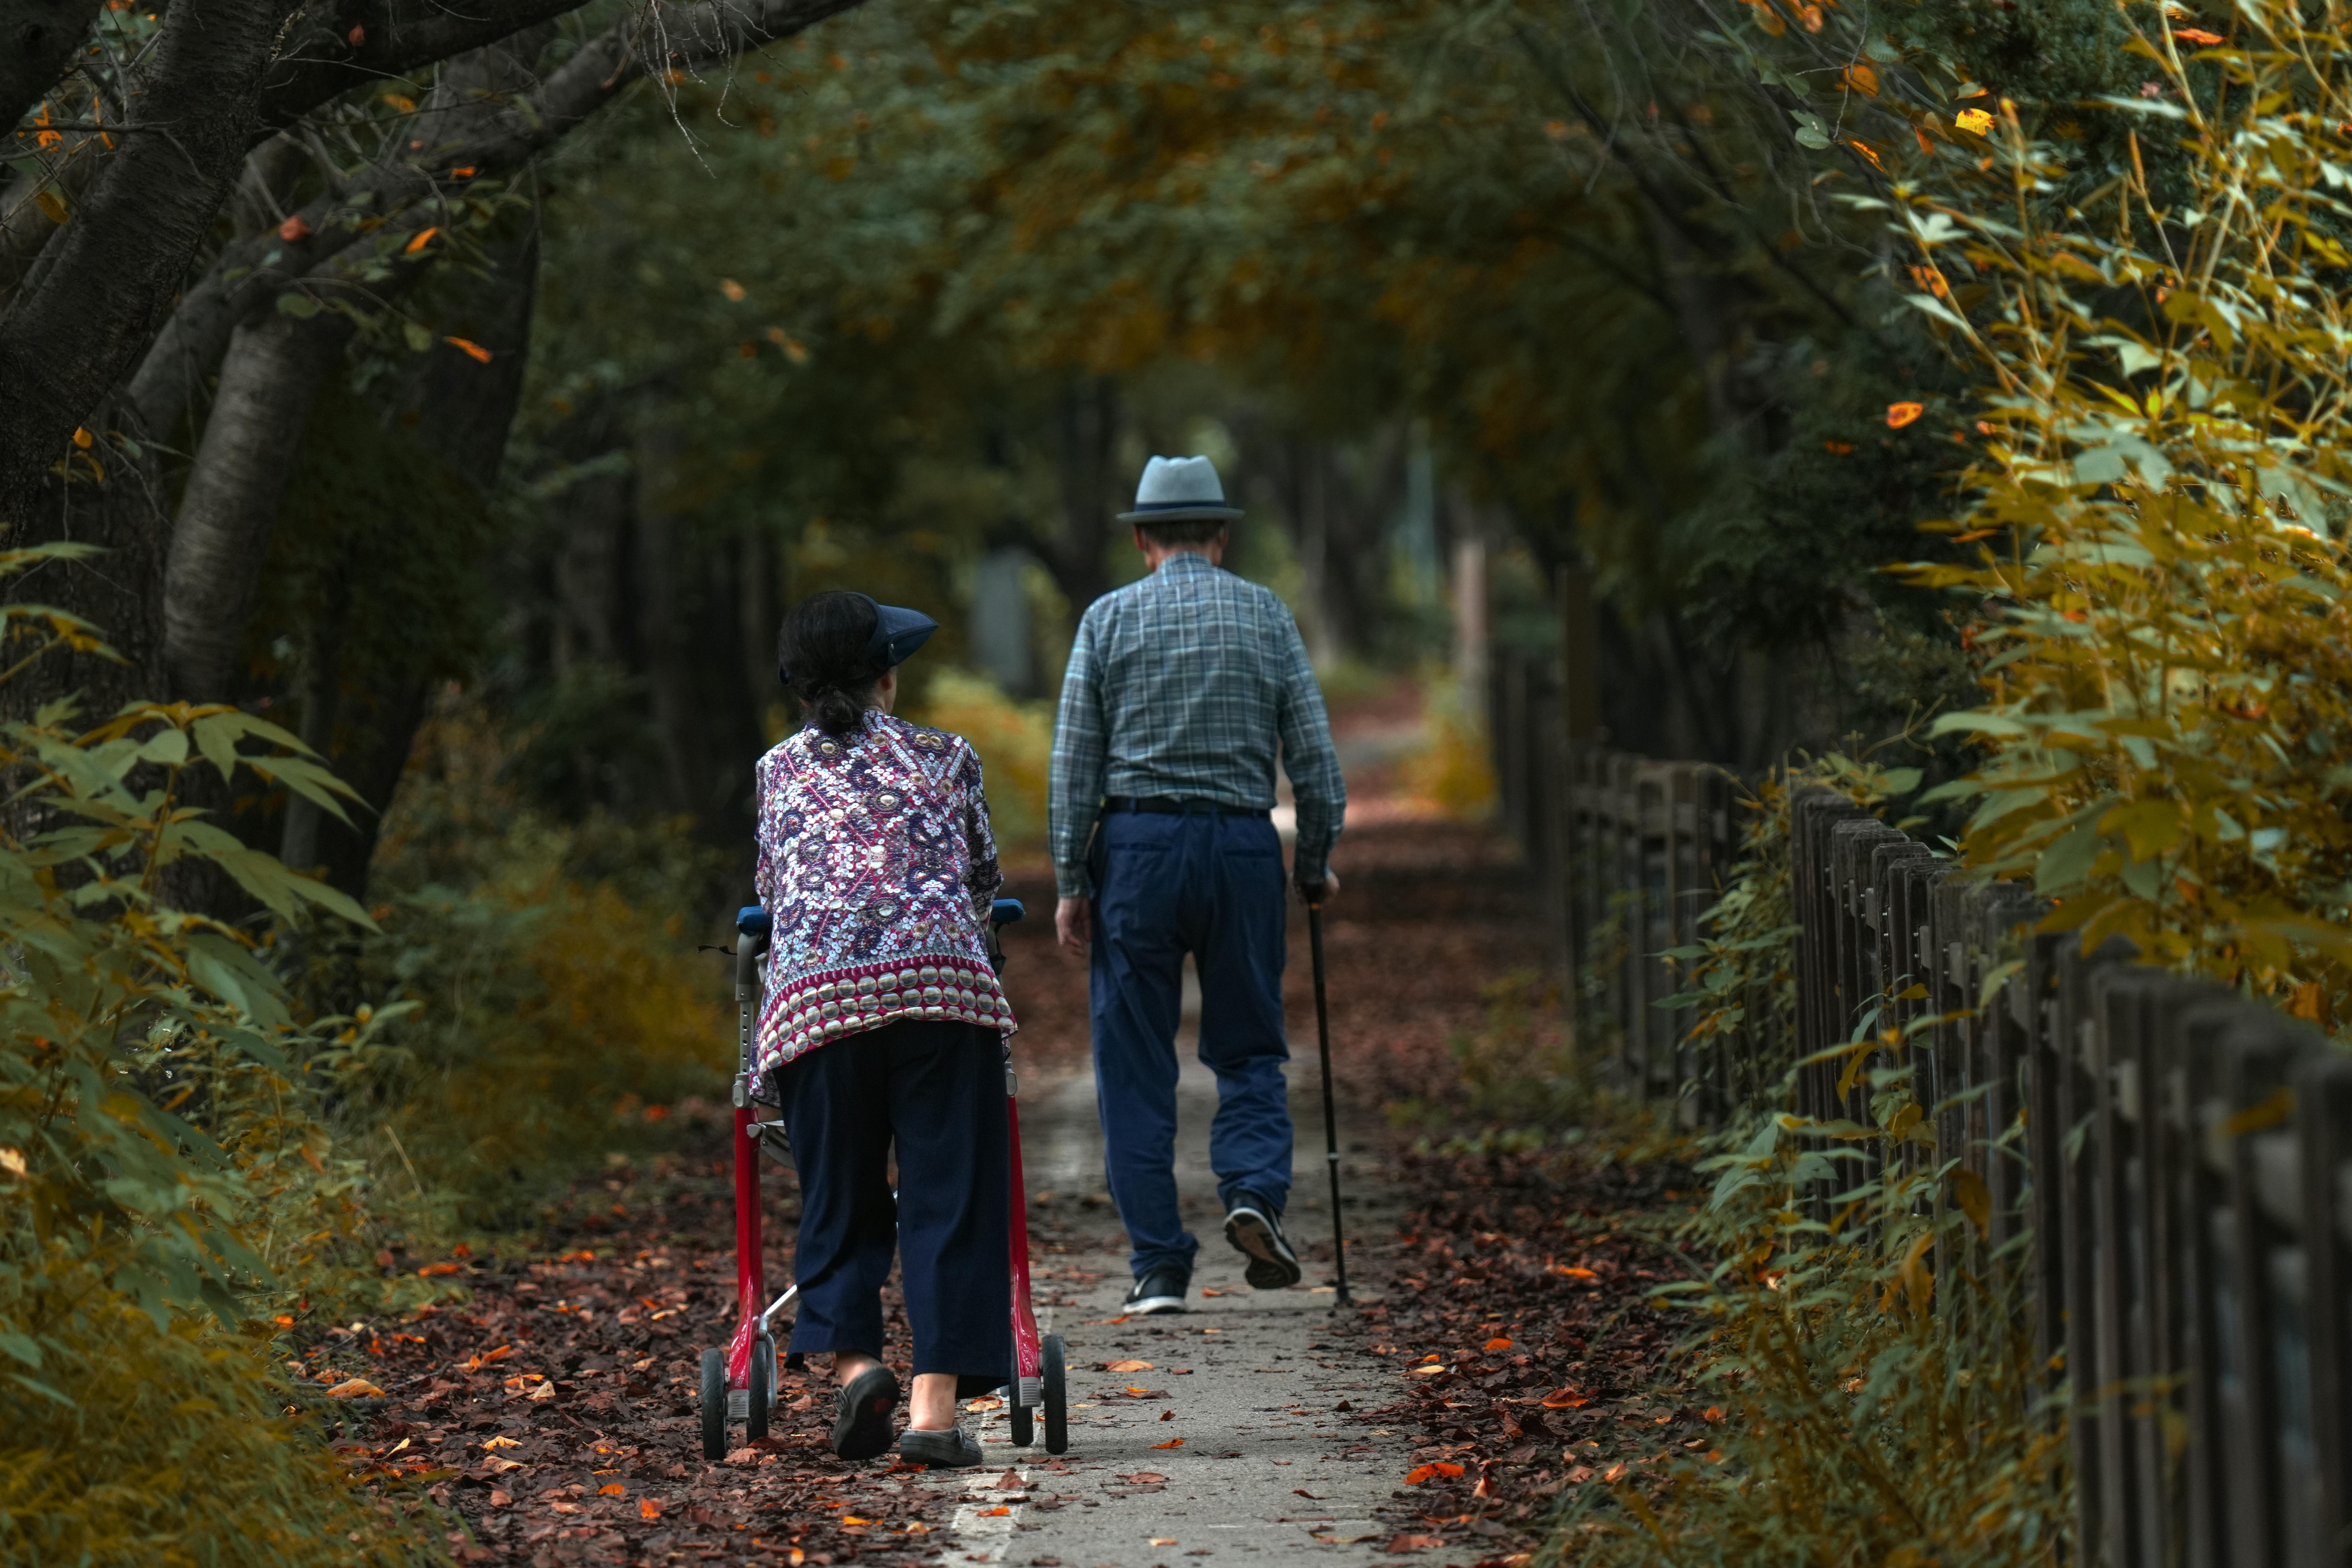
Among the participants, $40\%$ used supplements, mainly used calcium (Osteoporosis prevention), iron (anemia prevention), chlorella (nutrition supply), and green juice (vegetable shortage prevention). Most participants slept for 6 hours $(30\%)$ and $45\%$ of participants slept for 7 hours or more $(45\%)$. Most participants went to bed at 23:00 $(40\%)$ and woke up at 6:00 $(55\%)$. Many participants had a regular life time in the city. On the other hand, since $10 - 15\%$ of the participants lead an irregular lifestyle, we believe that it is necessary to encourage early to bed and early rise and light exercise (walking, etc.) that allows exposure to sunlight during the day time. It is conceivable that by confining such participants at home, their internal clocks would go out of whack without being exposed to sunlight, and their life rhythms would become irregular due to the inability to get good quality sleep. In this survey, $20\%$ of participants did not get enough exercise, and $30\%$ did not even walk. In the future, to increase the number of people who exercise regularly, we would like to hold more events such as health classes while checking the situation of COVID-19. Through these results, we would like to encourage more participants to go out of their homes, walk, meet people, and help maintain a regular life.
## V. CONCLUSIONS
A self-administered questionnaire survey in a small group of 20 elderly females in a health class revealed their lack of exercise. It is possible that the COVID-19 stay-at-home policy that has continued since 2020 has had a significant impact. In the future, while assessing the situation of COVID-19, we think that it is necessary to hold more events, recruit participants, and make efforts to get people out and restore their exercise habits. The US Physical Activity Guidelines recommend that all adults do at least 150 minutes of moderate-to-vigorous physical activity per week. It has become clear that inactive people are more likely to become severely ill than active people when contracting the coronavirus<sup>1)</sup>. Under COVID-19, as a result of measuring the number of steps using a mobile phone step counting application, it is reported that it is 3000 fewer steps per day in 1-2 weeks than before COVID-19<sup>2)</sup>. But on the other hand, from the UK around COVID-19, people have met 150 minutes or more of moderate-to-vigorous physical activity<sup>3)</sup>. It appears that the impact of CIVID-19 on exercise habits varies considerably from country to country. This may be differences in lifestyle habits, exercise habits, and national countermeasures in each country. From now on, we think it is necessary to obtain reports from many countries and cities and compare them.
## ACKNOWLEDGEMENTS
This study was supported by the Japanese Society of Taste Technology, 2022 and this research was partially supported by the research aid of Choju-iryo-kenkyu-kaihatsuhi, 2022 (30-14, Hirokazu Suzuki)
Generating HTML Viewer...
References
3 Cites in Article
Robert Sallis,Deborah Young,Sara Tartof,James Sallis,Jeevan Sall,Qiaowu Li,Gary Smith,Deborah Cohen (2021). Physical inactivity is associated with a higher risk for severe COVID-19 outcomes: a study in 48 440 adult patients.
Geoffrey Tison,Robert Avram,Peter Kuhar,Sean Abreau,Greg Marcus,Mark Pletcher,Jeffrey Olgin (2020). Worldwide Effect of COVID-19 on Physical Activity: A Descriptive Study.
Explore published articles in an immersive Augmented Reality environment. Our platform converts research papers into interactive 3D books, allowing readers to view and interact with content using AR and VR compatible devices.
Your published article is automatically converted into a realistic 3D book. Flip through pages and read research papers in a more engaging and interactive format.
Our website is actively being updated, and changes may occur frequently. Please clear your browser cache if needed. For feedback or error reporting, please email [email protected]
Thank you for connecting with us. We will respond to you shortly.