I. INTRODUCTION
Feed are highest cost occupied material in fish farming. Fish meal constitutes the major protein source used in commercial feeds. Fish meal has traditionally been used as the main feed ingredient in preparation of aqua feeds, due to high protein content and balanced amino acids profile (Mahmoud et al., 2014). Because of its recent sparseness in global production, coupled with increased demand and competition for its use in livestock and poultry feeds, its prices have become unaffordable (Poudel et al., 2020). As fishmeal is a scarce source, sole used of fish meal in aquaculture feed can lead to scarcity. So, for the sustainability in aquaculture feed system, alternative plant by product can be used as protein source. Past researches such as Al-kenway, Naggar and Zead (2008) and Shiau et al. (1990) have suggested to use plant protein sources to partially or completely replaced fish meal without reducing the growth performance on Tilapia (Agbo et al., 2011).
Tilapia (Oreochromis niloticus) is important aquaculture species in South Asia and is consumed regularly by locals when available (Shrestha et al., 2018). Tilapia belongs to Cichlidae family, it is warm water fish species. Because of its fast growth, tolerance to wide range of environmental condition, ready market, resistance to disease and stress, admissible to artificial feed, and ability to reproduce in captivity and short regeneration time all those aspects make it highly embrace by farmer in their farm.
Monosex tilapia O. niloticus does not breed/multiply, which makes it easy for fish farmers to avoid uncontrolled breeding in their farms.
Therefore, the study can prove to be beneficial to gain understanding of proportion of soybean meal that can be integrated in fishmeal-based diet without reducing growth and development of fish. The study also provides insight on economic benefit of the plant-based feed.
II. MATERIALS AND METHODS
a) Location
The experiment was conducted at Centre for Aquaculture-Agriculture Research and Production Pvt. Ltd. (CAARP), Khairahani-10, Kathar, Chitwan for 65 days (from July 2021 to Sept 2021). The site is located east from Narayanghat. The latitude is and longitude is .
The center has necessary infrastructure as large sized earthen pond and equipment's as breeding hapa, aerators, feeders etc. Fry was raised within the center which was economical and also ensure only healthy fries were used for research. Feed material required was easily available and economical in Chitwan district as it is one of the large producers of fisheries.
b) Experimental Design
The experiment was conducted in 12 hapa of with 20 fries in each hapa. The experiment was conducted in completely randomized design (CRD) having four treatments and three replications.
c) Research Set up
Necessary facilities like inlet, outlet, screening mesh, outlet valve etc. were cleaned and managed in pond and water level maintained as per requirement. In pond, water depth was maintained at .
d) Experimental Fish
Already prepared monosex tilapia fry on an average gram from hatchery was used for the research.
e) Experimental Diet Preparation
Four different types of experimental diets were formulated for feeding to tilapia fry during experiment. Shrimp fish were crushed into fine powered.
Step in soybean meal preparation:
At first, soybean was cleaned by removing waste material present in it.
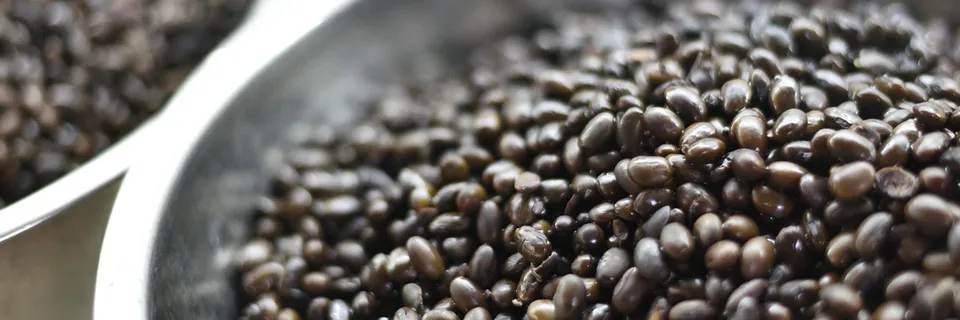
Soybean was roasted (heat treatment) to remove antinutritional factor (trypsin inhibitor, phytase inhibitor) present in it.
Finally, small size fine powder was made by crushing in the mincer.
While preparing the diets, dry ingredients of maize flour, rice flour and mustard oil cake was first grounded to a small fine size and mixed thoroughly according to calculated percent of each ingredient as shown in the table 1 to make required crude percent for each treatment. Four diets with same levels of dietary protein for Nile tilapia fry were formulated. Composition of experimental diet is shown in Table 1.
f) Packaging and Storage of Feed
Prepared experimental feeds were packed in air tight plastic bags of capacity of and stored in a refrigerator at .
| Ingredients | 100% FM (T1) | 50% FM+ 50% SM (T2) | 25% FM +75% SM (T3) | 100% SM (T4) |
| Shrimp meal | 45 | 30 | 20 | 0 |
| Soya full roasted | 0 | 30 | 50 | 65 |
| Maize flour | 15 | 15 | 12.5 | 2.5 |
| Rice bran | 15 | 15 | 12.5 | 2.5 |
| Mustard oilcake | 25 | 10 | 5 | 30 |
g) Hapa Preparation
Hapa was set at 30 cm above water surface. Water was enriched with organic and chemical fertilizer. Each hapa was set at distance of 15 cm from each other. Bamboo was used for staking and support. Stone was placed at the edge of hapa for the settlement of hapa.
h) Feeding
In week = Feeding rate 20% of body weight and frequency was 5 times (6 AM, 9 AM, 12 noon, 3 PM, 6 PM)
week = Feeding rate of body weight and frequency 4 times (6 AM, 10 AM, 2 PM and 6 PM).
week and then rate of body weight and frequency 3 times (6 AM, 2 PM and 6 PM).
i) Stocking
Altogether 240 tilapia fries of size were procured from CAARP for stocking in hapa. Fries were stocked at a density of 20fries/1m3 early in the morning at 7.00 am.
j) Sampling
Sampling was done fortnightly. Random sampling of population of stocked fry was done from each hapa and weighted (Digital pocket weighing machine) and growth measurements were recorded and required measurement was performed. Behavior of tilapia was regularly observed especially after feeding in the morning and in the evening to determine their conditions such as movement, infection, colorations and diseases. Sampling was continued until harvest.
k) Final Harvesting
Final harvesting of tilapia was done by draining each hapa completely on Oct 6, 2021. Weight of population of stocked fry were measured using digital pocket weighing machine. Fish were counted and, their batch weight was recorded.
i) Proximate Analysis of Experimental Diet
Quadrant sampling of prepared diets was done to draw representatives for proximate analysis. Proximate analysis of each experimental diet was done at National Animal Nutrition Research Centre, Khumaltar, Lalitpur. Proximate composition (dry matter, crude fiber, crude protein, crude fat, total ash, gross energy cal/g) of four treatment diet was calculated.
j) Water Quality Analysis
Temperature, pH, and Dissolved oxygen (DO) were recorded in daily basis (6 am, 2 pm, 6 pm) in pond. Temperature and dissolve oxygen were measured by using dissolve oxygen meter (Hanna HI 9147 DO meter) and pH was measured by Hanna HI 98128. While ammonia, were measured fortnightly by using instrument called Hach Ammonia test kit of pond between 7:00 to 7:30 am. Five ml sample in the vial with the help of 5 ml syringe was taken and 1 drop Ammonia Reagent I in the Vial sample was added and shake. Then 3 drops of Ammonia Reagent II were added and finally the observed color was immediately compared with Ammonia color chart. Turbidity was measured fortnightly by Secchi disk.
k) Economic Analysis
Economic analysis was conducted to determine economic returns of the four treatments tested during the experiments. The economic analysis was based on the farm gate price for the harvested fish and current local market prices for the all-other inputs. The benefit cost ratios of the different treatments were calculated by using following formula;
Total cost = Cost of feeds + labor cost Labor cost = Hapa preparation and installment Total Income = Total number of monosex fingerlings production × Price of monosex fingerlings (NRs/individuals)
The economic analysis was mainly based on farm gate price for the stocked and harvested fish and current local market prices for all other inputs in Nepal.
l) Statistical Analysis
The data was collected during the course of time and statistical analysis of data was carried out with Gen-Stat 15th edition. Effect of treatment was carried out using one-way analysis of variance (ANOVA), followed by a post hoc Duncan's multiple range tests. Differences were considered significant at the confidence level . All means were given with standard error (S.E.).
III. RESULTS AND DISCUSSION
a) Proximate Analysis of Experimental Diet
Proximate analysis of experimental diet is shown in Table 3. Fresh Dry matter percentage was highest in Soybean meal-based diet followed by Soybean meal Fishmeal, Fishmeal Soybean meal and Fishmeal. Fish meal-based diet had the highest crude protein than the other treatments. Highest ash percentage and crude protein was found in Fishmeal. Similarly, Energy was highest in Soybean meal followed by other treatments.
| Constituents | Fresh Dry Matter (%) | Crude Protein (%) | Ash (%) | Crude fiber (%) | Energy (cal/g) |
| T1 | 88.55 | 27.07 | 14.46 | 7.44 | 30961.9 |
| T2 | 88.64 | 26.9 | 10.04 | 5.57 | 40445.7 |
| T3 | 90.39 | 26.3 | 7.43 | 7.26 | 42195.3 |
| T4 | 91.29 | 26.3 | 4.89 | 6.72 | 40856.2 |
b) Growth Parameter
A mean weight of about size fry were stocked at the beginning of the experiment in all treatments which were not significantly different with each other. The analysis of variance indicated that there was no significant difference in weight gain among T1, T2, T3 and lowest was found in T4. Up to replacement, methionine is supplied by fishmeal. Replacement by soybean meal (100%) may have drastically reduced methionine content in diet. Insufficient dietary methionine reduced the growth performance and protein utilization (Sveier et al., 2001). Low growth in complete replaced fishmeal diet with soybean meal could also due to increase in carbohydrate component (Chou et al., 2004).
There was no significantly different in specific growth rate of Tilapia between T1, T2, and T3 and lower specific growth rate was obtained in . The data are also supported by other authors. Sharda et al. (2017) have also found significant difference on specific growth rate when fishmeal was completely replaced by soybean on Tilapia fish. Studies show that replaced proportions of feed can be used for tilapia production.
Similarly, there was no significant difference in survival rate with each other. Jahan et al.
(2007) reported that fishmeal protein in the diet of Tilapia fingerlings could be replaced by defatted soybean meal without any significant reduction in growth. Davies et al. (1989) suggested that commercial soybean meal could be replaced up to of fishmeal protein in diet of tilapia with no significant reduction of average final weight. Shiau et al. (1990) also observed that defatted or full fat soybean meal could be used to replace fishmeal protein in a diet for tilapia (Jahan et al., 2007).
| Treatments | Initial weight (g) | Weight gain (g) | Survival | Survival (%) | Specific growth rate |
| 0.1±0.00a | 12.16±1.52a | 17.33±0.88a | 86.67±4.41a | 7.37±0.18a | |
| 0.1±0.00a | 11.54±1.90a | 16.00±1.00a | 80.00±5.00a | 7.28±0.24a | |
| 0.01±0.00a | 9.78±1.83a | 17.67±1.45a | 88.33±7.26a | 7.01±0.28a | |
| 0.1±0.00a | 5.1±0.74b | 17.33±1.20a | 86.67±6.00a | 6.05±0.21b | |
| F-test | * | * |
c) FCR, PER, Feed efficiency, Condition Factor
The result show that analysis of variance indicated no significant difference on FCR, Feed efficiency and condition factor among the different treatment means (Table 6).
The data also supported by other articles. Yanti et al. (2019) in his research in Lates Calcarifer shows that feed conversion ratio and feed efficiency were not significantly different between the treatment.
In the case of protein efficiency ratio, the lowest PER was seen in SBM and highest was seen in FM+ SBM which was significantly different with each other. Protease inhibitors and Phytic acid in soyabean reduce protein digestibility by inhibiting protease activity and destroying the structure of the intestinal mucosa, leading to the low availability of dietary protein (Kuba et al., 2005; Francis et al., 2001)
| Treatments | Food Conversion Ratio (FCR) | Protein Efficiency Ratio (PER) | Feed Efficiency | Condition Factor (CF) |
| T1 | 0.43±0.03a | 0.42±0.05ab | 0.71±0.08a | 1.50±0.23a |
| T2 | 0.37±0.11a | 0.44±0.07a | 0.64±0.10a | 1.28±0.24a |
| T3 | 0.32±0.12a | 0.37±0.06ab | 0.54±0.10a | 1.09±0.17a |
| T4 | 0.30±0.02a | 0.19±0.02b | 0.64±0.09a | 1.78±0.04a |
| F-test | * | |||
d) Water Quality
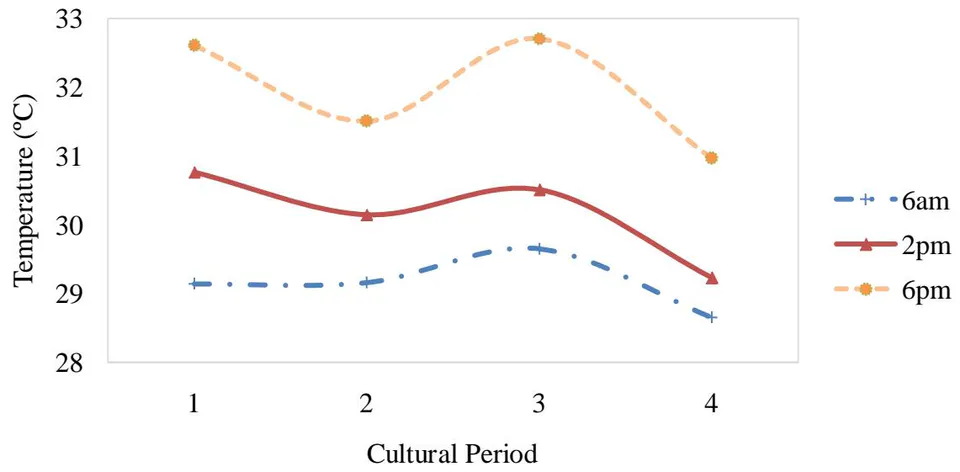
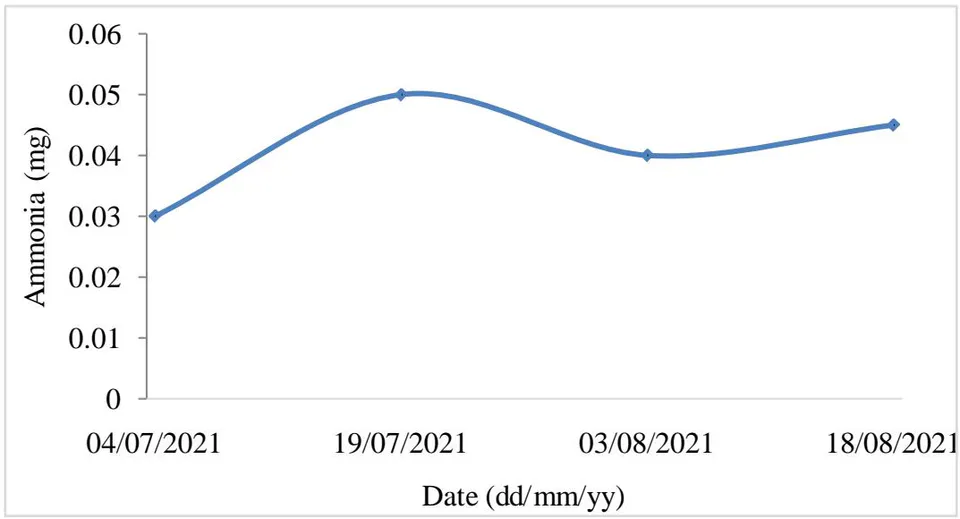
Mean temperature, dissolved oxygen of the water was measured daily in morning, noon and afternoon, pH, turbidity and ammonia were measured fortnightly are shown in the following figures:
e) Temperature
Temperature play role in fish metabolic rate and thus their energy balance and behavior, including locomotor and feeding behavior. Temperature strengths the ability of the fish to obtain food, and how they process food through digestion, absorb nutrients within the gastrointestinal tract, and store excess energy (Makori et al., 2017).
f) Dissolved Oxygen
Dissolved oxygen (DO) is a critical environmental indicator in aquaculture. Depleted DO is the leading cause of fish kills, and fish farmers know that low-oxygen conditions are their worst enemy.
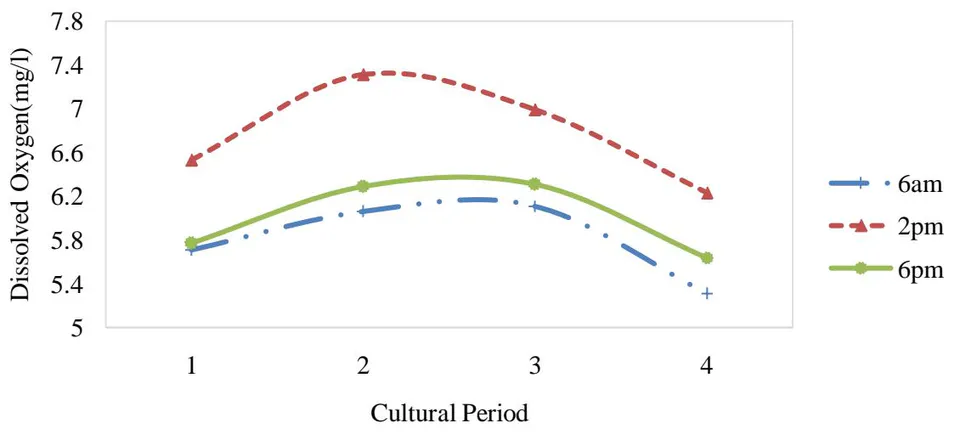


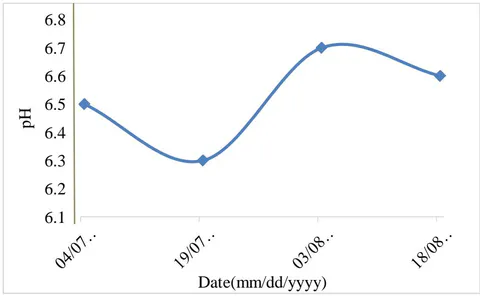
Figure 3: Fortnightly Mean pH of Pond during Experimental Period
Figure 3 shows that pH range was favorable during the entire research period. Bryan et al. (2011) concurs that most fish would do better in ponds with a Ammonia
Turbidity
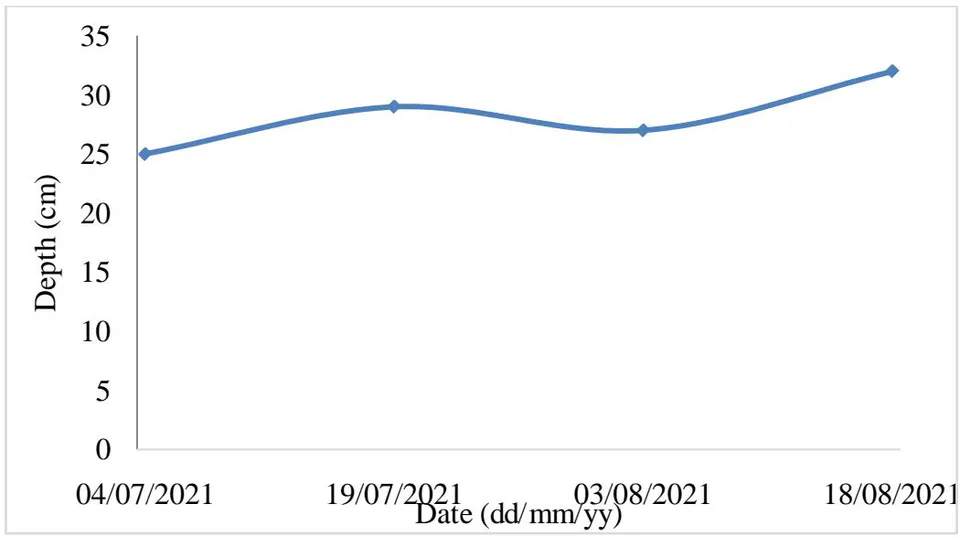
Figure 5 shows the turbidity level of water during experimental period. The number of feeding attempts made by tilapia was not affected by turbidity, suggesting that its propensity to initiate feeding may be higher in turbid water while its overall foraging success may be unaffected (Wing et al., 2021).
g) Economic Analysis
Analysis of variance on Benefit cost ratio indicated significant difference among the different treatment means. The higher B: C ratio of feed was recorded in T3 followed by T1 and T2. Along with it, relatively lower B: C ratio was found in treatment four. Poot-López and Gasca-Leyva (2009) when fed meal by partially substituting meal with O. niloticus with tree spinach (Cnidoscolus chayamansa) also found substantial reduction in cost of management and operating costs without any negative effect on growth of fish. Subedi et al. (2019) states that in tropical fish production food constitute major expense, so replacement of fishmeal by soyabean based meal would minimize the cost of production by optimizing the cost benefit ratio while scaling up the production.
| Treatment | B: C Ratio |
| T1 | 1.323±0.06b |
| T2 | 1.31±0.09b |
| T3 | 1.350±0.11a |
| T4 | 1.30±0.07c |
IV. CONCLUSION
The findings of the present study concluded that there was no significant difference in weight gain by replacing fish meal up to and lowest weight gain was obtained by fish meal replacement. The total feed cost was minimized by replacing soybean meal in fish meal diet. It can be concluded that fish meal can be replaced upto soybean meal in the diets without decreasing the growth performance and survivability at low cost. Soybean grain should be roasted and dehulled before feeding to inactivate the negative effect of different phytoestrogen activity present in it.
ACKNOWLEDGEMENT
We would like to acknowledge Institute of Agriculture and Animal Sciences (IAAS) and Centre for
Aquaculture-Agriculture Research and Production Pvt. Ltd. (CAARP), Khairahani-10, Kathar, Chitwan for opportunity and kind cooperation throughout the study.
Conflicts of Interest
There are no conflicts of interest.