## I. INTRODUCTION
The use of the sensitivity functions of agricultural plants gives the opportunity to program productivity, requirements for machines and technologies, and the means of application of solid mineral fertilizers in the agricultural system (Pyataev M.V. 2014). The technological process of supplying different types of solid mineral fertilizers with structural machines consists of several technological operations that determine its direction (Mitchell D.1975). In order to prepare the technological process of introduction of solid mineral fertilizers, it is necessary to know the methods of application of fertilizers, their physical and mechanical properties, and to have machine complexes that ensure the fulfillment of agrotechnical and ecological requirements during cultivation (OST. 70.71 - 2000). Machines with a centrifugal working body apply powder and granular fertilizers over a large variable working width (Simakin A. I. 1988, Sedashkin, A. et.al. 2013). The main drawback of these machines is the uneven distribution of fertilizers, especially when working on slopes. These traditional disadvantages of the work of machines with centrifugal working bodies are the main reason for the intensive search for other constructive solutions. Therefore, machines with centrifugal working bodies are improved both in our country and abroad mainly in order to improve the uniformity of sowing and increase productivity. One of the main agrotechnical indicators of the operation of mineral fertilizing machines is the provision of even distribution of mineral fertilizers in the field (Abbasov i.D. 2011, Alakbarov J.Q. et.al. 2001).
Due to the soil climate in the republic, for a number of reasons, it is advisable to use additional sowing of fertilizers in excess of the basic norm. First of all, this allows to refuse the production and release of a large number of technical means (Merzlikin A.S., et.al. 1995). As already mentioned, it is necessary to accurately determine the fertilizer rate for the planting stock of fertilizer plants. Compliance with this condition also requires the high quality of fertilizers: nutrients, humidity, granulometric result and the strength of granules, which affects more distribution of sowing on the field (Alakbarov F. 2016).
This is due to the fact that, for the first time, machines equipped with working bodies of the disc spreader type are larger than the design width of the working width of the machine itself (Sendryakov I.F., et. al. 1976., Klyatis L.M., et.al., 1979). Therefore, it is necessary to mark the field or equip the machines with markers to ensure the desired working width. It causes environmental pollution. The inhomogeneity of the field of nutrients created during fertilization is the main reason for the unevenness of many crops (Mitchell D. 1974, Nasonov V.A. 1984). Cereal plants also cause yield loss, some plants can reach $25 - 60\%$. According to the literature, depending on the structural characteristics of the sown and the quality of the fertilizers sown, the applied fertilizer can be unevenly distributed between
40-60% of the norm, which leads to nutrient deficiency. (Adamchuk B.V. et.al. 2004, Ostanin A. I., et.al., 1971)
An increase in the distribution rate of uneven strength fertilizers to $70 - 80\%$, a decrease in the yield of cereals by 11-15 s/ha was observed. The researchers of foreign scientists can also find that the yield in the areas paid for by fertilizers, the applied application of uneven fertilizers, the yield is on average $15\%$ higher. Therefore, it is advisable to study the impact of local and foreign materials and the quality of fertilizer payment on the entire field, and the application of uneven fertilization machines of the field is created (Bagirov B. et. al. 2018).
## II. MATERIAL AND METHODS
Research studies were conducted through literature, patent and internet searches, as well as advanced advanced research. When checking the newly developed combined plough, the established standards were used: (Afanasyev R.A., 2006)
1. General purpose boilers, methods of field tests - GOST-2911
2. Forestry and agricultural machines and tractors. Test admission rulesGOST 28305-89, (STSE 6546-88).
3. Test of K/T technique - Ost 70.4.2.-80
4. OST 70.2.16-72 in the evaluation of the main operational-technological inspections
The main indicators of the goal determined in the process of farm trials are:
1. Ensuring the equality of distribution of fertilizers on the working area,%;
2. Ensuring the equality of distribution of the fertilizer application rate along the length of the machine passage,%.
The purpose of the technological process and the evaluation of the quality indicator include the following:
1. Deviation of the actual application norm from the set norm;
2. Determining the unevenness of the application;
3. Determining the unevenness of the fertilizers along and across the field;
4. Determination of the working speed of the machine for uniform spreading of fertilizers;
5. Determining the productivity of the machine for uniform spreading of fertilizers.
Fertilizer application rate (Q) in kilograms per hectare is calculated by the following formula: (Adamchuk W., 2003)
$$
Q = \frac{10\,q}{L\,B};
$$
Here:
q - the mass of fertilizers sown during the repetition of the experiment, gr;
L - length of the calculation area, m;
B – the width of the combined plough, m
The accuracy of the actual fertilizer application rate from the normalized determination as a percentage of the application working width ( $\Delta Q$ ) is checked by the following formulas:
$$
\Delta Q = \frac {Q _ {y} - Q _ {f}}{Q _ {f}} 1 0 ^ {2}; \tag {3.7.2}
$$
$$
Q = Q_{y^{1}} \frac{V_{y} B_{y} \gamma_{y}}{V_{f} B_{f} \gamma_{f}};
$$
Here:
$Q_{y}$ is the norm of fertilizer application, the actual worker of the application reduces the best, kg/ha $^{-1}$;
$Q_{f}$ - the actual rate of fertilizers in the working width of the application at the beginning of the application period, kg/ha $^{-1}$;
$Q_{y1} -$ set fertilizer rate, kg/ha;
The testing program of the solid mineral fertilizer dispensing machine includes:
1. Technical expertise;
2. Evaluation of the purpose and technical characteristics of the car;
3. To evaluate the performance of the process;
4. Assessment of the quality of the technological process.
## III. RESULTS
The structural model shown in Fig. 1. can be used to estimate the cost impact of uneven fertilization. However, research conducted in the republic and abroad has determined that the application of fertilizers in the scattering of modern machines causes not only fertilizer loss, but also environmental pollution. The actual anthropogenic characteristics of the soil in the fields depend on the uneven application of fertilizers by machines with spreading working bodies, which often varies up to $40\ldots 60\%$ in farm conditions. At the same time, the use of high rates of fertilizers leads to an increase in the risks associated with a decrease in productivity as a result of low-quality fertilization.
The high static strength of granular fertilizers at least $2.0\mathrm{MPa}$ ensures preservation of the granulometric content of fertilizers during application of fertilizers with modern machines.
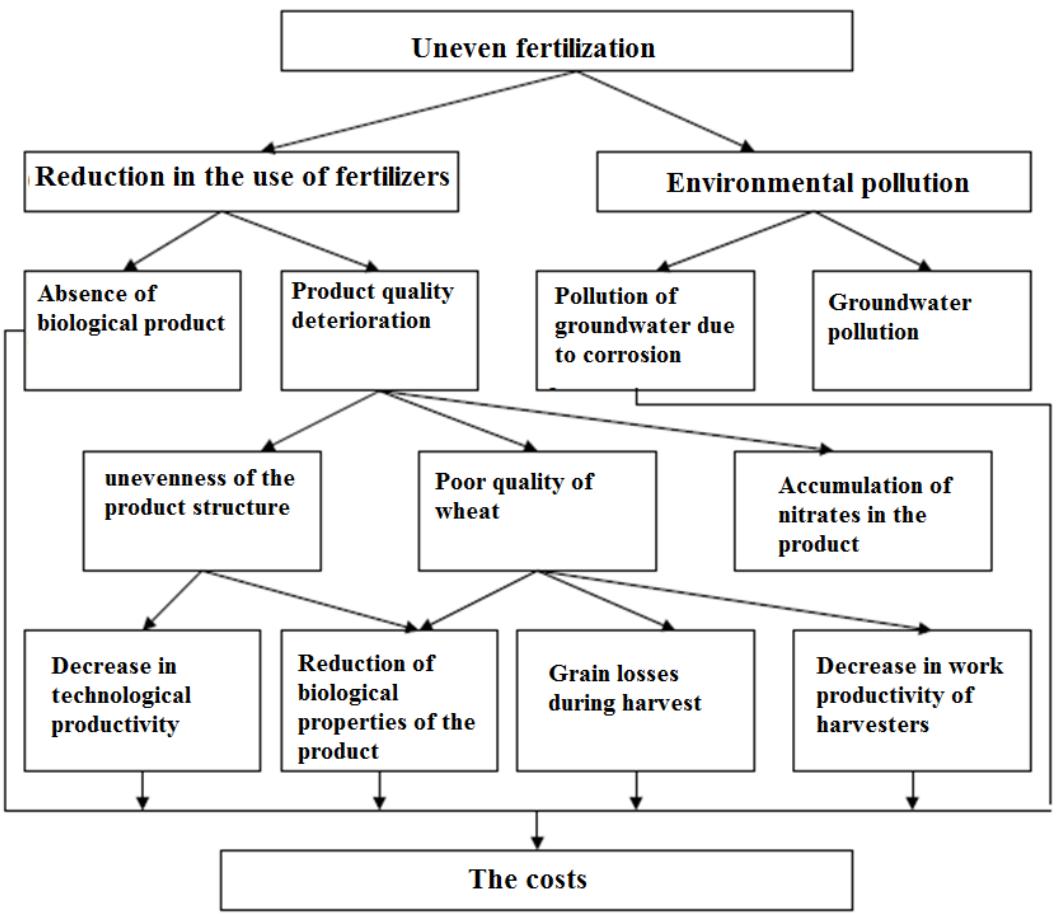 Fig. 1: Structural Model of Uneven Fertilization Management
According to the modern strategy, all decisions related to soil-plant impact are based on the average parameters of the cultivated area. If the illegality of the application exceeds the agrotechnical requirements, the content will be as follows(Pyataev M.V.,2010):
1. Exponential increase in the price of irreplaceable energy;
2. Increase in environmental pollution;
3. High variability of productivity and product quality.
All the above-mentioned indicators of the properties of fertilizers and technologies of application of fertilizers in the cultivation of plants were obtained while developing the agrotechnical requirements of new fertilizer spreading machines.
As can be seen in the picture Fig. 2, two ATP-2 fertilizer spreaders were installed on the plough. Movement of the devices is provided by the support wheel of the plough. The rate of fertilizer application is regulated by the change of stars. The scheme of technological process of the combined plough is shown in Fig. 2. The combined plough consists of two ATP-2 fertilizer spreaders (3) mounted on a Turkish-made SP-12 4-body plough (1). Fertilizers (3) receive movement from the plough support wheel (7) by means of chain transmissions (2). The support wheel is equipped with rebar to prevent slipping. Fertilizers, moving from the support wheel, spread the fertilizer under the plow through four fertilizer pipes (5). A smooth spreader (8) is attached to the outlet of the pipes to ensure even distribution of fertilizers. The use of a combined plough before plowing completely reduces the operation of fertilizer application by fertilizer machines, its cost and labor costs, while ensuring high efficiency of fertilizer use, ie the submission of fertilizer to the ground prevents its loss, ensures even distribution, etc. In addition, it saves a lot of time and allows you to perform operations in a short time (Qurbanov H.N., 2023).
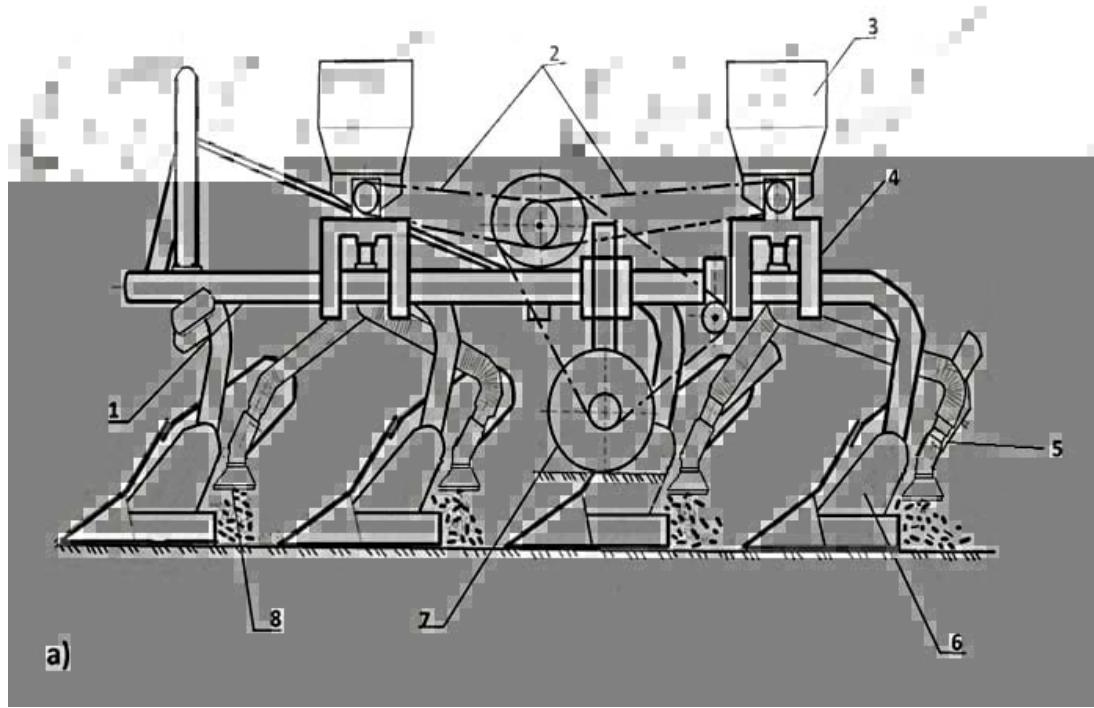 Fig. 2: Combined Plough. (a) Side View
1- plough frame, 2-chain transmission, 3-fertilizer, 4-fertilizer connecting frame to plough, 5-fertilizer transfer pipe, 6-plough body 7-moving support wheel, 8-smooth spreader,
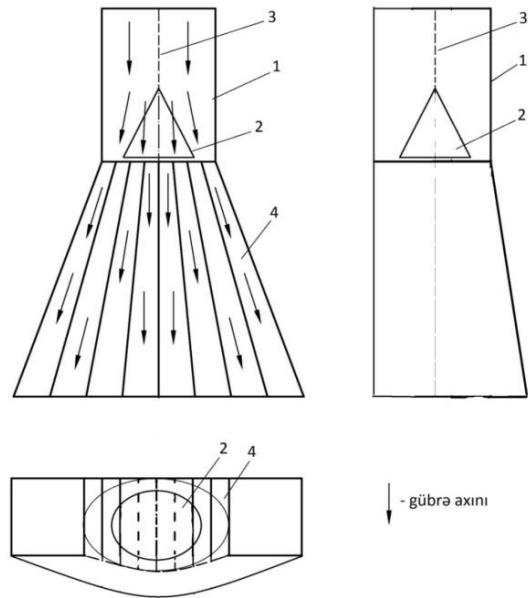 Fig. 3: Smooth Scatterer 1 - main face, 2 - cone with pendulum, 3 - chain, 4 - partitions
The experimental studies of the laboratory products of the technological process of sowing of solid mineral fertilizers show that the technological process of the fertilizer sowing norm is observed during the removal of granular fertilizer with a physical weight of more than $300\mathrm{kg / ha}$. In addition, in addition, uneven distribution of fertilizer parts falling from the flow pipe in the soil is observed, which is around $40\%$. Experimental studies were carried out in the laboratory on the basis of a suitable device for 4 angle slope checks of the newly made smooth scattering part(Qurbanov H.N., 2022).
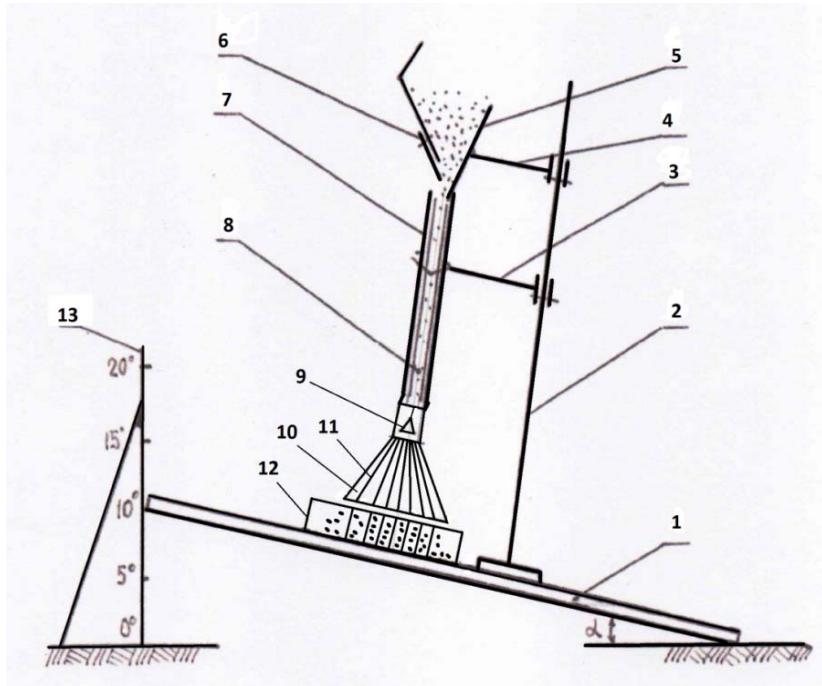 Fig. 4: Device for Determining the Scattering Equation of a Smooth Disperser
1- main support; 2- tripod; 3; 4 - holder; 5 - fertilizer box; 6 - valve regulating the fertilizer rate; 7 - cover of the fertilizer pipe; 8 - fertilizer pipe; 9 - pendulum cone; 10 - fertilizer distributor; 11 - partition; 12 - partition container for pouring fertilizer;13 - regulating the inclination along the vertical support In the laboratory, the main 3 types of fertilizers were selected (urea, double superphosphate, potassium chloride) and the spreading percentages of
the poured fertilizer were additionally determined in 8 partitioned containers.
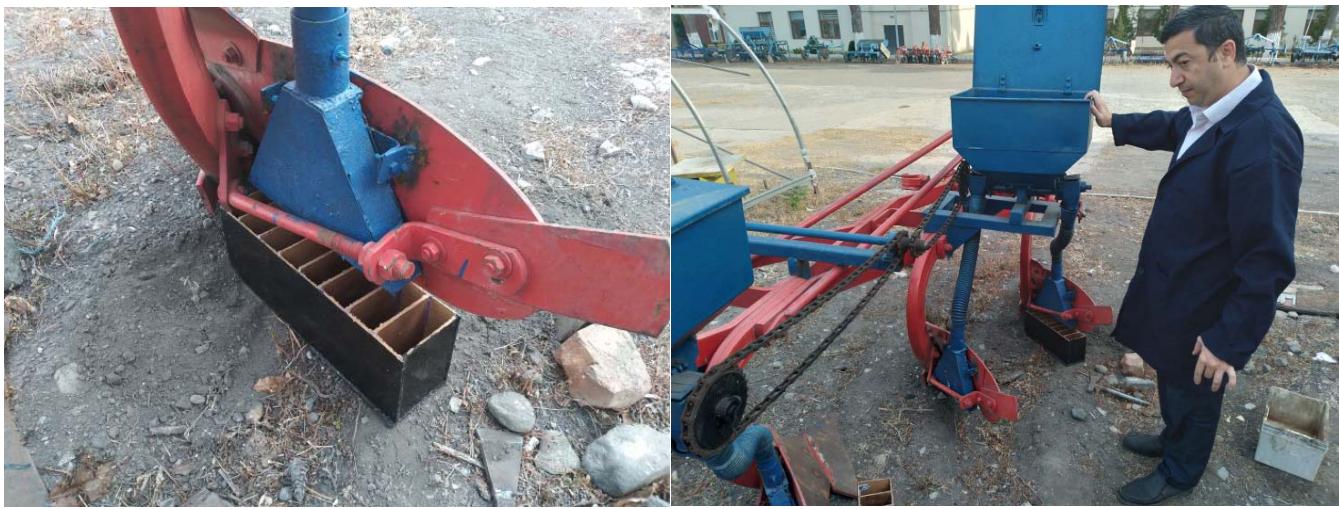 Fig. 5: Laboratory Tests
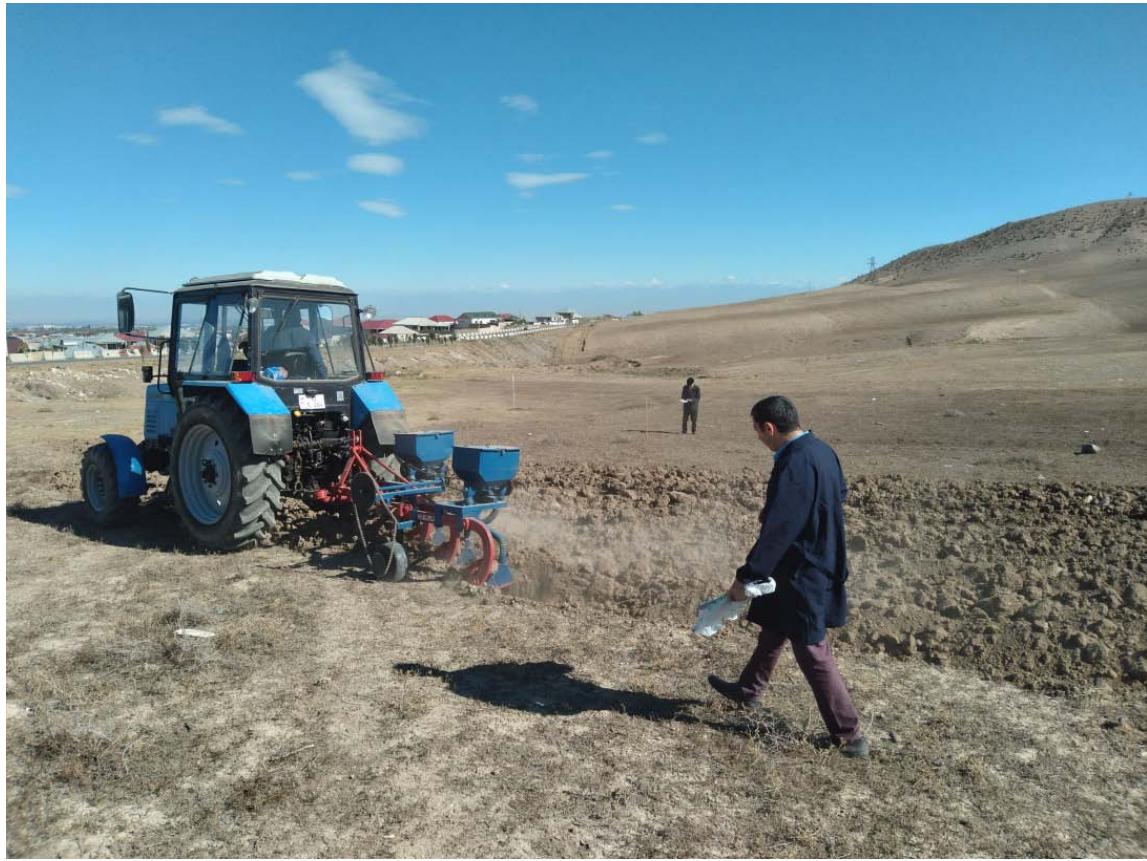
Conducting a field trial. A sloping site in the Goy-Gol area was chosen for the implementation of the experimental research.Before starting the research, 3 types of fertilizers were taken, moisture was measured with a KE-108 measuring device, $9\%$ in urea; it was $8\%$ in double superphosphate and $8\%$ in potassium chloride.
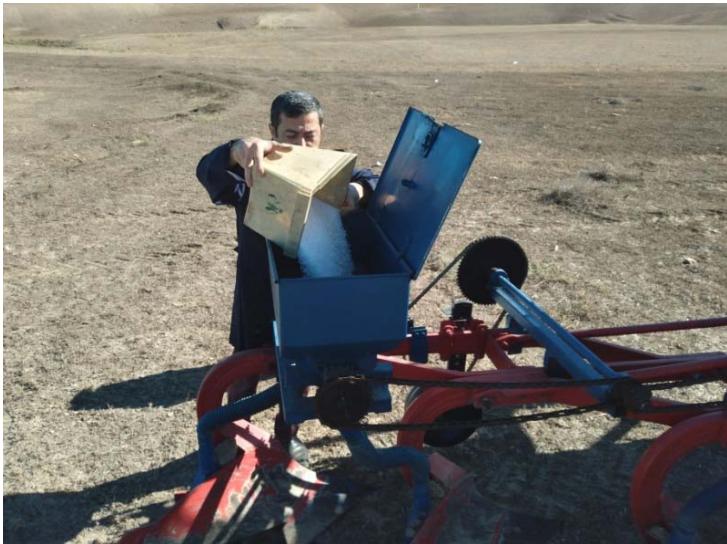 Fig. 6: A Field Test
The inclination of the slope was measured with an "Eklimeter" brand device, with an inclination of $5^{\circ}$, $10^{\circ}$, $15^{\circ}$, and the research area was selected. Soil moisture was measured with a KE-108. device and was $18\%$
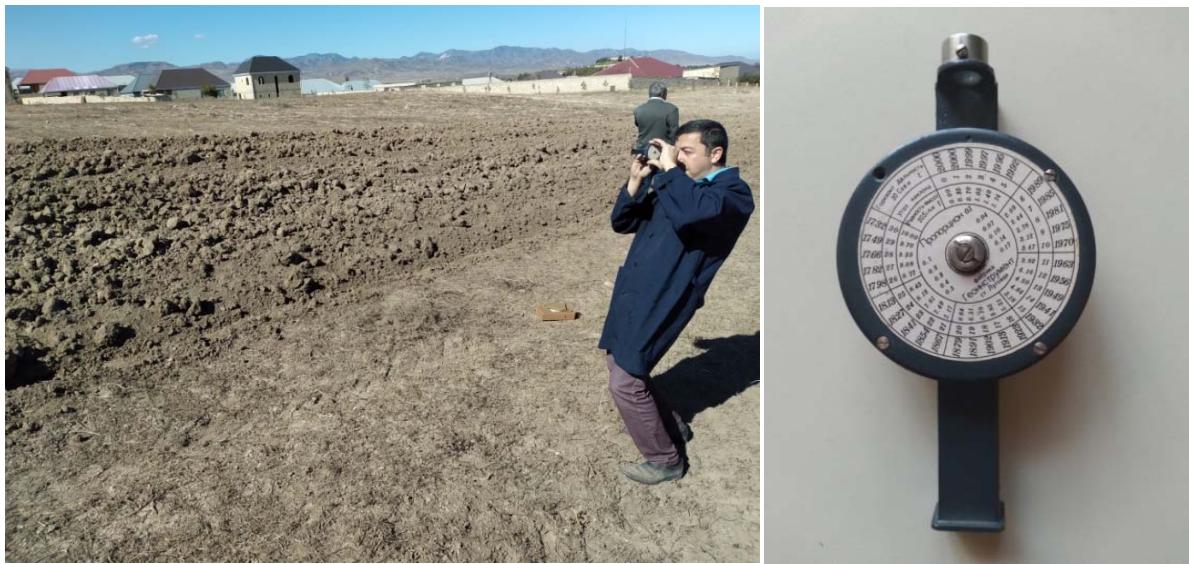 Fig. 7: The Device Measuring the Angle of Inclination of the "Eklimeter" Brand
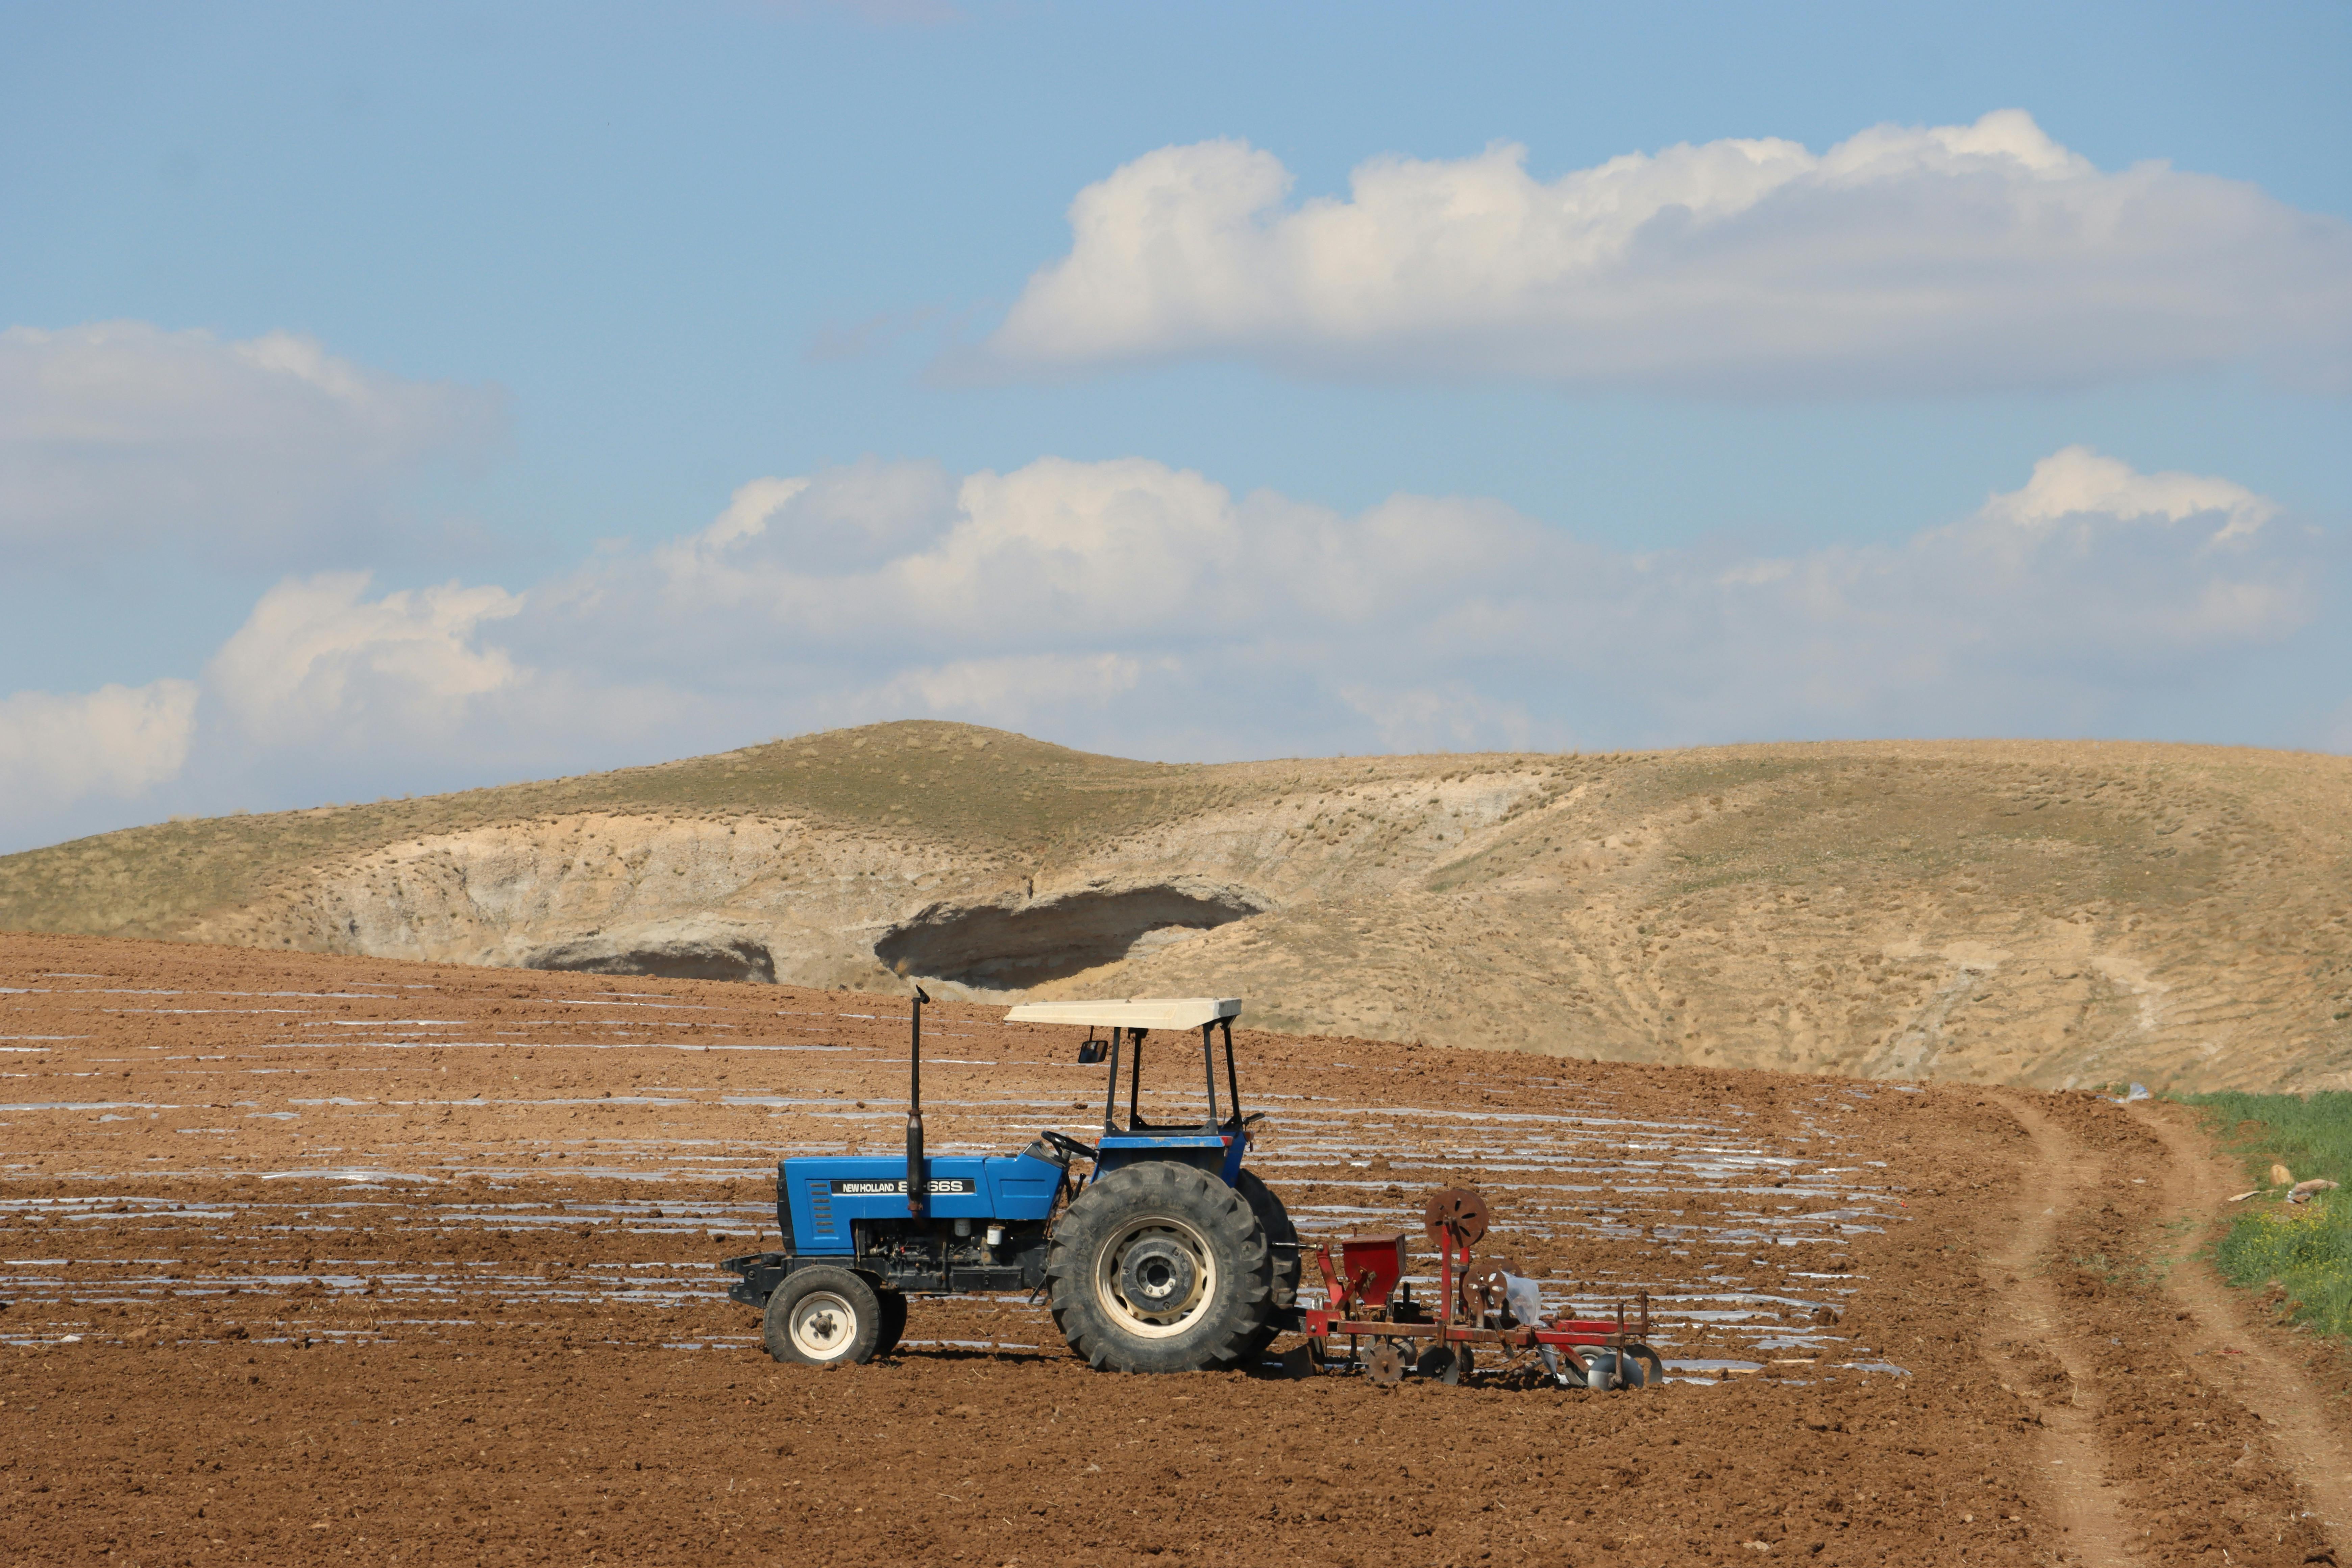
By filling two hoppers with the capacity of the combined plough, the slope width speed and aggregate movement condition were detected, 4 tests and 5 repeated operations were performed. for three types of fertilizers

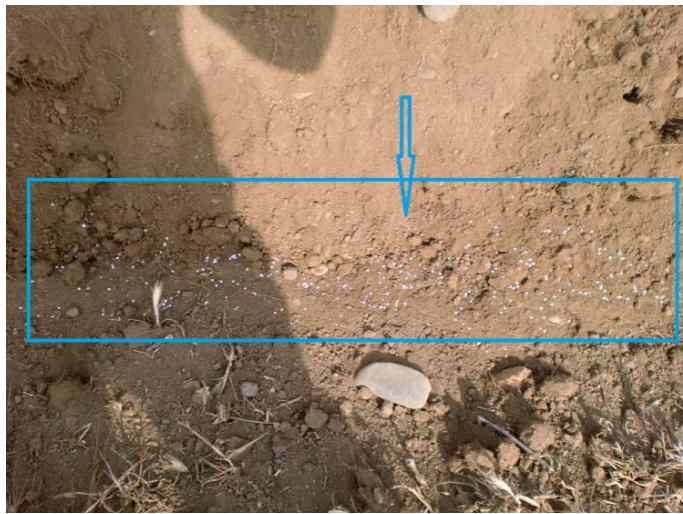 Fig. 8: Field Testing of the Combined Plough Şakil 9: The State of Application of Urea Fertilizer to the Soil
## IV. DISCUSSION
Reliability of distribution according to the technological scheme can be achieved under the condition that the selection of structural dimensions of the smooth spreading part allows optimal fertilizer distribution (Serzhanov I. M. 2013).
Optimization of the main structural parameters of the smooth scattering working body. The dimension parameters of the pendulum cone, which is the working body of the smooth scatterer, are taken as the basis of the cone (tg $\gamma$ ) angle, cone height (h), cone diameter (d), distance between the cone and the wall (Z), and the charge distance from the cone to the partitions (h1) (Sivukhin D.V. 2005, Stromberg A. G., et. al. 2009). The main parameters of the subject on dispersion width (D) were calculated and are given in Table-1. Based on mathematical calculations, the parameters of the working subject were selected as dispersion width (D). According to the conditions of the one-factor experiment, the distance between the cone and the wall (Z) and the charge distance from the cone to the partitions (h1) were taken with fixed numerical values by obtaining mathematical dependencies.
Table 1: Optimizing Cone Size Parameters
<table><tr><td>No</td><td>distribution angle, tg γ</td><td>h, height, sm</td><td>d, diameter, sm</td><td>cone-to-wall clearance distance (Z), sm</td><td>h1, distribution distance from the cone to the partitions, sm</td><td>D, spread width, sm</td></tr><tr><td>1.</td><td>20</td><td>3</td><td>2.18</td><td>1</td><td>25</td><td>20.38</td></tr><tr><td>2.</td><td>21</td><td>3</td><td>2.30</td><td>1</td><td>25</td><td>21.49</td></tr><tr><td>3.</td><td>22</td><td>3.5</td><td>2.83</td><td>1</td><td>25</td><td>23.03</td></tr><tr><td>4.</td><td>23</td><td>3.5</td><td>2.97</td><td>1</td><td>25</td><td>24.19</td></tr><tr><td>5.</td><td>24</td><td>4</td><td>3.56</td><td>1</td><td>25</td><td>25.82</td></tr><tr><td>6.</td><td>25</td><td>4</td><td>3.73</td><td>1</td><td>25</td><td>26.87</td></tr><tr><td>7.</td><td>26</td><td>4.5</td><td>4.39</td><td>1</td><td>25</td><td>28.77</td></tr><tr><td>8.</td><td>27</td><td>4.5</td><td>4.59</td><td>1</td><td>25</td><td>30.06</td></tr><tr><td>9.</td><td>28</td><td>5</td><td>5.32</td><td>1</td><td>25</td><td>31.90</td></tr><tr><td>10.</td><td>29</td><td>5</td><td>5.54</td><td>1</td><td>25</td><td>33.26</td></tr><tr><td>11.</td><td>30</td><td>5.5</td><td>6.35</td><td>1</td><td>25</td><td>35.20</td></tr><tr><td>12.</td><td>31</td><td>5.5</td><td>6.61</td><td>1</td><td>25</td><td>36.65</td></tr><tr><td>13.</td><td>32</td><td>6</td><td>7.49</td><td>1</td><td>25</td><td>38.74</td></tr><tr><td>14.</td><td>33</td><td>6</td><td>7.79</td><td>1</td><td>25</td><td>40.26</td></tr><tr><td>15.</td><td>34</td><td>6.5</td><td>8.77</td><td>1</td><td>25</td><td>42.49</td></tr><tr><td>16.</td><td>35</td><td>6.5</td><td>9.10</td><td>1</td><td>25</td><td>44.11</td></tr><tr><td>17.</td><td>36</td><td>7</td><td>10.17</td><td>1</td><td>25</td><td>46.50</td></tr><tr><td>18.</td><td>37</td><td>7</td><td>10.55</td><td>1</td><td>25</td><td>48.23</td></tr><tr><td>19.</td><td>38</td><td>7.5</td><td>11.72</td><td>1</td><td>25</td><td>50.78</td></tr><tr><td>20.</td><td>39</td><td>7.5</td><td>12.15</td><td>1</td><td>25</td><td>52.64</td></tr><tr><td>21.</td><td>40</td><td>8</td><td>13.44</td><td>1</td><td>25</td><td>55.38</td></tr></table>
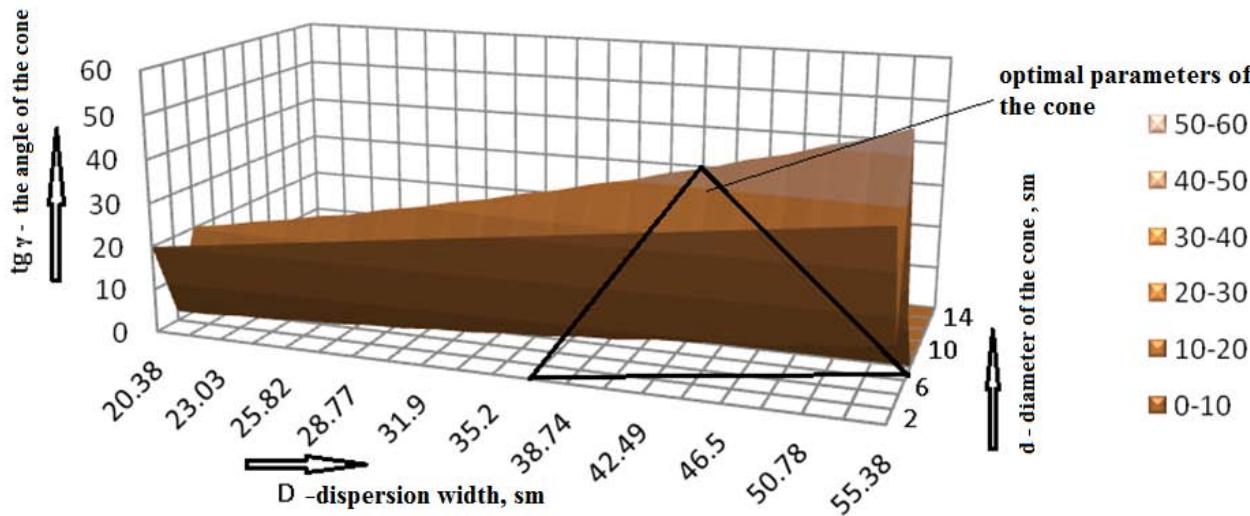 Fig. 10: Optimization Graph of Cone Parameters
Due to the fact that the working width of the cranberry in the plough trunk is $35~\mathrm{cm}$, the required spreading width $D = 35.2\mathrm{cm}$, the angle of the cone $\tan \gamma = 30$ degrees, cone height $h = 5.5\mathrm{cm}$, and cone diameter $d = 6.35\mathrm{cm}$ are taken from Table 4.8. The clearance distance between the cone and the wall $Z = 1$ cm and the charge distance from the cone $h_1 = 25\mathrm{cm}$ are taken as fixed values.
In order to verify the reliability of the control studies, to improve the proposed design of the machine and to justify its operating modes, field studies are determined, which ensures the spreading of fertilizers in the field.
Table 2: Technical Parameters of the Combined Plough
<table><tr><td>Indicator</td><td>Numerical indicator</td></tr><tr><td>Productivity, ha/hour</td><td>0.7...0.9</td></tr><tr><td>Working width, m</td><td>1,4</td></tr><tr><td>Number of working bodies, PCS</td><td>4</td></tr><tr><td>Weight, kg</td><td>700</td></tr><tr><td>Overall dimensions, mm</td><td></td></tr><tr><td>Length</td><td>3120</td></tr><tr><td>Width</td><td>1700</td></tr><tr><td>Height</td><td>1300</td></tr><tr><td>Working depth, cm</td><td>20...22</td></tr><tr><td>Working speed, km/h</td><td>3.9...6</td></tr><tr><td>One working width, mm</td><td>350</td></tr><tr><td>Number of bunkers, PCS</td><td>2</td></tr><tr><td>Bunker capacity, dm3</td><td>45</td></tr><tr><td>Norm of mineral fertilizer applied per 1 ha, kg</td><td>65...328</td></tr><tr><td>Type of attachment to the tractor</td><td>hanging</td></tr><tr><td>Aggregates with 30 kN class tractors</td><td>1</td></tr></table>
Table 3: Indicators of Even Distribution of Fertilizer in the Inclined Conditions of the Speader
<table><tr><td rowspan="2">Name of Indicators</td><td colspan="4">Inclinationangle</td></tr><tr><td>0°</td><td>5°</td><td>10°</td><td>15°</td></tr><tr><td colspan="5">Ureafertilizer</td></tr><tr><td>Equaldistribution,%</td><td>96.08</td><td>94.65</td><td>92.17</td><td>88.81</td></tr><tr><td>In the 1stperiod of the fertilizer shaft, gram</td><td>82.57</td><td>81.32</td><td>79.22</td><td>76.32</td></tr><tr><td colspan="5">Doublesuperphosphatefertilizer</td></tr><tr><td>Equaldistribution,%</td><td>97.63</td><td>96.85</td><td>94.34</td><td>92.82</td></tr><tr><td>In the 1stperiod of the fertilizer shaft, gram</td><td>129.26</td><td>128.23</td><td>124.91</td><td>122.89</td></tr><tr><td colspan="5">Potassiumchloridefertilizer</td></tr><tr><td>Equaldistribution,%</td><td>96.95</td><td>96.62</td><td>94.72</td><td>93.72</td></tr><tr><td>In the 1stperiod of the fertilizer shaft, gram</td><td>118.74</td><td>118.34</td><td>116.02</td><td>114.79</td></tr></table>
When the fertilizers were spread evenly in the laboratory, urea was $92.37\%$, double superphosphate was $94.96\%$, and potassium chloride was $95.42\%$.
Table 4: Equal Spreading of Fertilizers in the Sloping Conditions of the Slope
<table><tr><td rowspan="3">Indicators</td><td colspan="4">Slope</td></tr><tr><td>0°</td><td>5°</td><td>10°</td><td>15°</td></tr><tr><td colspan="4">AMAZONE ZA M -1500</td></tr><tr><td>Amount of fertilizer thrown from the left disc, kg</td><td>12.3</td><td>13.93</td><td>15</td><td>19.93</td></tr><tr><td>Amount of fertilizer thrown from the right disc, kg</td><td>12.3</td><td>11.86</td><td>10.33</td><td>9.33</td></tr><tr><td>Equal distribution,%</td><td>100</td><td>85.14</td><td>68.87</td><td>46.81</td></tr></table>
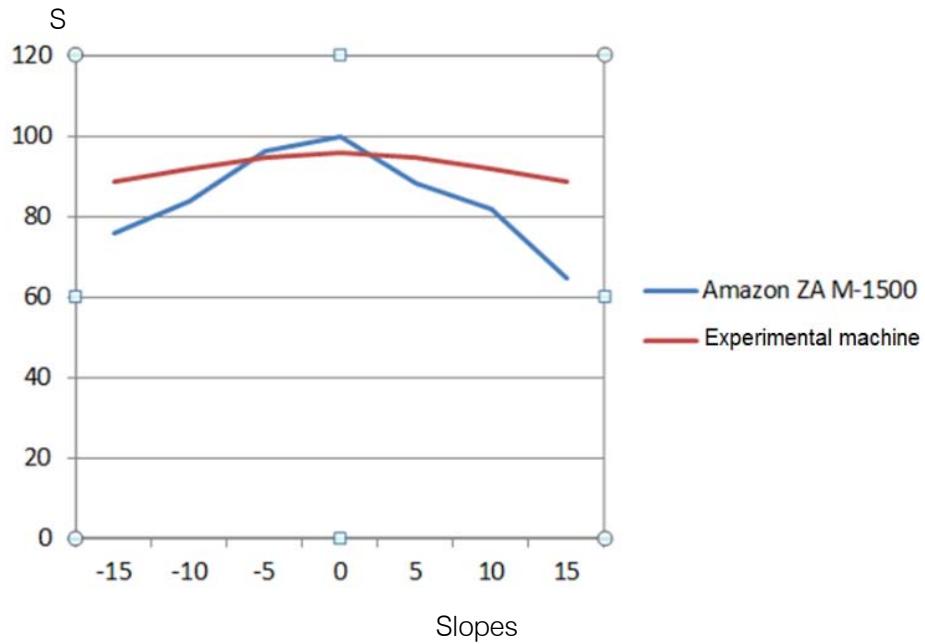 Fig. 11: Distribution Graph of Mineral Fertilizers in the Soil with the Amazone ZA M-1500 Machine and the Experimental Machine
The results of the research work, the table IV and the fig.11 clearly show that the Amazon ZA M-1500 machine distributes fertilizers unevenly in the field.
The regression equation is obtained for a smooth uniform scattering (Melnikov S.V., 1980).
For urea fertilizer
$Y = 93.9 - 0.75X_{1} - 1.59X_{2} + 0.1X_{1}X_{2}$
For double superphosphate fertilizer $Y = 95.04 - 0.57X_{1} - 1.84X_{2} - 0.18X_{1}X_{2}$
For potassium chloride fertilizer $Y = 95.50 - 0.33X_{1} - 1.28X_{2} - 0.17X_{1}X_{2}$
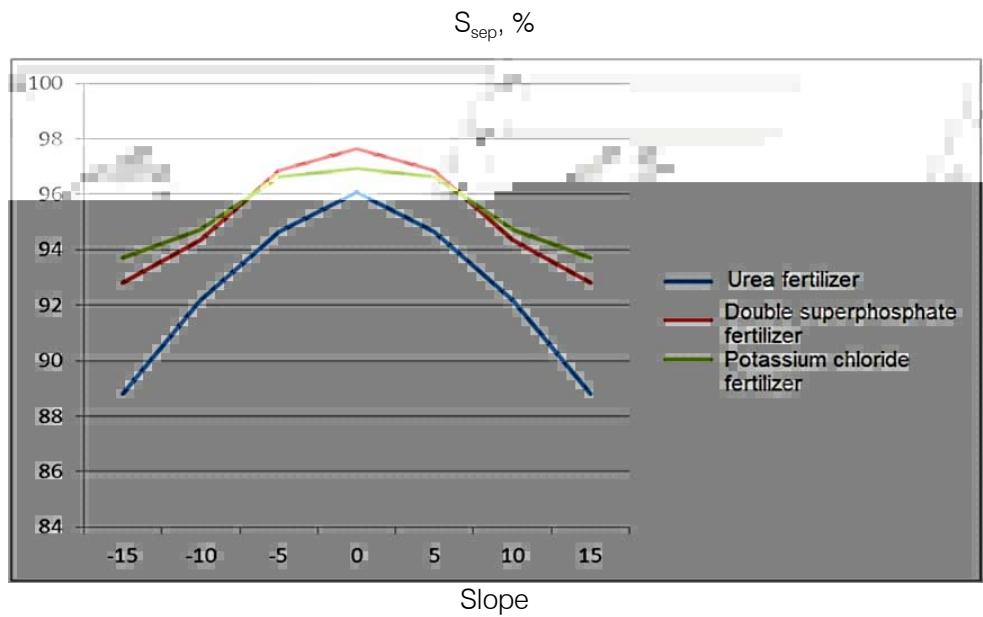 Fig. 12: Percentage of Even Distribution of Fertilizer on Slopes
Experiment planning plays a key role in the efficient and speeding up of research work.
The planning of the experiment is to experiment on the factors that seriously affect the function by reducing the number of factors without taking into account the low values of the factors that affect the function by identifying multifactor dependencies. For this purpose, the regression equation of the multi-factor function of scattering productivity is drawn up using the grapho-analytical method.
The general expression of the regression equation
$$
\begin{array}{l} \sum W _ {s a p} = 2 0. 3 8 \mathrm {v} + 4. 3 4 \mathrm {Q} + 4 7. 6 5 \frac {1}{B} + \dots + \dots ; \\\sum W _ {s \text {a} p} = 2 0. 3 8 \mathrm {v} + 4. 3 4 \mathrm {Q} + 4 7. 6 5 \frac {1}{\square} + 2 0. 3 8 * 4. 3 4 \mathrm {v Q} + 2 0. 3 8 \mathrm {v} ^ {2} + 4. 3 4 \mathrm {Q} ^ {2} \\\end{array}
$$
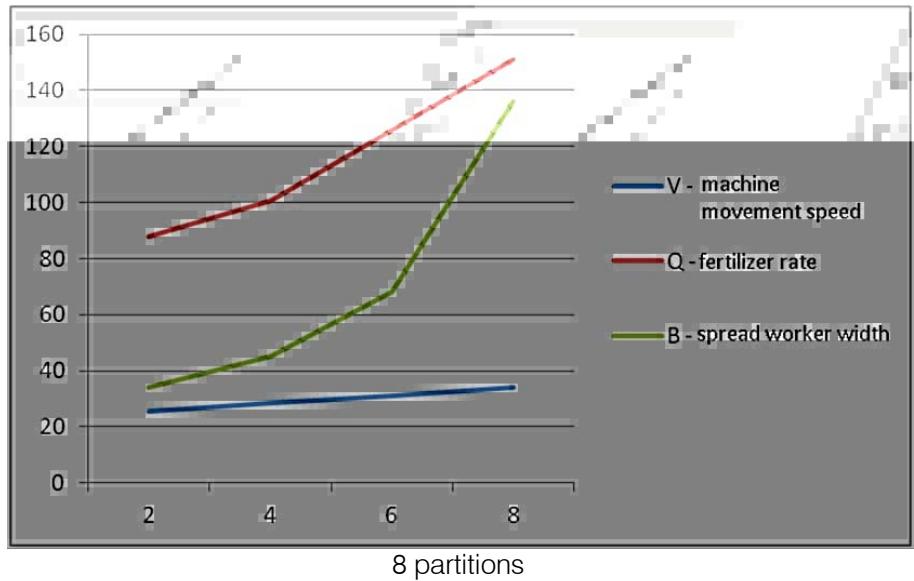 Fig. 13: The Main Factors that Affect the Productivity of Scattering
From the graph in Fig. 13, it is clear that Wsep - the 1st factor that most affects the sowing productivity Q - fertilizer rate, 2nd factor B- spread worker width,3- the less influential factor $V$ is the speed of movement of the machine.
Table 5: Economic Comparison Table
<table><tr><td rowspan="2">s/s</td><td rowspan="2">The name of indicators</td><td rowspan="2">Unit of measurement</td><td colspan="4">Mechanization options</td></tr><tr><td>SP -12 plough</td><td>Amazon zone ZA M -1500</td><td>Single time operations Total</td><td>Experimental Combined plough</td></tr><tr><td>1.</td><td>Productivity</td><td>ha/h</td><td>0.72</td><td>5.12</td><td>0.72</td><td>0.72</td></tr><tr><td>2.</td><td>Duration of technological operation</td><td>h</td><td>450</td><td>450</td><td>450</td><td>450</td></tr><tr><td>3.</td><td>Capital investment</td><td>dollars</td><td>8.17</td><td>20.05</td><td>28.22</td><td>14.88</td></tr><tr><td>4.</td><td>Depreciation expense</td><td>dollars</td><td>398.22</td><td>3.4</td><td>401.62</td><td>399.18</td></tr><tr><td>5.</td><td>Current repair and maintenance costs</td><td>dollars/ha</td><td>16.40</td><td>6.48</td><td>22.88</td><td>17.89</td></tr><tr><td>6.</td><td>Fuel and lubricant costs</td><td>dollars/ha</td><td>12.23</td><td>1.72</td><td>13.95</td><td>12.23</td></tr><tr><td>7.</td><td>Operating costs</td><td>dollars</td><td>1346.9</td><td>931.91</td><td>2278.80</td><td>1348.74</td></tr><tr><td>8.</td><td>Costs incurred</td><td>dollars</td><td>1348.94</td><td>936.92</td><td>2285.86</td><td>1352.45</td></tr><tr><td>9.</td><td>Economic efficiency</td><td>dollars</td><td>-</td><td>-</td><td>-</td><td>933.40</td></tr><tr><td rowspan="2">10.</td><td rowspan="2">Economic efficiency in grain growing</td><td>ha/dollars</td><td>-</td><td>-</td><td>-</td><td>123.53</td></tr><tr><td>kg/ha</td><td>-</td><td>-</td><td>-</td><td>600</td></tr><tr><td rowspan="2">11.</td><td rowspan="2">Economic efficiency during the growing season in grain growing</td><td>dollars</td><td>-</td><td>-</td><td>-</td><td>40023.53</td></tr><tr><td>t</td><td>-</td><td>-</td><td>-</td><td>194.4</td></tr><tr><td>12.</td><td>Overall economic benefit</td><td>dollars</td><td>-</td><td>-</td><td>-</td><td>40956.93</td></tr></table>
Table 5 shows a comparative analysis of technological operations (Merzlikin A. S., et. al. 1999). Thus, the smooth and even distribution of mineral fertilizers in the field with the use of combined plough increases the productivity in grain growing from a minimum of $26\mathrm{~s/ha}$ to $32\mathrm{~s/ha}$. If we calculate that a kilogram of wheat costs about 21 cents, $600\mathrm{~kg}$ per hectare allows us to get an economic benefit of 123.5 dollars/ha, and during the season - 3200 hectares of land with an economic benefit of 40 003 dollars.
## V. CONCLUSION
1. Plowing and fertilizing work on the slopes was performed in one go by using the combined plough. Fertilizing evenly under the soil prevents environmental pollution and increases the efficiency of fertilizer use.
2. As a result of economic testing of the combined plough, the working speed was 3.9... 6 km/h, the working width was 1.51 m, the cultivation depth was 20... 25 cm, the fertilizer application rate was 65... 328 kg/ha.
3. Uniform distribution of urea fertilizer under the soil was $92.0\%$, double superphosphate - $94.0\%$, potassium chloride - $93.0\%$.
4. Field and farm experiments have shown that with the reduction of uneven dispersion of mineral fertilizers with experimentally combined plough provides $20\%$ of minimum green mass productivity and grain growth of $600 \, \text{kg/ha}$.
5. As a result of the application of the combined plough, labor costs are reduced by $14.65\%$ and operating costs by $18.3\%$ compared to the usual method.
6. The annual economic benefit of one device is US \(933.4 due to the difference in costs incurred.
Generating HTML Viewer...
References
25 Cites in Article
İ Abbasov (2011). Food security and agricultural priorities.
F Alakbarov (2016). Fertilizers and their use.
A Abdullaev,G Rasulov,I Huseynov,O Ismayilov (2001). Innovative reducer for railroad switch drives and evaluation friction work on double sliding bearings.
B Bagirov,A Aliyev (2018). Mechanization of fertilization.
В Аdamchuk,V Moiseenko (2004). Technical means of the new generation for sowing of mineral fertilizers // Tractors and agricultural machines.
V Adamchuk (2003). Theoretical studies of the movement of particles of fertilizer on the growing body // Tractors and agricultural machinery.
R Afanasyev (2006). Formation of vortex dipoles.
H Qurbanov (2022). VII BEYNƏLXALQ ELMİ ARAŞDIRMALAR KONFRANSIN MATERİALLARI (11 fevral 2022).
H Qurbanov (2023). Preface: The International Conference on Information Technology and Mechatronics Engineering (ICITME 2023).
A Merzlikin,O Novikova (1995). Rational nitrogen fertilization in paddy rice- The Taiwan experience.
A Merzlikin,V Proshlyakov (1999). Problems of economics of chemicalization of agriculture.
M Klyatisl,B Maksimova (1979). VNIITEISH, Mechanization of preparation and application of solid mineral fertilizers: an overview.
D Mitchell (1975). Climate.
D Mitchell (1974). Unevenapplikation leads to clacre gran losses / D. Mitchell. // Power Farmg.
V Nasonov (1984). Substantiation of seeding processes and parameters of dosing working bodies of a wide-cut grain seeder with a centralized sowing system: thesis.
R Bongiovanni,J Lowenberg-Deboer (2000). Economics of Variable Rate Lime in Indiana.
A Ostanin,L Zlobina (1971). On the uniformity of the application of mineral fertilizers.
Aleshkinv Melnikovs,M Roschinp (1980). Planning an experiment in the study of agricultural processes.
M Pyataev (2010). Methodology and results of experimental studies of the distributor of a pneumatic zarnotukovy seeder.
I Sendryakov,B Glovatsky (1976). Fertilizers. Sampling.
I Serzhanov (2013). Optimization of the fertilizer system and technological methods of cultivation of spring wheat in the northern part of the foreststeppe of the middle Volga region: dis. s.
D Sivukhin (2005). General course of physics.
A Simakin (1988). Fertilizers, soil fertility and yield under conditions of intensive farming.
A Stromberg,D Semchenko (2009). Physical chemistry: textbook.
A Sedashkin,Kostrigina,N Daskini (2013). Materials of the international scientific conference dedicated to the 95th anniversary of the VGLTU named after G.F. Morozov and the 80th anniversary of Victory in the Great Patriotic War : «ENERGY-SAVING AND ENVIRONMENTALLY SAFE TECHNOLOGIES OF THE TIMBER INDUSTRY – 2025».
Explore published articles in an immersive Augmented Reality environment. Our platform converts research papers into interactive 3D books, allowing readers to view and interact with content using AR and VR compatible devices.
Your published article is automatically converted into a realistic 3D book. Flip through pages and read research papers in a more engaging and interactive format.
Our website is actively being updated, and changes may occur frequently. Please clear your browser cache if needed. For feedback or error reporting, please email [email protected]
Thank you for connecting with us. We will respond to you shortly.