## I. INTRODUCTION
Noise is an acoustic phenomenon producing an auditory sensation considered unpleasant or annoying [1]. It is a nuisance present in many economic sectors and professional activities. In most industrial sectors, noise is a determining factor in working conditions, employee health and company performance [2].
Exposure to high noise levels can affect the auditory system and other extra-auditory systems. The auditory effects of noise damage include post-traumatic deafness, auditory fatigue and occupational deafness [3].
As for extra-auditory damage, generally linked to chronic exposure, it is attributed to the stressful effect of noise and can also impair our attention span, degrade the quality of communication, and even impair quality of life [4].
According to the WHO in 2017 in World Hearing Report one in four people, will suffer from hearing loss to varying degrees by 2050[5].
In Canada in 2010 in Noise from Machinery in the Workplace, around 9,000 workers developed some form of hearing impairment, caused by overexposure to noise in the workplace [6].
In the United States, according to the ILO, 9 million workers are exposed to daily levels of 85 dB(A), and 5.2 million of these come from manufacturing industries [7].
The European Agency for Safety and Health at Work states that the cost of hearing loss accounted for around $10\%$ of the total cost of occupational diseases between 1999 and 2000 [8].
The Sumer 2010 survey in France on long-term exposure of more than 20 hours a week to high levels of 85 dB(A) concerns $4.8\%$ of employees. The sectors most concerned are industry $(16.8\%)$ and construction $(10.5\%)[9]$.
In Tunisia in 2011, Habib Nouaigui and Coll reported that around $25\%$ of the working population is exposed to high noise levels exceeding 85 dB.
In Côte d'lvoire, decree no. 01164 of November 04, 2008, sets national environmental standards for noise exposure levels in industrial zones at 75dB(A) during the day and 60dB(A) at night.
The risk assessment process identifies workstations at risk and the equipment that is the main source of noise. In the field of acoustics, risk assessment can start with a sound level estimate, followed by noise measurement, as per ISO 9612.
It was in this context that we initiated this study, the general aim of which was to assess the impact of exposure to noise.
## II. METHODOLOGY
Study setting: our study setting was the Lafarge Holcim Guinea plant.
The plant covers an area of 5.04 km2 and consists of an administrative building, a refectory, 02 crushers and several material installations.
Our study focused on the employees of the LafargeHolcim plant.
We used the following to collect data:
A pre-established survey sheet including:
Socio-professional data; Workers' medical data; Sound level meter
## III. METHODS
Type and duration of study: this was a prospective descriptive study lasting 06 months, from 01 March 2022 to 01 September 2022.
Target population: Our study covered LafargeHolcim employees and their workstations.
Selection criteria
Inclusion criteria: all workers hired by the Lafarge Holcim plant
The following work areas: Storage hall; Bagging area, BULK loading area, Maintenance workshop;
Power station, Mixer operator, Laboratory, Weighing operator, Shipping area, Unloading area.
Non-inclusion criteria: Hygiene and administration workers were included.
Our variables were qualitative and quantitative, consisting of socio-professional data such as Age - Sex - Plant employee - Job position Seniority at job position - Marital status - Level of education.
Ethics and Deontology: the anonymity of plant employees was respected, and their informed consent was requested. Confidentiality was respected; the data collected was used exclusively for scientific purposes.
## IV. RESULTS
Total number of permanent plant workers: 150
Plant workers meeting inclusion criteria: 131 or $87.3\%$.
Plant workers not meeting inclusion criteria: 19 or $12.7\%$.
Figure 1: Distribution of workers according to selection criteria Table 1: Distribution of workers according to work area measurements
<table><tr><td>Zone de travail</td><td colspan="2">Lex,08h dB</td><td>Number (n=104)</td><td colspan="2">Threshold</td><td>Percentage</td></tr><tr><td>Storage hall Milling</td><td colspan="2">96,6</td><td>15</td><td colspan="2">Danger</td><td>14,4</td></tr><tr><td>Laboratory</td><td colspan="2">65,5</td><td>6</td><td colspan="2">Low risk</td><td>5,8</td></tr><tr><td>Maintenance workshop</td><td colspan="2">66,6</td><td>53</td><td colspan="2">Low risk</td><td>50,7</td></tr><tr><td>Mixer operator</td><td colspan="2">82,3</td><td>3</td><td colspan="2">Warning</td><td>2,9</td></tr><tr><td>Bagging area</td><td colspan="2">86,7</td><td>5</td><td colspan="2">Danger</td><td>4,8</td></tr><tr><td>Power station Generator</td><td colspan="2">75</td><td>4</td><td colspan="2">Low risk</td><td>3,8</td></tr><tr><td>BULK loading</td><td colspan="2">88,7</td><td>6</td><td colspan="2">DANGER</td><td>6,1</td></tr><tr><td>Weighbridge operator</td><td colspan="2">55,2</td><td>3</td><td colspan="2">Low risk</td><td>2,9</td></tr><tr><td>Shipping</td><td colspan="2">76,1</td><td>7</td><td colspan="2">Low risk</td><td>6,7</td></tr><tr><td>Unloading</td><td colspan="2">55,4</td><td>2</td><td colspan="2">Low risk</td><td>1,9</td></tr><tr><td colspan="2">Average:: 71,3 dB(A)</td><td colspan="3">Standard deviation: 25 dB(A)</td><td colspan="2">Extrêmes: 55,2 qnd 96,6 dB(A)</td></tr></table>
Table II: Distribution of workers according to PPE use
<table><tr><td>PPE use</td><td>number (n)</td><td>Percentage (%)</td></tr><tr><td>Regularly</td><td>64</td><td>48,9</td></tr><tr><td>Sometimes</td><td>42</td><td>32,1</td></tr><tr><td>Not at all</td><td>25</td><td>19</td></tr><tr><td>Total</td><td>131</td><td>100</td></tr></table>
Table III: Distribution of workers by type of PPE used
<table><tr><td>Type of PPE used</td><td>Number (n)</td><td>Percentage (%)</td></tr><tr><td>Caps</td><td>87</td><td>66,4</td></tr><tr><td>Helmets</td><td>5</td><td>3,8</td></tr><tr><td>Not at all</td><td>39</td><td>29,8</td></tr><tr><td>Total</td><td>131</td><td>100</td></tr></table>
Table IV: Distribution of workers according to signs experienced
<table><tr><td>Signs experienced</td><td>Number (n)</td><td>Percentage (%)</td></tr><tr><td>Whistling/ringing</td><td>11</td><td>55</td></tr><tr><td>Headache</td><td>4</td><td>20</td></tr><tr><td>Sleep disturbance</td><td>3</td><td>15</td></tr><tr><td>Dizziness</td><td>2</td><td>10</td></tr><tr><td>Total</td><td>20</td><td>100</td></tr></table>
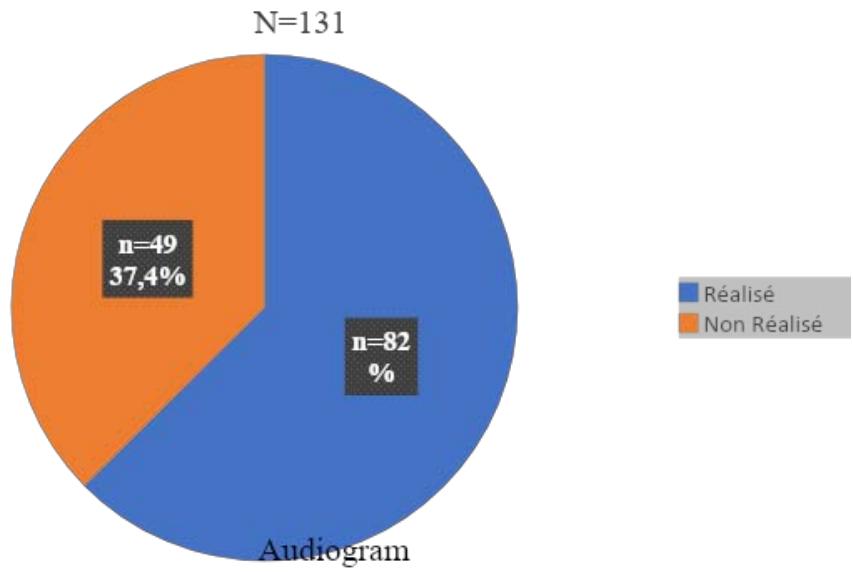 Figure 2: Breakdown of workers by audiogram
## V. DISCUSSION
In our series, the average professional seniority was 12.06 years.
The highest proportion was over 10 years, at $51.1\%$.
Jb.Pelletan et al [10] in France in 2018 in their work on the evolution of noise exposure in employees followed by audiometry between 1968 and 2000 reported that the average professional seniority was 14.4 years.
Tamene A. et al [11] in Ethiopia in 2020 in their study of musculoskeletal disorders and associated factors among vehicle repairers in Hassa City showed that $52.6\%$ of body-painters had an occupational seniority of 5 to 15 years.
The good qualification of the employees, the type of contract and the social insurance and pecuniary benefits linked to the contract would justify these results. Work zone measurements ranged from 55.2 to 96.6 dB, with a mean of 71.3 dB and a standard deviation of 25 dB. 3 zones out of 10 had sound levels exceeding 85 dB, 1 zone had a sound level between 80-84 dB and 6 zones out of 10 had a sound level below 80 dB.
Tchicaya A.F. et Coll in Côte d'lvoire in 2011[12] reported sound levels ranging from 80.3 to 101.3dB. Noise emitted by the roasting workshop, grinder and platform reached 101.3 Lex.08h (dB) in 2008 and 99.7 Lex.08h (dB) in 2010 respectively.
Dia S.A. et al [13] noise levels exceeded 85 dB(A) in all areas except the laboratory, the storage area, the micro-packaging room, the flour store and the production manager's offices.
In some work areas, noise levels exceeded the set standards, exposing plant workers to various noise-related risks: auditory (hearing fatigue, reduced hearing acuity, deafness), extra-auditory stress-related (hypertension, sleep disturbance, impaired concentration and quality of life).
In terms of frequency of use, $48.9\%$ of workers wore anti-noise Epi regularly, and the most frequently used type of PPE was earplugs.
Dia S.A. et al [13] in Dakar in 2014 in Evaluation des risques professionnels chez les travailleurs dans une meunerie showed that $45.45\%$ of workers regularly used anti-noise PPE.
Hinson A.V. et al [14] in Benin in 2017 Evaluation of noise nuisance among workers in a steel production company reported that $21\%$ of workers regularly wore hearing protection equipment.
Amadou Oury [15] in Guinea in 2020 in Evaluation des nuisances sonores chez les travailleurs de la SOGEAC found that $74.56\%$ of workers used earplugs followed by $25.44\%$ using helmets.
This result shows that, despite the CHS's efforts to raise awareness of the need to wear anti-noise PPE, many employees are not using them. This would be detrimental to their hearing health.
In addition, workers' preference for earplugs may be linked to the fact that they are lighter and more compatible with other PPE, and thus meet noise attenuation requirements.
The most common clinical manifestations were whistling/ringing (55%), followed by headaches (20%) and sleep disturbance (15%).
Nicolas Derumaux et al [13] in their 2013 study of airport noise in France reported $37\%$ tinnitus, $18\%$ hearing loss and $7\%$ vertigo at the end of a working day.
According to the literature, prolonged exposure to noise leads to clinical manifestations of repeated acoustic trauma, otosclerosis and vestibulocochlear nerve damage.
The audiograms carried out showed that $25.6\%$ of workers had an abnormal audiogram, i.e. one worker in 4 had an abnormal audiogram.
Hinson A.V. et al [14] showed that $26\%$ of workers' audiograms were abnormal.
Arip Amel Ep et al [15] in Algeria in 2011 in their study Evaluation of average hearing loss among workers in an Electrical Household Appliances industry found that $20.2\%$ of workers had hearing loss.
Exposure to noise in different departments at sound levels exceeding 85dB (A) such as (Grinding area, Bagging machine, Bulk loading) are harmful to the auditory system and can lead to hearing deficits ranging from hypoacusis to deafness. In our context, this exposure combined with failure to wear PPE could explain the proportion of workers with abnormal audiograms.
Workers with bilateral hearing impairment were the most represented (42.9%), followed by unilateral hearing impairment (OG: 33.3% and OD: 23.8%).
Sensorineural hearing loss accounted for $61.9\%$ of abnormal audiograms, followed by conductive hearing loss at $28.6\%$, and mixed hearing loss was the least represented at $9.5\%$.
The study carried out by the Observatoire Régional de la Santé de Midi Pyrénées in Enquête Audience in 2010 among young people aged 16-25[51] reported that hearing losses greater than 20 dB were located in the left ear (OG) with a frequency of $36.1\%$, followed by $34\%$ in the right ear (OD) and $29.9\%$ were bilateral.
Bachy A. et al [16] in France in 2014 showed in their study Evaluation of a rapid audiometric screening test (DARDA) reported that 15 out of 35 patients had sensorineural hearing loss $(42.85\%)$.
The occurrence of these different types of deafness can confirm the negative effect on the ENT sphere. These include presbycus, damage to Corti's apparatus (barotrauma) and auditory nerve disorders (acoustic neuroma).
In terms of hearing loss, $66.7\%$ of audiograms revealed mild hearing loss, $23.8\%$ moderate and $9.5\%$ severe.
Chakroun A. et al[17] Tunisia in 2013 showed in their work "Evaluation of occupational deafness in a department of southern Tunisia" that $38.5\%$ of workers had mild deafness and $48\%$ had moderate deafness.
High noise exposure, ototoxic drugs (Gentamicin, Streptomycin, Cis platinum and Quinine) and certain pathologies such as Meniere's disease could explain these results.
## VI. CONCLUSION
Exposure to noise represents a real risk in the workplace. Workers at the LafargeHolcim plant are
- highly exposed to it; hearing loss was mainly sensorineural, with a frequency of $61.9\%$.
- 48.9% of workers regularly used noise protection equipment; 66.4% of PPE used was earplugs.
- In addition to the effects on the auditory system, noise has an impact on extra-auditory systems, such as impaired communication and attention.
- However, noise mitigation measures must be implemented and reinforced to limit the risk and avoid these effects.
Generating HTML Viewer...
References
11 Cites in Article
Véronique Jaworski (2012). Le bruit et le droit.
Anne-Marie Ondet,Jean-Michel Mondot Acoustique et technique n°12.
L Thierry,P In Collaboration With,M Asselineau,N Berne,D Brassenx,B Corlay,J.-M Dautin (2009). Evaluer et mesurer l'exposition professionnelle" Acoustique des lieux de travail.
S Fantoni Quinton (2011). Quelles opportunités pour la cellule prévention de la désinsertion professionnelle au sein des services de prévention et de santé au travail ?.
S Canada (2010). Le Vioxx : lecons pour Sante Canada et la FDA.
M Vallée (2013). Le stress professionnel: ampleur et déterminants organisationnels.
Geneviève Barré (2010). Le développement de TCL dans le domaine de la télévision.
(2004). SIddy D le guide de la performance globale.
(2022). Sound power and sound pressure | Brüel and Kjaer.
No ethics committee approval was required for this article type.
Data Availability
Not applicable for this article.
How to Cite This Article
Soguiprosst Toure Habib. 2026. \u201cRisk Assessment of Noise Pollution in a Cement Plant: Perspectives and Recommendations\u201d. Global Journal of Medical Research - B: Pharma, Drug Discovery, Toxicology & Medicine GJMR-B Volume 23 (GJMR Volume 23 Issue B3).
Explore published articles in an immersive Augmented Reality environment. Our platform converts research papers into interactive 3D books, allowing readers to view and interact with content using AR and VR compatible devices.
Your published article is automatically converted into a realistic 3D book. Flip through pages and read research papers in a more engaging and interactive format.
Our website is actively being updated, and changes may occur frequently. Please clear your browser cache if needed. For feedback or error reporting, please email [email protected]
Thank you for connecting with us. We will respond to you shortly.