During the first two years of a child’s life, nutritional status is crucial for his or her well-being and growth. This study explains the risk factors of chronic malnutrition during the first two years of life in south west Benin. The methodological approach uses the construction of Food Consumption Score (FCS), Reduced Coping Strategies Index (rCSI), Household Dietary Diversity Score (HDDS), and Livelihood Coping Strategies (LCS). The Chi2 test helps to examine the dependency between the variables. The simple binary logit model is used to explore the effects of the explanatory variables on the dependent variable. The results show that about 27% of children aged 6-23 months are chronically malnourished. The age range of the child, the type of union, the average monthly income of the head of the household, the food consumption score, and the size of the family determine the chronic malnutrition. During difficult times, households rely on atypical coping strategy mechanisms by disposing of their productive assets. 20.3% of households can marginally cover their minimum food needs using crisis or emergency coping strategy mechanisms.
## I. INTRODUCTION
The problem of malnutrition derives from the effects of the choices made by a family unit to meet its food needs. Far from being the result of the application of a norm, food is the result of the assimilation by individuals of the modes of accommodation decreed by the culture to which they belong. For WHO (2000), malnutrition is characterized by inadequate or excessive intake of protein, energy, and micronutrients such as vitamins and minerals, as well as by the frequent infections, and health disorders that result. Latham (2001) restricted the term malnutrition to undernourishment or inadequate intake of energy, protein, and micronutrients required to meet the basic needs of the body for maintenance, growth, and development. There are several forms of malnutrition: global acute malnutrition, severe acute malnutrition, and chronic malnutrition (Park and al., 2012). According to these authors, the forms of malnutrition have different causes. Acute malnutrition results from acute food deprivation and is defined by a decrease of two standard deviations below the weight-for-height index. Severe acute malnutrition results from the onset of diarrhea, respiratory infection, and malaria. It's defined as a decrease of two standard deviations below the weight-for-height index. In contrast, chronic malnutrition, also known as stunting, is a decrease of two standard deviations from the height-for-age index. Several authors have mapped out the different forms of malnutrition, showing the need to address this issue.
The United Nations Children's Fund, the World Health Organisation, and the World Bank estimated in 2015 that about 159 million children under five were affected by chronic malnutrition worldwide, or $23.8\%$ (UNICEF, WHO, World Bank, 2015) (Amadou et al., 2020). Its importance varies by region. Research results from Ekholuenetale and al. (2020) show that sub-Saharan African countries present disparities on several malnutrition indicators, including stunting, underweight, overweight, anemia, and child survival. West and Central Africa are the most affected by child malnutrition (Amadou and al., 2020; Pomati et al., 2020), with a rate of $35\%$ (Amadou and al., 2020).
Among the consequences of malnutrition, it exposes children to greater susceptibility to infections and an increased mortality risk. Park and al. (2012) found that acute malnutrition accounts for over $50\%$ of infant mortality in children under five. Similarly, Black and al. (2013) estimate that $45\%$ of child deaths per year can be directly attributed to malnutrition or have an underlying cause of malnutrition. Such a high rate of malnutrition in Central and West African countries ( $35\%$, according to Amadou and al., 2020) is leading governments and international organizations to look more closely at the risk factors for malnutrition in these areas. As a result, the specific case of Benin is being considered. The apprehension of malnutrition on a global scale resorts most of the time to regional descriptive analyses. Very few studies have focused on the specific risk factors in each country to identify the most effective approaches to solve this issue. Moreover, few econometric studies have focused on the risk factors of chronic malnutrition in West or Central Africa. To fill this gap, this study would like to determine the risk factors of chronic malnutrition in children aged 6-23 months in south west Benin.
The scientific literature on chronic malnutrition in children is quite diverse. Both, biomedical and social sciences focused on this topic. Looking at the determinants of malnutrition in children, Deutz and al. (2019); Fleurke and al. (2020) linked it to the child's and household's environment, the head of household and spouse characteristics and daily diet of the child. For Groleau and al. (2014), nutritional indices (weight, height, body mass index) determine the presence or absence of malnutrition in a child. In children, chronic malnutrition is related to deficiencies in the household diet. These deficiencies are due to the limited availability and accessibility of food associated with constraints on access to land and agricultural inputs, limited family production due to poor quality land, and its remoteness from villages (Dubot, 2005). Despite food availability, if food prices are too high, poor households cannot access it because of their low purchasing power (Dubot, 2005).
The availability of health and socio-economic infrastructure, the availability and diversity of food products on the market, and the diversity of livelihoods, and food consumption are more visible in cities where few children are at risk of malnutrition. In rural areas, where precarious lifestyles and activities predominate, children are more frequently emaciated than those living in urban areas. Global food and nutrition security analyses (2009, 2013, 2018, 2022) show that in Benin, rural areas are more affected by chronic malnutrition than urban areas. Other studies have associated the father's occupation with chronic malnutrition in children under five. This is the case with the work done by Islam and al. (2013). Also, Srivastava (2014) showed that children with a farmer's father are at higher risk of stunting. There is also a differential in child growth depending on the gender of the household head. Indeed, when the woman is the head of the household, children are less likely to be stunted than when the man is the head. When women have more decision-making power, especially over children's health and diet, this can beneficiat to their children (WFP, 2018).
Some analyses have focused on the relationship between chronic malnutrition and household size. According to these authors, chronic malnutrition arises from the difficulties of households in securing their food intake. Although levels of chronic malnutrition are lower in smaller families, several other studies did not get different findings (Wong and al., 2014). Also, it should be noted that the presence of more than two children under five in a household is negatively correlated with the child's nutritional status (Bosch, 2007). The nutritional status of children is affected in a household hosting more children under five to feed with a reduced income.
For Srivastava (2014), children from households with low diversity and food consumption scores are at much higher risk of chronic malnutrition. The parent's education level is also a driving factor in chronic malnutrition, according to other actors. Educated parents are more likely to provide their children with better health and nutritional conditions for their growth and development.
One line of thought has shown that culture plays a significant role in food costumes. It determines the eating habits and preferences as well as food is stored in a community. Socio-cultural factors may contribute to nutritional deficiencies and impacting nutrition status (Latham, 2001). Beliefs, values, and dogmas linked to religious practices influence perceptions and partly determine the habits and behavior of the faithful. This influence is due to the prohibition by religions of consuming certain foods. For example, Muslims and adepts of Celestial Christianity do not eat pork and Hindus do not eat beef, which is revered, even though these foods are very rich in proteins and iron, which are essential for the body.
The nutritional status of the mother can determine that of her child. The body mass index, which provides information on the nutritional status of the mother/child, is associated with chronic malnutrition in children under five. Thus, children whose mothers suffer from chronic energy deficiency are more likely to be affected by chronic malnutrition (Masibo and al., 2012). The negative influence of women's activity on nutrition is raised by some authors. Working women are often challenged by the constraints of equitable management of working time and time to take care of children. According to Akoto and Hill (1988), the mother's activity may force her to reduce the duration of breastfeeding and practice early weaning, while favoring the occurrence of chronic malnutrition in the child (Akoto and Hill, 1988). However, the economic activity of the mother can positively influence the nutritional status of children. By improving the household's standard of living and the availability of household resources, women's employment can improve the quality of care for the child, particularly in terms of nutrition and health.
It should also be noted that the vulnerability of girls and boys to disease and death is different. Indeed, studies have shown that male children are much more likely to suffer from chronic malnutrition (Masibo and al., 2012). In contrast, Thurstans and al. (2020) showed that girls are at greater risk of undernutrition. In a study of children in the Philippines in 1988, Horton pointed out that age, sex, and birth order of children had significant impacts on their nutritional status. Handa (2020), using linear regression in which the dependent variable is the height-for-age z-score, showed that women's educational attainment has a positive impact on the health of children in Jamaica. The present study intends to fill the knowledge gaps suggested by this literature review with a methodological approach consistent with the subject matter.
## II. DATA AND METHODS
This study is based on data collected in December 2020 in south west Benin in 40 villages in the commune of Bopa. The sample covered is 558 households selected from a two-stage random sample. The heads of households provided socio-economic data. Anthropometric measurements were taken on 189 children aged 6-23 months. Food consumption and livelihood indicators were calculated (see Annex) using their standard methodology. Stunting was analyzed using the WHO Z-Score methodology (2005). Chi-square tests were performed to analyze the dependence or influence of explanatory factors on malnutrition. A simple binary Logit regression model is used to measure the effects of the explanatory variables on the explained variable. The presence or absence of malnutrition in a child is the dependent variable. Average monthly income, marital status, age, mother's education, household size, child's birth rank, dietary diversity score, food consumption score, reduced coping index, and livelihood strategies are the explanatory variables. In the simple binary logit model, the dependent variable noted $Y$ takes two possible forms: 0 if the child is stunted and 1 otherwise.
$P(Y = 1)$ respectively $P(Y = 0)$ is the a priori probability that $Y = 1$ (respectively $Y = 0$ ). Let's say: $P(Y = 1) = F(X\beta)$ et $P(Y = 0) = 1 - F(X\beta)$ where $F$ is a distribution function $R$ on the interval $[0,1[$, increasing in its argument and $\mathbb{Z}$ a vector of parameters (to be estimated) associated with the vector $X$ and of dimension $(L,1)$ if the vector $X$ is of dimension $(1,L)$.
The logit model is the one defined by:
$$
P (Y = 1) = \frac{e x p (X i \beta)}{1 + e x p (X i \beta)} \text{and} P (Y = 0) = \frac{1}{1 + e x p (X i \beta)} \tag{1}
$$
The Logit model is defined by the following equation:
$$
\begin{array}{l} (Y) = \alpha_ {0} + \alpha_ {1} * t a i l l e + \alpha_ {2} * A g e E n f a n t + \alpha_ {3} * s t a t u m a t r i m o + \alpha_ {4} * S D A M + \alpha_ {5} * N E M 5 + \alpha_ {6} \\* \text{Instrucmere} + \alpha_ {7} * \text{Statiegie} + \alpha_ {8} * \text{rang} + \alpha_ {0 9} * R c s i + \alpha_ {1 0} * \text{Revenumenage} + \mu_ {i} \\\end{array}
$$
Where $\alpha_0$ is the constant term; $\alpha_{i}$, the regression coefficients, $\mu_{i}$, the error term and:
$Y_{i}$ is the dependent variable (Malnutrition_status); Size: Size of the household; AgeChild: Age category of the child; Statumatimo: Type of union; SDAM: Household dietary diversity score; Instructmere: Mother's level of education; Rank: Child's birth rank; Rcsi: Reduced coping strategies index; Household income: Average monthly income of the household; NEM5: Number of children under 5 years old in the household.
## III. RESULTS
According to the findings, $21.16\%$ of households can cover between $50\%$ to $75\%$ of their needs, while the majority of households $(70.9\%)$ cover less than $50\%$ of their needs. The household diet reveals poor $(26.98\%)$, borderline $(32.28\%)$ and acceptable $(40.74\%)$ food consumption scores. Less than 6 out of 12 recommended daily food groups are consumed by $51.1\%$ of households. Milk, dairy products, meat, eggs, and fruits, which are rich in micronutrients, are the least consumed. On the other hand, cereals (wheat, maize, rice, sorghum, millet), vegetables, oils, and fats are the most consumed foods. When households have a challenging time accessing food, they use reduced coping strategies. The reduced coping strategies index calculated is less than or equal to 4 for $58.73\%$ of households and between 4 to 18 for $41.27\%$ of households. Concerning livelihood strategies, $31.22\%$ of households adopt stress strategies, and $21.69\%$ adopt crisis and emergency strategies. The results show that about $27\%$ of children aged 6-23 months are stunted.
### a) Bivariate Analysis
The findings show that the age category of the child has a significant influence (Appendix table) on their nutritional status. Children aged 6 to 12 months are relatively less affected by chronic malnutrition than children aged 12 to 23. Indeed, $17.9\%$ of the children aged 6 to 12 months in the sample are stunted, whereas the rate is $32\%$ for children aged 12 to 23. Furthermore, household's significantly influences the nutritional status of the child. In addition, the nutritional status of the child depends greatly (Pearson Chi2 = 4.87 Prob = 0.0273) on whether or not there is another child under the age of 5 in the household. It should be noted that the Chi2 test confirms a statistically significant relationship between household income level and the presence or absence of malnutrition in the child. A logistic regression model is used to assess the powerful effects of the explanatory variables on the explained variables.
### b) Multivariate Analysis
The results of the estimated correlation are presented in table No1 below.
Table 1: Logistic Regression Results
<table><tr><td>Malnut status</td><td>Coef.</td><td>St.Err.</td><td>t-value</td><td>p-value</td><td>Sig</td></tr><tr><td>size</td><td>0.535</td><td>0.248</td><td>-1.35</td><td>0.178</td><td></td></tr><tr><td>AgeChild</td><td>0.399</td><td>0.163</td><td>-2.25</td><td>0.024</td><td>**</td></tr><tr><td>Statumatimo</td><td>2.827</td><td>1.227</td><td>2.39</td><td>0.017</td><td>**</td></tr><tr><td>NME5</td><td>0.745</td><td>0.386</td><td>-0.57</td><td>0.57</td><td></td></tr><tr><td>Revenuménage</td><td>0.742</td><td>0.132</td><td>-1.67</td><td>0.094</td><td>*</td></tr><tr><td>instrumere</td><td>1.289</td><td>0.355</td><td>0.92</td><td>0.357</td><td></td></tr><tr><td>rank</td><td>1.099</td><td>0.131</td><td>0.79</td><td>0.43</td><td></td></tr><tr><td>SCA</td><td>1.644</td><td>0.395</td><td>2.07</td><td>0.039</td><td>**</td></tr><tr><td>Rcsi</td><td>1.407</td><td>0.551</td><td>0.87</td><td>0.384</td><td></td></tr><tr><td>Strategy</td><td>.965</td><td>.2</td><td>-0.17</td><td>0.862</td><td></td></tr><tr><td>SDAM</td><td>1.145</td><td>0.478</td><td>0.32</td><td>0.746</td><td></td></tr><tr><td>Constant</td><td>3.959</td><td>4.953</td><td>1.10</td><td>0.271</td><td></td></tr><tr><td></td><td colspan="5">*** p<.01, ** p<.05, * p<.1</td></tr></table>
Source: AARG (2020) NutAumed data set
The econometric results show that the child's age, the marital status of the head of household, the income of the head of household and the household food consumption score significantly determine the presence or absence of chronic malnutrition in children aged 6 to 23 months. Children from 6 to 12 months are 0.399 times less likely to be chronically malnourished than those between 12 to 23. Similarly, children living in a family where the head of the household is a widow or widower are 2.827 times more likely to be chronically malnourished. On the other hand, high-income households are less likely to have chronically undernourished children in their households. In addition, children in families with low dietary diversity scores are 1.644 times more likely to be chronically malnourished than those with high dietary diversity scores. To assess the quality of the predictive power of the model, the GINI curve measures the specification of the model.
The analysis of the graph shows that the LROC curve is above the first bisector, which shows that the predictive power of the model is high. Thus, the model is overall good. The results showed that the explanatory power of the model used to identify the main risk factors for malnutrition is $72.78\%$.
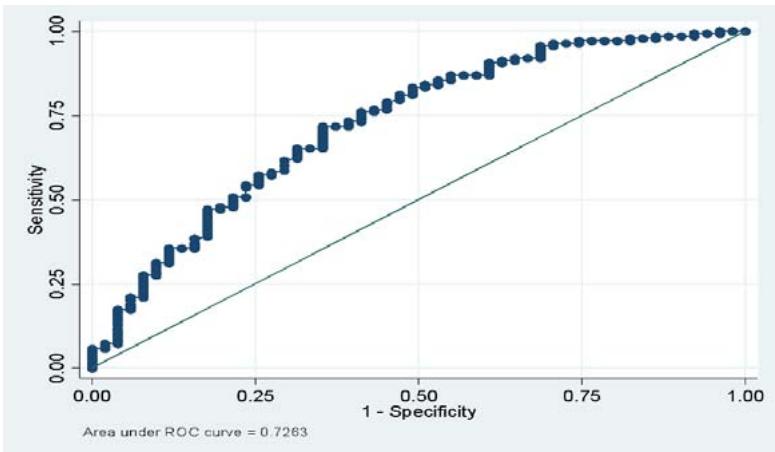 Source: AARG (2020), Representation of the authors Figure 1: Model Predictive Quality Evaluation Curve
## IV. DISCUSSION
The analyses show that about $27\%$ of children are chronically malnourished in Bopa. The rate of chronic malnutrition in south west Benin is above the global level $(23.8\%)$ and below the average for West and Central Africa $(35\%)$ (Amadou et al., 2020), which reflects the fact that malnutrition is still high among children in some African countries including Benin.
Empirical works by Borel (2007); Mukalay and al. (2010); Guy and al. (2020) revealed that the age category of the child determines the presence of chronic malnutrition in children. The same is true of the work of Padonou (2014), Diop and al. (2020), Ategbo and al. (2013), Kouakou and al. (2017), Kaid and al. (2022). Borel (2007) justifies the link between a child's age category and nutritional status. The more child's age evolves, the more his body needs more nutrients. Therefore, if the nutritional intake is not alined with his or her body's needs, he or she runs the risk of suffering from chronic malnutrition. For Kaid and al. (2022), the older the child is, the less likely he or she is to have poor nutritional status, until the second or third year, when the trend is reversed. For these authors, during the first two years, infants tend to have problems of undernutrition that dissipate as they grow older (Kaid and al., 2022). But from the third year onwards, this trend is reversed, and the risk of malnutrition increases. They explain this result by the fact that with age, the diete needs of children change and increase. However, for Kouakou and al. (2017), Traore and al. (2008), children's risk of malnutrition first increases at 12-23 months, and decreases after this period.
The head of the household characteristics notably, marital status and type of union are significantly associated with the nutritional status of the children. The statistics show that out of 42 children aged between 6 to 23 months surveyed in polygamous families, 19 (meaning $45.23\%$ ) were chronically malnourished compared to $23.02\%$ of children from monogamous households. This result is similar to the work of Savadogo (2022). He explained its findings by the probability of minimal meal frequency is 2.3 times higher among children of polygamous mothers. In other words, monogamous mothers are 2.3 times more likely to practice adequate minimum dietary diversity than polygamous mothers.
Household size is one of the explanatory factors for child malnutrition. For Kaid and al. (2022), belonging to a large family increases the probability of stunting in children. For the authors, the distribution of household resources over many people reduces expenditure on food and health care for children. This can harm their health and is especially apparent over time. Thus, children living in large families have an unfavorable standard of living and hence a higher probability of having a poor nutritional status over a long period. Guy and al. (2020), Wong and al. (2014), and Savadogo (2022) also found that malnutrition is related to household size. Guy and al. (2020) justify this link as a consequence of food insecurity induced by high household size. For these authors, the risk of food insecurity is greater for households with large sizes. This exposes children to undernourishment and results in malnutrition in these very vulnerable individuals. For Savadogo (2022), high household size is a significant factor in minimal dietary diversity among children.
The level of household income is also a determining factor of child malnutrition. Kaid and al. (2022) found that children whose household heads are economically active or retired are less likely to be stunted. This is because low-income households cannot guarantee a healthy, balanced diet and a standard of living conducive to children's health. Guy and al. (2020) justify the association between malnutrition and household income in terms of food availability and the health environment. As income increases, so does the ability to afford the foods needed for a diet (Mutisya and al. 2015).
An association is established between Food Consumption Score and Malnutrition. A low Food Consumption Score results from inadequate feeding and poor dietary diversification (Guy and al. (2020). For Mongbo and al. (2022), the association between malnutrition and food insecurity seems clear since the quantity and quality of food depend on food security.
The results of this study establish a link between malnutrition and the presence of other children under 5 years of age in the household. The work of Ernest and al. (2016), and Savadogo (2022) illustrates this result perfectly. The findings of Ernest and al. (2016) show that chronic malnutrition is related to the number of children under five in the household.
## V. CONCLUSION AND RECOMMANDATION
This study is aiming to analyse the risk factors of chronic malnutrition in children aged 6 to 23 months in south west Benin.
According to socio-economic analysis, $76.37\%$ of households live in rural areas. About $90\%$ earn monthly less than 70.000 CFA francs. In Addition, $70\%$ of households cover less than $50\%$ of their needs. Concerning Food Consumption Score (FCS), $26.98\%$ of households have a poor FCS, $32.28\%$ have a borderline FCS, and less than $40.74\%$ have an acceptable food consumption score. Regarding dietary diversity, $88.5\%$ of households consume primarily cereal-based foods. This poses a challenge to a balanced diet and calls for nutrition education. The results on nutrition show that about $27\%$ of children are chronically malnourished. To meet their food and nutritional needs, households do not hesitate to use atypical coping strategies mechanism to survive.
Statistics show that to face daily challenges, $31.22\%$ of households practice stress strategies, and about $21.7\%$ practice crisis or emergency strategies. It should be noted that $13.7\%$ of families are not able to afford some essential non-food items without engaging in coping strategies with irreversible consequences. It is noted that $20.3\%$ of households are marginally able to meet their minimum food needs by depleting livelihood assets or by employing crisis or emergency coping strategies and liquidating their assets. The results of the Chi 2 tests show a dependency between chronic malnutrition and household size, the age category of the child, type of union of the head of household, and average monthly household income. The econometric analyses reveal that the main risk factors for malnutrition in the area under consideration are household size, the age category of the child, type of union, average monthly household income, and household food consumption score.
The results of this study lead to the recommendation that the government develops education on birth control for households, especially in rural areas. This will make it possible to control the size of families. Secondly, a strengthening of nutritional education for women and nannies, in particular, will make it possible to reinforce their knowledge of dietary diversity for children.
Conflict of Interest Statement
The authors state that there is no conflict of interest.
### ACKNOWLEDGEMENT
We wish to acknowledge all the contributors such as field staff, health and administrative authorities without whom this survey could have not been carried out. And thanks to all reviewers.
Consent for Publication
The authors grant his consent for publication of this paper.
Funding
The writing of this paper has not been funded or sponsored. It was done at the author's expense.
Data Availability Statement
The data used in this paper is fully available and can be accessed upon request.
#### APPENDIX
Annex 1: Calculation of the Food Consumption Score
The SCA is a composite score based on dietary diversity. This index takes into account the frequency of meals and the relative nutritional importance of the different food groups consumed by a household. The foods considered are grouped into 8 standard groups: (1) Cereals and tubers; (2) Pulses; (3) Vegetables; (4) Fruit; (5) Meat and fish; (6) Milk; (7) Sugar; (8) Oil. In the construction of the index, the consumption frequency (0 to 7) of each food group is multiplied by a specific weighting coefficient. The values obtained (frequency * nutritional value) are added together to determine the food consumption score (FCS) in a range from 0 to 112 for each household.FCS = (starch*2) + (pulses*3) + vegetables + fruits + (meat*4) + (dairy*4) + (fat*0.5) + (sugar*0.5). This index has been validated by IFPRI as a proxy indicator of energy sufficiency. When a household has a score between 0 and 21, it is considered to have poor food consumption. A score between 21.5 and 35 is interpreted as borderline food consumption. Above 35, food consumption is considered acceptable.
## Annex 2: Calculation of the household dietary diversity score (HDS)
The SDAM focuses on dietary diversity. This index is based on a group of 12 foods. For a given household, it is asked whether the food groups were consumed in the last 24 hours. Household responses are recorded as follows for each of the 12 food groups: "Yes" = (1) and "No" = (0). The responses are then summed to obtain the number of food groups consumed (between 0 and 12) in the last 24 hours.
Annex 3: Calculation of the reduced index of coping strategies related to food access IrSA
The IrSA or rCSI ("reduced Coping Strategy Index") was developed by the World Food Programme (WFP). This indicator focuses on food management. It provides trend information on household food security. It asks what strategies households use when they are faced with a lack of food or money to buy food. Thus, each household is assigned an rCSI score by multiplying the frequency of relevant coping strategies by a severity coefficient and then summing the results as follows: rCSI = alt's less valued + (borrowing\* 2) + decreasing port° + (restr° x 3) + red° nb meals.
## Annex 4: Constructing livelihoods-based coping strategies (LBS)
The strategies can be divided into stress strategies, crisis strategies and emergency strategies. For the livelihoods management module, countries/ organizations should select a total of 10 strategies: 4 stress, 3 crisis and 3 emergency strategies. The master list of strategies developed by WFP suggests severity categories for all included strategies.
### Appendix 5: Calculation of stunting
The indices addressed in this research include height/length for age, weight for height/length, weight for age. The assignment of anthropometric z-scores is based on the WHO child growth standards. It is done through a function that takes into account age (measured by the difference between the date of birth and the date of the interview, both specified to the day of the month), height in centimetres and weight in kilograms (Perumal et al., 2020; Corsi et al., 2017; USAID. 2016).
This study assesses stunting, wasting and underweight in children. The calculation of stunting is based on the child's height and age. It measures chronic nutritional deficiency. Wasting is based on the child's weight and height and measures acute nutritional deficiency. While underweight, based on weight and age, is a composite measure of acute and chronic malnutrition (Perumal et al., 2020; Corsi et al., 2017; USAID. 2016). For wasting, the weight-for-height z-score is less than minus 2 (-2.0) standard deviations above the mean of the WHO child growth standards.
The Table Shows the Results of the Chi2 Test
<table><tr><td colspan="4">Malnutrition by Household Size</td></tr><tr><td>Household size</td><td>Presence of chronic malnutrition</td><td>Absence of chronic malnutrition</td><td>Total</td></tr><tr><td>Less than 5 people</td><td>15</td><td>67</td><td>82</td></tr><tr><td>5 persons and more</td><td>36</td><td>71</td><td>107</td></tr><tr><td>Total</td><td>51</td><td>138</td><td>189</td></tr><tr><td></td><td colspan="3">Pearson Chi2 = 5.55 Prob = 0.0184</td></tr><tr><td colspan="4">Malnutrition by Age Category of Child</td></tr><tr><td>Age category</td><td>Presence of chronic malnutrition</td><td>Absence of chronic malnutrition</td><td>Total</td></tr><tr><td>[6 months to 12 months]</td><td>12</td><td>55</td><td>67</td></tr><tr><td>[1 to 2 years]</td><td>39</td><td>83</td><td>122</td></tr><tr><td>Total</td><td>51</td><td>138</td><td>189</td></tr><tr><td></td><td colspan="3">Pearson Chi2 = 4.34 Prob = 0.0373</td></tr><tr><td colspan="4">Malnutrition According to the Presence or Not of Another Child Under 5 In The Household</td></tr><tr><td></td><td>Presence of chronic malnutrition</td><td>Absence of chronic malnutrition</td><td>Total</td></tr><tr><td>No other child under 5 in the household</td><td>39</td><td>123</td><td>162</td></tr><tr><td>Presence of another child under 5 in the household</td><td>12</td><td>15</td><td>27</td></tr><tr><td></td><td colspan="3">Pearson Chi2 = 4.87 Prob = 0.0273</td></tr><tr><td colspan="4">Malnutrition by Type of Union</td></tr><tr><td>Type of union</td><td>Presence of chronic malnutrition</td><td>Absence of chronic malnutrition</td><td>Total</td></tr><tr><td>Polygamy</td><td>19</td><td>23</td><td>42</td></tr><tr><td>monogamy</td><td>32</td><td>107</td><td>139</td></tr><tr><td>Widowed or divorced</td><td>0</td><td>8</td><td>8</td></tr><tr><td>Total</td><td>51</td><td>138</td><td>189</td></tr><tr><td></td><td colspan="3">Pearson Chi2 = 11.17 Prob = 0.0038</td></tr><tr><td colspan="4">Malnutrition by Average Household Income</td></tr><tr><td>Rate of coverage of household needs</td><td>Presence of chronic malnutrition</td><td>Absence of chronic malnutrition</td><td>Total</td></tr><tr><td>Less than 40,000</td><td>31</td><td>90</td><td>121</td></tr><tr><td>[40000; 70000]</td><td>8</td><td>41</td><td>49</td></tr><tr><td>[100000; 250000]</td><td>9</td><td>3</td><td>12</td></tr><tr><td>More than 250,000 F</td><td>1</td><td>1</td><td>2</td></tr><tr><td>DK</td><td>2</td><td>3</td><td>5</td></tr><tr><td>Total</td><td>51</td><td>138</td><td>189</td></tr><tr><td></td><td colspan="3">Pearson Chi2 = 7.88 Prob = 0.0485</td></tr></table>
Generating HTML Viewer...
References
38 Cites in Article
E Akoto,A Hill (1988). Morbidité, malnutrition et mortalité des enfants.
Mahamane Nassirou Oumarou,Ibrahim Boukary Baoua,Laouali Amadou (2020). CARACTERISATION DES INFESTATIONS DE LA MINEUSE DE LEPI DU MIL, HELIOCHEILUS ALBIPUNCTELLA DE JOANNIS, DANS LA BANDE SUD DU NIGER.
S Ategbo,E Ngoungou,E Kuissi,S Minto\\\’o Rogombe,A Nganso Djokou,A Moussavou (2013). SFP PC-42 - Connaissances des instituteurs gabonais sur l’épilepsie de l’enfant.
R Black,C Victora,S Walker,Z Bhutta,P Christian,M De Onis (2013). Maternal and child undernutrition and overweight in low-income and middle-income countries.
Patrick Borel,Myriam Moussa,Emmanuelle Reboul,Bernard Lyan,Catherine Defoort,Stéphanie Vincent-Baudry,Matthieu Maillot,Marguerite Gastaldi,Michel Darmon,Henri Portugal,Richard Planells,Denis Lairon (2007). Human Plasma Levels of Vitamin E and Carotenoids Are Associated with Genetic Polymorphisms in Genes Involved in Lipid Metabolism , ,3.
G Bosch,B Beerda,W Hendriks,A Van Der Poel,M Verstegen (2007). Impact of nutrition on canine behaviour: current status and possible mechanisms.
Kristine Caiafa,Kathryn Dewey,Kim Michaelsen,Saskia De Pee,Steve Collins,Beatrice Rogers,Tatyana El-Kour,Shelley Walton,Patrick Webb (2019). Food Aid for Nutrition: Narrative Review of Major Research Topics Presented at a Scientific Symposium Held October 21, 2017, at the 21st International Congress of Nutrition in Buenos Aires, Argentina.
Daniel Corsi,Jessica Perkins,S Subramanian (2017). Child anthropometry data quality from Demographic and Health Surveys, Multiple Indicator Cluster Surveys, and National Nutrition Surveys in the West Central Africa region: are we comparing apples and oranges?.
Richard De Groot,Sudhanshu Handa,Luigi Ragno,Tayllor Spadafora (1000). Child malnutrition, consumption growth, maternal care and price shocks: new evidence from Northern Ghana.
M Diop,E Camara,I Barry,M Barry,A Barry,M Doukoure,S Diallo (2020). Facteurs Associés à la Survenue des Infections Respiratoires Aigües chez les Enfants de 0 à 5 Ans Hospitalisés à l'Hôpital National Donka à Conakry.
P Dubot-Guais (2005). La prévention de l'obésité chez l'enfant et l'adolescent.
Michael Ekholuenetale,Godson Tudeme,Adeyinka Onikan,Charity Ekholuenetale (2020). Socioeconomic inequalities in hidden hunger, undernutrition, and overweight among under-five children in 35 sub-Saharan Africa countries.
A Ernest,E Sonia-Estelle,K Gustave,Z Guy-Alexandre,K Séraphin (2016). Sociodemographic factors and risk of protein energy malnutrition in children less than five years old at the General Hospital of Bingerville (Côte d'Ivoire)].
Matthijs Fleurke,Dorien Voskuil,Deirdre Beneken Genaamd Kolmer (2020). The role of the dietitian in the management of malnutrition in the elderly: A systematic review of current practices.
V Groleau,M Thibault,M Doyon,E Brochu,C Roy,C Babakissa (2014). Malnutrition in hospitalized children: prevalence, impact, and management.
E Guy,M Roch (2020). Les formes socioculturelles de la malnutrition des enfants de moins de cinq ans dans la commune de Karimama au du Bénin.
Mohammad Islam,Morshed Alam,Md Tariquzaman,Mohammad Kabir,Rokhsona Pervin,Munni Begum,Md Khan (2013). Predictors of the number of under-five malnourished children in Bangladesh: application of the generalized poisson regression model.
A Kaid,A Ezzrari,S Fekkaklouhail (2022). Prévalence de la malnutrition chez les enfants de moins de cinq ans, rapport taille-poids.
E Kouakou,S Kamara,V Zannou-Tchoko,A Meite,K Bouafou,N Valérie,. Kati-Coulibaly,S (2017). Neglected growth retardation in children aged 6-59 months in developing countries: Case of a subneighborhood of Abidjan Cocody-Ange (Ivory Coast).
M Latham,M Beaudry (2001). Globalization and inequity as determinants of malnutrition: a clear need for activism.
Sebastien Mary,Kelsey Shaw,Liesbeth Colen,Sergio Gomez Y Paloma (2020). Does agricultural aid reduce child stunting?.
Peninah Masibo,Donald Makoka (2012). Trends and determinants of undernutrition among young Kenyan children: Kenya Demographic and Health Survey; 1993, 1998, 2003 and 2008–2009.
V Mongbo,G Ade,C Sossa-Jerome,P Makoutodé,J Saïzonou,B Aguemon,E Ouendo (2018). Prévalence de la malnutrition chez les enfants de moins de cinq ans, rapport taille-poids.
Abdon Mukalay,Prosper Kalenga,Michèle Dramaix,Philippe Hennart,Carole Schirvel,Lydia Kabamba,Benjamin Kabyla,Philippe Donnen (2010). Facteurs prédictifs de la malnutrition chez les enfants âgés de moins de cinq ans à Lubumbashi (RDC).
Oms (2000). Weir, Sir Michael (Scott), (28 Jan. 1925–22 June 2006), HM Diplomatic Service, retired; Director, 21st Century Trust, 1990–2000.
S Padonou (2014). Faible poids de naissance, prématurité et retard de croissance intra utérin: facteurs de risque et conséquences sur la croissance de la naissance a 18 mois de vie chez des nouveau-nés béninois.
Pam (2009). Agenda de recherche sur la sécurité alimentaire et la nutrition au Bénin.
Pam (2014). Évaluation à mi-parcours de l'intervention prolongée de secours et de redressement (IPSR) Niger 200961.
Se-Eun Park,Sungtae Kim,Cyprian Ouma,Mesfin Loha,Thomas Wierzba,Nam Beck (2012). Community Management of Acute Malnutrition in the Developing World.
Nandita Perumal,Sorrel Namaste,Huma Qamar,Ashley Aimone,Diego Bassani,Daniel Roth (2020). Anthropometric data quality assessment in multisurvey studies of child growth.
M Pomati,S Nandy (2020). Assessing progress towards SDG2: Trends and patterns of multiple malnutrition in young children under 5 in West and Central Africa.
S Bougma,F Hama-Ba,F Garanet,A Savadogo (2022). Caracteristiques sociodemographiques des meres et pratiques d’alimentation de complement chez les enfants de 6 a 23 mois dans le centre-nord du Burkina Faso.
S Srivastava,D Verma,A Srivastava,S Tiwari,B Dixit,R Singh,A Rawat (2014). Phytochemical and nutritional evaluation of Amorphophallus campanulatus (Roxb.) Blume Corm.
Susan Thurstans,Charles Opondo,Andrew Seal,Jonathan Wells,Tanya Khara,Carmel Dolan,André Briend,Mark Myatt,Michel Garenne,Rebecca Sear,Marko Kerac (2020). Boys are more likely to be undernourished than girls: a systematic review and meta-analysis of sex differences in undernutrition.
Oms Unicef (2015). Répercussions sur la santé et la nutrition des enfants.
(2015). Anthropometric data in populationbased surveys.
Hui Wong,Foong Moy,Sulochana Nair (2014). Risk factors of malnutrition among preschool children in Terengganu, Malaysia: a case control study.
No ethics committee approval was required for this article type.
Data Availability
Not applicable for this article.
How to Cite This Article
Guy Armand Onambele. 2026. \u201cRisk Factors for Chronic Malnutrition in Children Aged 6 to 23 Months in BOPA, Southwest Benin\u201d. Global Journal of Medical Research - L: Nutrition GJMR-L Volume 23 (GJMR Volume 23 Issue L1).
Explore published articles in an immersive Augmented Reality environment. Our platform converts research papers into interactive 3D books, allowing readers to view and interact with content using AR and VR compatible devices.
Your published article is automatically converted into a realistic 3D book. Flip through pages and read research papers in a more engaging and interactive format.
Our website is actively being updated, and changes may occur frequently. Please clear your browser cache if needed. For feedback or error reporting, please email [email protected]
Thank you for connecting with us. We will respond to you shortly.