Integrating remote sensing and geographic information systems (GIS) can be applied through shoreline monitoring. Coastal environments undergo both natural and anthropogenic processes that drive shoreline changes, making them highly dynamic systems. Kuwait Bay is characterized by its shallow waters and broad intertidal flats, where the tidal activities, wave action, and sediment transportation influence their morphological changes and contribute to critical socio-economic and environmental impacts. This study aims to quantify, calculate, and analyze the metrics of morphological shoreline changes along Kuwait Bay during and to predict the future shoreline position during 2034 and 2044. Four Landsat sensors (5, 7, 8, and 9) derived from the Google Earth Engine (GEE) platform were used for data acquisition. Shoreline changes were analyzed using the DSAS 5.0 extension in ArcMap 10.4, employing metrics such as SCE, NSM, EPR, and LRR, ArcGIS Pro, and Python (ArcPy library) for shoreline extraction and calculating (NDWI). The highest SCE value was 2889.63 m. As for the NSM, the maximum erosion exceeded that of accretion (2432.94 m and 1482.08 m, respectively). The EPR was 78.64 m/y -1 for erosion and 48.09 m/y -1 for accretion.
## I. INTRODUCTION
Coastal zones are ecologically and biologically complex as they support some of the world's most productive ecosystems mangroves, coral reefs, Coastal environments are dynamic and intricate systems where land, sea, and atmosphere interact. The natural processes, biological systems, geological features, and human activity, interplay and vary across space and time. Tides, waves, currents, and storm events, shape and continuously modify the shoreline. Erosion, deposition, and sediment transport occur constantly, reshaping landforms like beaches, deltas, and estuaries, as well as storm surges and high-energy wave events can cause rapid and significant change (Bird, 2008) [1]. Coastlines vary dramatically from rocky cliffs to sandy beaches, estuaries to barrier islands each with unique formation processes and sediment characteristics. The type and resistance of rocks, tectonic activity, and sediment supply all contribute to this diversity (Woodroffe, 2002) [2].
Coastal zones are ecologically and biologically complex as they support some of the world's most productive ecosystems mangroves, coral reefs, salt marshes, seagrasses, etc. These ecosystems are highly sensitive to salinity, temperature, tidal range, and human interference (Barbier et al., 2011) [3]. Coastal areas are often densely populated and heavily developed due to their economic and strategic importance. Urbanization, tourism, port construction, and coastal defenses disrupt natural processes and increase risk elsewhere. Pollution, land reclamation, and sand mining degrade ecosystems and accelerate erosion (UNEP, 2006 [4]; Pilkey & Cooper, 2012 [5]). Coastal environments are on the front lines of climate change. Rising sea levels, increasing storm intensity, and ocean acidification threaten infrastructure and ecosystems. Coastal flooding, saltwater intrusion, and ecosystem collapse are growing concerns (IPCC, 2023 [6]; Nicholls & Cazenave, 2010 [7]). Changes in coastal environments occur on different timescales: short-term (tides, storms), seasonal (monsoons, sediment cycles), and long-term (sea-level rise, tectonic changes (FitzGerald & Hughes, 2019) [8].
Coastal processes are ubiquitous and multifactorial, making understanding all the factors contributing to the proper management of shorelines mandatory. Many authors have focused on the importance of evaluating coastline variations, particularly in areas prospective for large-scale tourism, industrial, or residential facilities. According to Ding and Wang (2008) [9], Hakkou et al. (2018) [10], and Kumar & Jayappa, (2009) [11], shoreline changes are usually caused by the availability of sediment, fluctuating sea levels, rivers, the strength of winds, tidal currents, and wave heights of a region. Measuring and comprehending these processes form the basis for the knowledge of engineers and policymakers because it sorts out the characteristics of erosional environments and their pace of degradation or advancement (Boak and Turner, 2005) [12].
Various approaches were applied to analyze the shoreline changes. For example, Ahsanullah et al., (2021) [13] conducted a study to measure the shoreline changes along Karachies closeline from 1972 to 2020. They extracted the shoreline manually and using Normalized Difference Water Index (NDWI) and Erase tool in ArcGIS to quantify the erosion/accretion along the shoreline. In contrast, Zoysa et al., (2023) [14] investigated Oluvil, Sri Lanka shoreline change from 1991 to 2021 and evaluated the impact that the construction of Harbor's had on the coastline using NDWI and digital shoreline analysis system (DSAS). The results of both studies highlighted the importance of practicing sustainable coastal management.
The study of shoreline includes cyclonic activity, waves, and tides push sand in the landward direction, consistently providing coastal evolution with successive changes. Such settings can, at times, either promote or retard the erosion or, on the other hand, promote or inhibit accretionary events, whether climatically or tectonically generated relative changes in sea levels. All along the coastlines fed by rivers and/or offshore sources is significant in stabilizing or changing the profiles as outlined by [10]. These dynamics, therefore, justify the use of prediction models and other analyses in making accurate future shoreline predictions.
### a) Studies on Kuwait Coastline
An investigation by (El-Anbaawy, 2017) [15] was set to evaluate the marine environment impact of Al-Sabiyah desalination plant inlets and outlets in Kuwait's Arabian Gulf water. One of the key factors that was mentioned is current movement and went on explaining how the tidal currents in Kuwait Bay shown in Figure (1) is responsible for controlling sediments distribution and morphodynamics.
The desert-like environment of the country and its climatic conditions contribute to managing the challenges along the coastline of Kuwait. Kuwait has a desert climate and topographical features, with a geographical indication of Iraq in the north, Saudi Arabia in the south, and Arabian Gulf in the east. The general inclination of the country descends gradually from the Arabian Gulf in the Northeast towards the Southwest with an altitude of $20\mathrm{m}$ - $300\mathrm{m}$ above sea level. Relatively low rains and high evaporation rates add to sedimentary and hydrological problems, increasing coastal space sensitivity. Kuwait has a 499-kilometer clay coastline. In the last decades, anthropogenic impacts on the coastline have increased significantly due to industrial, recreational, and residential constructions.
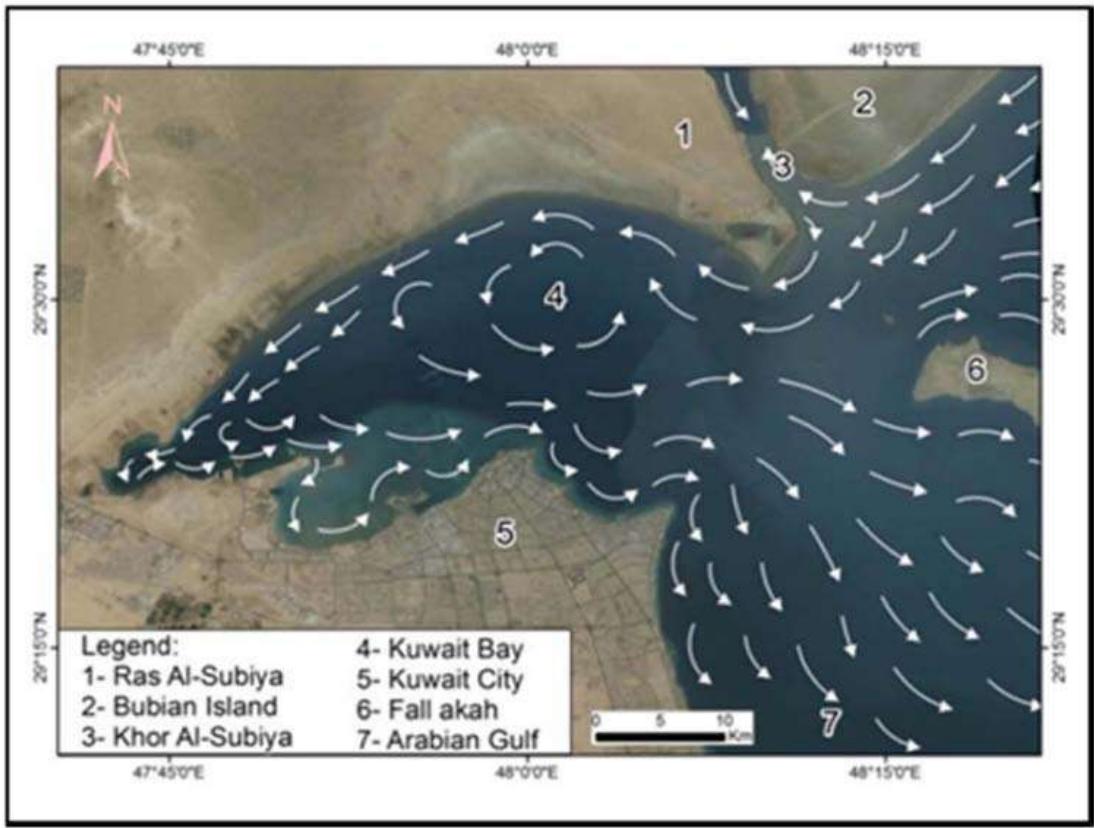
Figure 1: A Map Showing the Anticlockwise Current Movement of Kuwait Bay (after El-Anbaawy, 2017)
Some of the leading activities are the development of seven commercial and oil seaports and the development of oil refineries, including the Mina Abdullah refinery. The aforementioned changes have interfered with natural sedimentation and the hydrodynamic systems where shoreline surveillance is required to contain the impacts positively. A recent study done by (Al-Attar & Basheer, 2023) [16] used on-screen digitizing to extract the entire Kuwait coastline and divided it to four zones and used DSAS to measure the rate of erosion/accretion, and results showed that Zone 2 (Kuwait Bay) showed the highest shoreline change rate where the overall trend is accretion.
Several researches showed how human activities have transformed the Kuwaiti coastline morphology. Sedimentation processes, which are also disturbed through land reclamation, industrial addition, and growth of human city centers, worsen erosion or accretion trends. For example, dredging related to port construction leads to seabed changes, which change the energy of waves and sedimentation (Hassan, 2016) [17]. Existing and planned oil refineries and other related industries aggravate these conditions, contributing to the shoreline's shallowness.
These or similar difficulties still need to be encountered even to this present time despite the advancement in technology in shoreline study. Low-cost and high-resolution data acquisition, particularly on areas of rugged coastline such as Kuwait Bay, could be costly. However, proper integration of ecological or hydrodynamic and socio-economic data is key, although practiced insufficiently often. Modern technologies can offer more possibilities for constructing a numerically more accurate forecast of coastline changes, chiefly machine learning.
### b) Significance of Kuwait Bay
Kuwait Bay (the main focus of this study) is a large, semi-enclosed water body located in the northeastern part of Kuwait, opening into the northwestern Arabian Gulf. Its shallow waters and tidal variations contribute to complex water circulation patterns, which influence salinity, sediment transport, and habitat formation. The bay serves as a natural harbor, providing a sheltered zone for maritime and shipping activities (Al-Rashidi et al., 2009) [18]. Kuwait Bay supports diverse marine ecosystems, including mangroves, coral assemblage, salt marshes, mudflats, and seagrass beds. These habitats serve as breeding and nursery grounds for a variety of marine organisms, including crustaceans, mollusks, and benthic invertebrates commercially important fish species (e.g., mudskipper, mullets) (Al-Yamani et al., 2004 [19]; Khan et al., 2002 [20]). The bay's intertidal zones include salt marshes and sabkhas (coastal salt flats), which are important for halophytic vegetation and specialized fauna. These habitats contribute to nutrient cycling, shoreline stabilization, and biodiversity conservation [20]. The bay is a key stopover site for migratory birds along the Central Asian Flyway. It supports various bird species including flamingos, herons, terns, and sandpipers (Evans, 1994 [21]; Al-Abdulrazzak, 2007 [22]). Mudflats and shallow water provide feeding and roosting grounds for these birds during migration and wintering periods.
Kuwait Bay is integral to Kuwait's economy, being in proximity to major infrastructure such as Shuwaikh Port and Kuwait City. The bay supports vital industries, including shipping, oil refining, and fisheries. Historically, it has supported artisanal fishing and remains a key area for maritime trade and oil exportation [19]. Due to its shallow and semi-enclosed nature, the bay is particularly vulnerable to environmental degradation and pollution [20]. Pollution, habitat loss, overfishing, and coastal development have adversely affected biodiversity in Kuwait Bay. Oil spills, particularly during the 1991 Gulf War, caused extensive damage to marine and coastal ecosystems (Price, 1998 [23]; KISR, 2021 [24]).
Shoreline change analysis is central in establishing the dynamics of coastal environments, especially in regions known for erosion and/or accretion, such as Kuwait Bay, which is greatly influenced by tidal activities, wave action, and sediment transportation processes. Kuwait Bay is known to be a sensitive area that undergoes gradual changes for various reasons that are either natural or anthropogenic activities (El-Raey et al., 1999 [25]; Al-Mansoori, 2020 [26]). Kuwait Bay is relatively shallow and contains comparatively large intertidal flats, which will make this area very sensitive to changes in the quantity and distribution of currents and sediments.
Previous studies on Kuwait Bay have primarily focused on shoreline mapping or sediment transport, often lacking comprehensive, long-term assessments that incorporate both spatial and morphological dimensions. This study addresses this gap by combining (NDWI) and (DSAS) to conduct a 31-year shoreline change analysis (1993-2024), while also integrating morphological characteristics of the coast. This dual approach not only quantifies the rates and directions of shoreline movement but also examines how morphological changes, such as erosion-accretion patterns, and coastal shape dynamics, evolve over time. Furthermore, the study provides predictive shoreline positions for 2034 and 2044, offering a forward-looking perspective that supports coastal management, hazard mitigation, and infrastructure planning in the face of environmental and anthropogenic pressures. To date, no published work has combined both temporal shoreline change modeling and morphological correlation at this scale in Kuwait Bay.
Due to its previously indicated ecological, environmental and socio-economic significance, Kuwait
Bay requires constant assessment of shoreline changes to aid efficient coastal management (Sheppard et al., 2010 [27]; Al-Dousari et al., 2015 [28]).
Data collection by conventional means, including field surveys, is often lengthy, expensive, and exhaustive in large study areas (Natesan et al., 2015 [29]). These limitations made it essential to apply remote sensing and Geographic Information System (GIS) techniques, particularly in monitoring studies. Planetary, frequent coverage remote sensing is employed to monitor the shorelines, and multispectral satellite images are used for the analyses. Implementation of ArcGIS enhances the capability of evaluating shoreline changes and displays stunning outcomes with great precision (Ruiz-Beltran et al., 2019 [30]). Easy access to satellites has also contributed to using remote sensing and geospatial information systems in the shoreline study (Qiao et al., 2018 [31]; Salmon et al., 2019 [32]). Satellite data offers a relatively cheaper and faster image acquisition method than actual field surveys since they are applicable in large areas over an extended period [30]. Those refinements like NDWI improve how shorelines can be identified, or the rate of changes quantified. These developments simultaneously enable the evaluation of the natural and human impacts and enhance management decisions [31; 32]. Shetty et al., (2015) [33] provided compelling data showing that applying GIS and remote sensing is essential in understanding morphological changes along a shoreline.
(DSAS) has also been typically used in assessing shoreline change and quantifying erosion and accretion trends along specific or particular coastal profiles (Thieler et al., 2009) [34]. Scholars focusing on the Arabian Gulf have also shown that shoreline configuration and ability to maintain such aspects are affected by anthropogenic activities such as land reclamation and urbanization [25; 26].
It is observed that the Kuwait Bay shoreline under analysis influences reflects both natural processes and anthropogenic factors. Such influences can only be understood through modern approaches such as remote sensing and geographical information systems, which help manage coastline. Such approaches can help researchers to collect data on short-term temporal changes and help planners to construct strategic long-term planning for Kuwait's sustainable coastal development that will not have adverse impacts on the coastal ecosystems and socioeconomic resources.
This study aims to investigate and predict shoreline changes along Kuwait Bay by quantifying and analyzing the morphological changes along the shoreline of Kuwait Bay using (NDWI) and (DSAS) and estimating the condition of the shoreline in 2034 and 2044 using historical records and analysis to determine possible changes in the morphology of the bay. In the same context, this study evaluates Kuwait Bay's potential future shoreline change as influenced by wave and tidal forces and the modified physical coastal development through construction and reclamation activities. These changes present social and economic impacts on the environment, which, for example, lead to habitat alteration or enhanced vulnerability to coastal hazards and have implications on coastal resources. Hence, identifying and assessing these changes are relevant for reasonable management and utilization of the coastal zone.
### c) Study Area
This research is limited to the northern coast of the Arabian Gulf, from Ras Al-Sabiyah to Ras Al-Ard (Fig. 2). The geographical extent of the study area is defined by the following coordinates: Top at $29.580582^{\circ}$, with Bottom at $29.299879^{\circ}$, Left at $47.700196^{\circ}$, Right at $48.199582^{\circ}$. The coordinate system used is WGS84 (EPSG: 4326). The study area is approximately 850 square kilometers $(\mathrm{km}^2)$, with a length of roughly 50 kilometers, a width ranges from 16 to 20 kilometers, and average depth of 2 to 5 meters [19; 20]. This area where Kuwait Bay is located has limited water depth and ample intertidal areas and, therefore, is very sensitive to variation in the hydrodynamic and sedimentation processes.
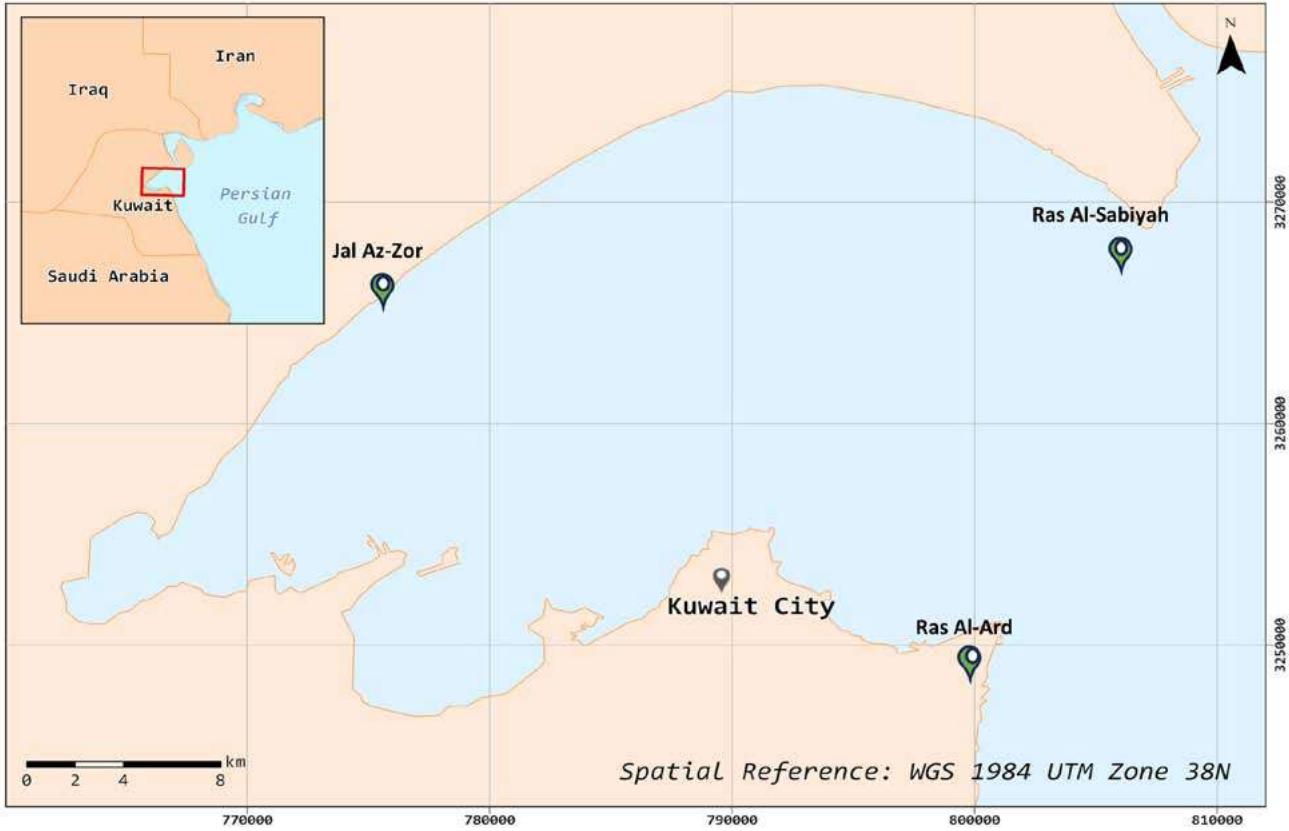
Figure 2: Geographic extent of the study area along Kuwait Bay, between Ras Al-Sabiyah, Jal Az-Zor, and Ras Al-Ard.
Kuwait Bay is significant due to its proximity to Kuwait City, making it highly vulnerable to urban and industrial pressure. Also, it hosts commercial port, fisheries and recreational zones, which makes it play a crucial role in the country's economic and ecological systems.
### d) Morphology
The geographical features include tidal flats, sand bars, deltas, shallow coastal shelves, and lesser depths that define the morphology of Kuwait Bay and thereby regulate sediment mobility and hydrodynamic environments. These morphological features depend on the dynamic natural processes of tidal currents, wave actions, sediment procession, transport, and other anthropogenic activities such as reclamation of land, dredging, and coastal development. Morphological analysis is essential for the assessment of the functional characteristics of the bay at the evolutionary level. For instance, sediment redistribution affects currents in which sea organisms can live and breed and changes in coastal evolution that affect fishing, recreational purposes, and the stability of coastal structures.
Most of the changes are gradual and steady, while others are discrete and, as such, call for keen monitoring and assessment. This project provides more study of shoreline change and morphology to understand the dynamics of the bay to support sustainable management and planning endeavors [27;
28]. A significant portion offshore of Kuwait Bay seems to have been shaped and modified by tidal processes, wave energy, and sediment transport [27]. However, actions like coast development and land reclamation have greatly affected it, making it difficult to determine the shore formation [26; 28]. They make Kuwait Bay a suitable area in which to examine the interactions between natural and anthropogenic processes that shape the coastal systems within which the DSAS application may assist in identifying many of these relationships further by coastal development and land reclamation, which add uncertainty to its shoreline change [26; 28].
This project emphasizes the significance of understanding the aspects of coastlines as a means of mitigating the priced dangers and conserving valuable coastal habitats. This current study used satellite data and shoreline extraction techniques to determine future shoreline trends of Kuwait Bay.
## II. METHODOLOGY
The method applied to this study includes the following steps to measure and assess shoreline transformation in Kuwait Bay using the (DSAS): data obtainment, preliminary data processing, obtaining the shoreline, and performing the analysis according to the DSAS.
### a) Data Collection and Processing
Landsat images derived from the Goggle Earth Engine (GEE) platform were used for the study; the spatial and temporal analysis was from 1993 to 2024. Imagery from four Landsat sensors, the Landsat 5, 7, 8, and 9 missions, were chosen for the analysis to capture as many temporal samples as possible during this period. Therefore, all images were selected based on figures showing the least cloud cover for shoreline analysis (Wulder et al., 2019) [35]. These are shown in (Table 1), which indicate the particular datasets and the corresponding acquisition dates.
Table 1: Landsat Datasets and Acquisition Dates.
<table><tr><td>Year</td><td>Landsat Mission</td><td>Dataset</td><td>Acquisition Date</td></tr><tr><td>1993</td><td>Landsat 5</td><td>LANDSAT/LT05/C02/T1</td><td>6/12/1993</td></tr><tr><td>1994</td><td>Landsat 5</td><td>LANDSAT/LT05/C02/T1</td><td>3/27/1994</td></tr><tr><td>1995</td><td>Landsat 5</td><td>LANDSAT/LT05/C02/T1</td><td>3/30/1995</td></tr><tr><td>1996</td><td>Landsat 5</td><td>LANDSAT/LT05/C02/T1</td><td>6/11/1996</td></tr><tr><td>1997</td><td>Landsat 5</td><td>LANDSAT/LT05/C02/T1</td><td>5/13/1997</td></tr><tr><td>1998</td><td>Landsat 5</td><td>LANDSAT/LT05/C02/T1</td><td>4/7/1998</td></tr><tr><td>1999</td><td>Landsat 5</td><td>LANDSAT/LT05/C02/T1</td><td>8/16/1999</td></tr><tr><td>2000</td><td>Landsat 7</td><td>LANDSAT/LE07/C02/T1_L2</td><td>4/20/2000</td></tr><tr><td>2001</td><td>Landsat 7</td><td>LANDSAT/LE07/C02/T1_L2</td><td>3/6/2001</td></tr><tr><td>2002</td><td>Landsat 7</td><td>LANDSAT/LE07/C02/T1_L2</td><td>2/21/2002</td></tr><tr><td>2003</td><td>Landsat 7</td><td>LANDSAT/LE07/C02/T1_L2</td><td>4/29/2003</td></tr><tr><td>2004</td><td>Landsat 7</td><td>LANDSAT/LE07/C02/T1_L2</td><td>2/27/2004</td></tr><tr><td>2005</td><td>Landsat 7</td><td>LANDSAT/LE07/C02/T1_L2</td><td>3/17/2005</td></tr><tr><td>2006</td><td>Landsat 7</td><td>LANDSAT/LE07/C02/T1_L2</td><td>3/20/2006</td></tr><tr><td>2007</td><td>Landsat 7</td><td>LANDSAT/LE07/C02/T1_L2</td><td>7/29/2007</td></tr><tr><td>2008</td><td>Landsat 7</td><td>LANDSAT/LE07/C02/T1_L2</td><td>3/25/2008</td></tr><tr><td>2009</td><td>Landsat 7</td><td>LANDSAT/LE07/C02/T1_L2</td><td>3/12/2009</td></tr><tr><td>2010</td><td>Landsat 7</td><td>LANDSAT/LE07/C02/T1_L2</td><td>7/21/2010</td></tr><tr><td>2011</td><td>Landsat 7</td><td>LANDSAT/LE07/C02/T1_L2</td><td>3/2/2011</td></tr><tr><td>2012</td><td>Landsat 7</td><td>LANDSAT/LE07/C02/T1_L2</td><td>3/4/2012</td></tr><tr><td>2013</td><td>Landsat 8</td><td>LANDSAT/LC08/C02/T1_L2</td><td>5/18/2013</td></tr><tr><td>2014</td><td>Landsat 8</td><td>LANDSAT/LC08/C02/T1_L2</td><td>3/18/2014</td></tr><tr><td>2015</td><td>Landsat 8</td><td>LANDSAT/LC08/C02/T1_L2</td><td>4/6/2015</td></tr><tr><td>2016</td><td>Landsat 8</td><td>LANDSAT/LC08/C02/T1_L2</td><td>3/23/2016</td></tr><tr><td>2017</td><td>Landsat 8</td><td>LANDSAT/LC08/C02/T1_L2</td><td>3/10/2017</td></tr><tr><td>2018</td><td>Landsat 8</td><td>LANDSAT/LC08/C02/T1_L2</td><td>4/14/2018</td></tr><tr><td>2019</td><td>Landsat 8</td><td>LANDSAT/LC08/C02/T1_L2</td><td>6/4/2019</td></tr><tr><td>2020</td><td>Landsat 8</td><td>LANDSAT/LC08/C02/T1_L2</td><td>3/2/2020</td></tr><tr><td>2021</td><td>Landsat 8</td><td>LANDSAT/LC08/C02/T1_L2</td><td>4/6/2021</td></tr><tr><td>2022</td><td>Landsat 9</td><td>LANDSAT/LC09/C02/T1_L2</td><td>4/17/2022</td></tr><tr><td>2023</td><td>Landsat 9</td><td>LANDSAT/LC09/C02/T1_L2</td><td>4/4/2023</td></tr><tr><td>2024</td><td>Landsat 9</td><td>LANDSAT/LC09/C02/T1_L2</td><td>4/6/2024</td></tr></table>
Thus, from 2004 to 2012, the available data was from Landsat 7, which had a scan line error (Markham et al., 2004) [36]. Nevertheless, in the study period, Landsat 7 data were utilized with additional corrections to deal with data loss due to this scan line error. All
Landsat imagery shown in Figure (3) was collected in the WGS84 coordinate system and reprojected into WGS 1984 UTM Zone 38N (EPSG: 26 238 for spatial analysis shown in Figure (3).
Since the data acquired through GEE was preliminarily preprocessed, they underwent radiometric, atmospheric, and geometric corrections, ensuring the reliability of the satellite images analyzed (Chander et al., 2009) [37]. Figure (4) shows the breakdown of the study's methodology.
### b) Shoreline Delineation
For shoreline Delineation, the NDWI calculation was integrated with vector conversion methods through Python ArcPy (Zou et al., 2016) [38]. Different stages of the shoreline extraction processes are illustrated in (Fig. 5).
The shoreline extraction processes followed these steps:
- Data Preparation: Landsat7 and Landsat8 data in Surface Reflectance (SR) bands was preprocessed and retrieved in geo-Tiff format using GEE. These files were stored in an input folder comprising sub folders for each category.
- NDWI Calculation: To improve water feature detection, the NDWI was calculated for the expression below (McFeeters, 1996) [39]:
$$
N D W I = (G r e e n - N I R) / (G r e e n + N I R) \quad E q. 1
$$
Green means Band 2, and NIR means Band 4 in the Landsat 5 & 7 datasets were used.
- Binary Classification: For the NDWI raster a reclassification was made to convert the raster into a binary format where the threshold was set to zero (0). These were then classified as water where the NDWI values are $>0$, and as land where the values are less than zero. This binary classification made the distinction between aquatic areas and land areas much easier to make.
- Shoreline Extraction: The digital binary raster was then converted to vector polygon style by using the "Raster to Polygon" function with the help of reference (Wang et al., 2014) [40]. It also shaped the possibility to represent the water bodies in the form of polygons. An area filter erased any shallow internal water body and any island of under 100,000 $m^2$ to home in on prominent coastal features.
The uncertainty in the extracted shoreline positions was accounted for by considering the spatial resolution of the satellite imagery and the classification method used for NDWI. For Landsat images (30 m resolution), a standard pixel-based buffer of $\pm 50\mathrm{m}$ was applied on either side of the extracted shoreline to represent positional uncertainty, following common practice in similar coastal change studies.
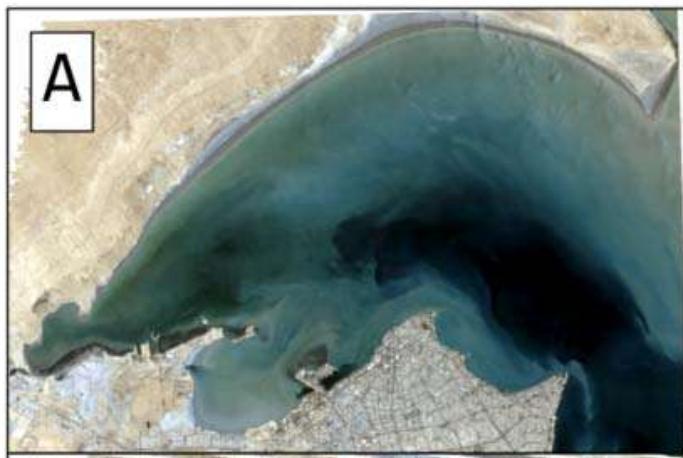
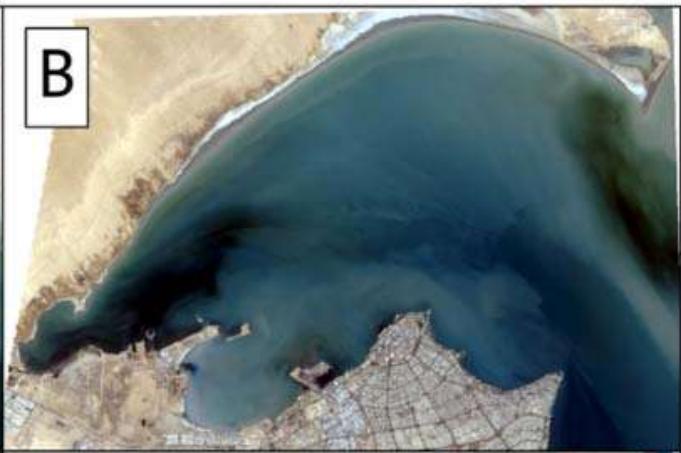

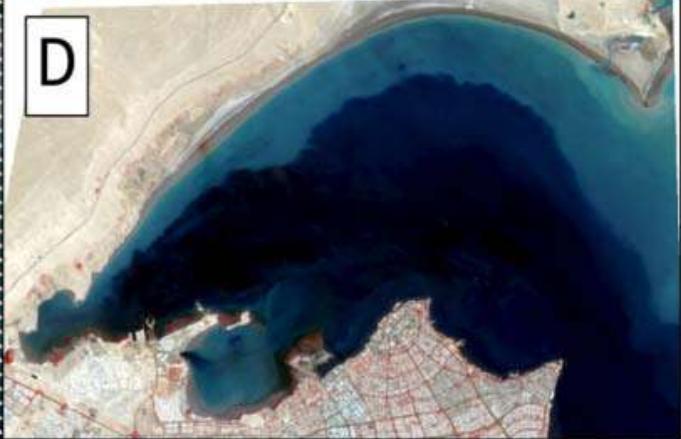
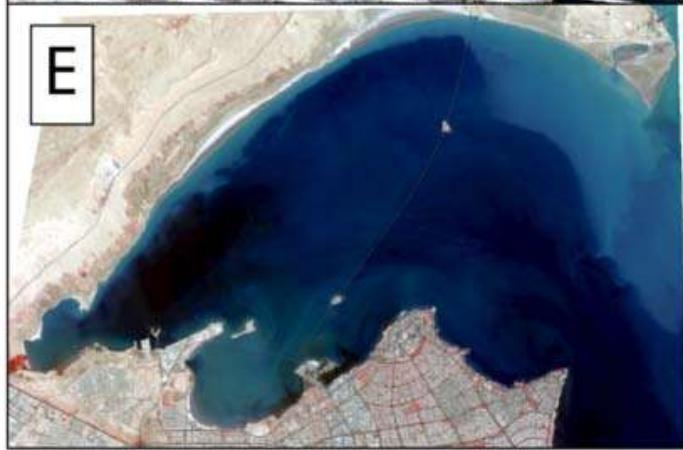
Figure 3: Landsat imagery of the study area used in the analysis: (A) Landsat 5, (B) Landsat 7, (C) Landsat 7 with scan line error, (D) Landsat 8, and (E) Landsat 9.
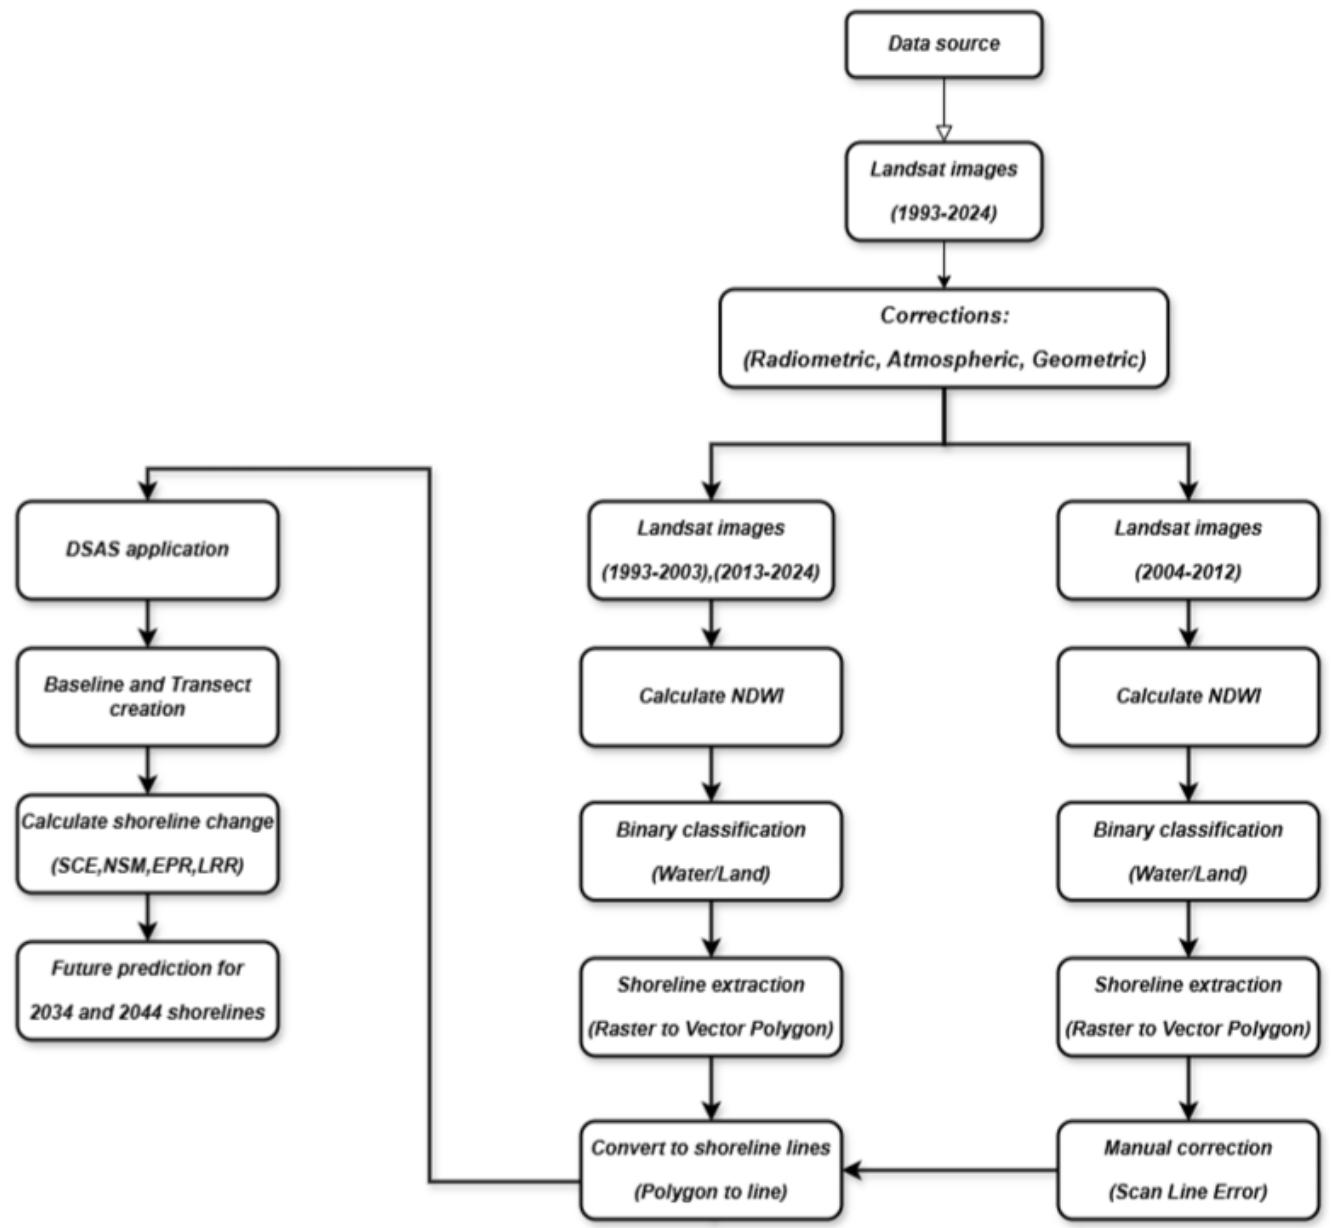
Figure 4: Flow chart of the overall methodology approach in this study.
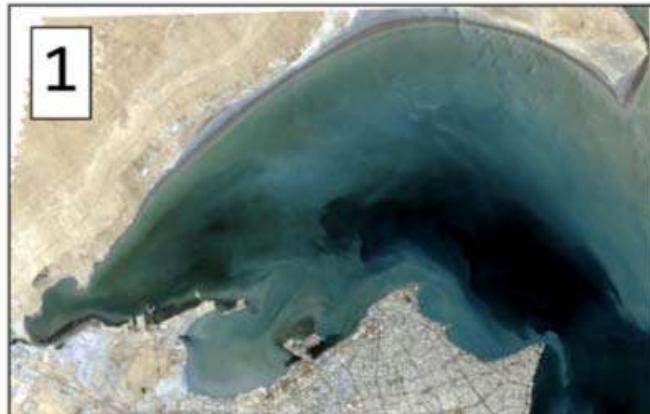
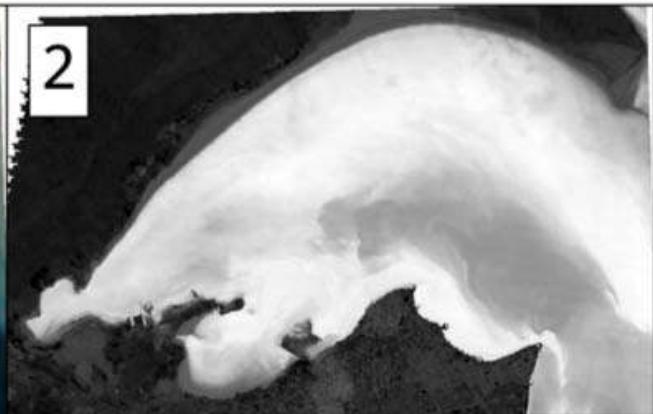
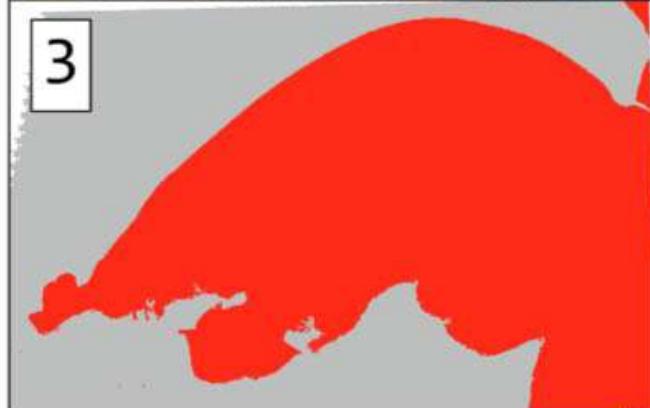
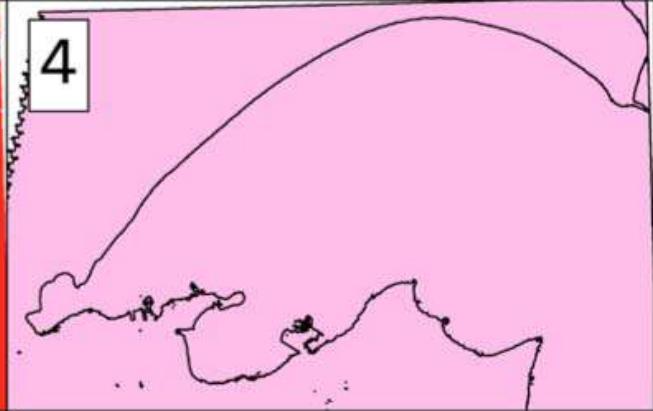
Figure 5: Different stages of the shoreline extraction processes: (1) Original satellite imagery, (2) NDWI raster calculation, (3) Binary classification of water and land, (4) Conversion of water areas into polygons, and (5) Final version of the shoreline after manual corrections.
- Conversion to Shoreline Lines: The obtained water polygons were then converted to line features using the "Polygon to Line" tool which provided precise edge of water and land. This step was necessary for additional analysis of the shoreline in DSAS.
- Manual Correction: Shorelines identified using the Landsat 7 data acquired between 2004 and 2012 were needed to be corrected due to the scan line error. Some of these corrections entailed checking the extracted shorelines against the NDWI raster to determine if the correct boundary of the shoreline was represented during this period.
- Quality Assurance: At each stage of shoreline extraction, there were intermediate controls that
included confirmation of the binary classification before conversion to polygons and lines. This made the extracted shoreline data credible through these following steps.
### c) (DSAS) Application
The shoreline vectors were then exported and imported into ArcMap 10.4 to run the (DSAS) extension developed by the United States Geological Survey [34]. The analysis of the shoreline using the DSAS tool provided information on different aspects of change indices such as Shoreline Change Envelop (SCE), Net Shoreline Mvement (NSM), (EPR), and Linear Regression Rate (LRR).
The Shoreline Analysis Process Followed these Steps:
1. **Baseline and Transect Creation:** An initial line parallel to the shoreline was created, and cross-sections of the transect were created one hundred meters apart. These transects extended typically to the coastline and acted as topographic controls to determine historical shoreline shifts [34].
2. Shoreline Change Metrics: In order to measure shoreline changes, DSAS determined the following statistics:
- (SCE): Quantifies the extent of the shoreline across the particular transect by establishing the distance between the two extreme positions of the offshore and the inland shores.
- (NSM): Determines the vertical reach of shoreline positions along each cross-shore transect.
- End Point Rate (EPR): Expresses the amount of shoreline change over one year in average real-time, established in the formula:
$$
EPR = \frac{\text{Net shoreline Movement}}{\text{Time intervals (Num.of years)}} \quad \text{Eq.} 2
$$
- (LRR): This measures the rate of change over time through a linear regression analysis of all the shoreline positions in a transect and gives a lasting numeric value for the trend [34].
1. Predicting future Shoreline Positions: Potential future shoreline changes were forecast using the forecasted shoreline positions and the DSAS tool, specifying 2034 and 2044 as the predicted years. This project was based on past activity and gave information about the likely future activity of the shoreline.
In DSAS, a transect uncertainty buffer was incorporated to reflect these compounded errors, ensuring that the computed rates of shoreline change (e.g., EPR, LRR) include confidence intervals. These considerations ensure that the derived trends and forecasts are statistically robust and spatially realistic.
In this study, shorelines were extracted using the NDWI method from Landsat imagery (30 m resolution) via Google Earth Engine. While a formal DSAS-style shoreline uncertainty table was not constructed, the methodology followed key principles in line with DSAS standards.
### Specifically:
- A consistent shoreline proxy (NDWI) was applied uniformly across all years (1993–2024).
- Transects were spaced evenly, and a buffer of $\pm 50$ meters was used around the extracted shoreline to account for spatial variability and uncertainty.
- The selected buffer incorporates known sources of error, including sensor spatial resolution, image
georeferencing accuracy, NDWI thresholding sensitivity, and potential tidal variability.
Based on published literature and Landsat metadata, positional uncertainty for Landsat imagery is approximately $\pm 15$ meters. Therefore, the applied $\pm 50$ m buffer is considered sufficient to accommodate these combined uncertainties.
Shoreline positions were extracted from Landsat imagery (1993-2024) using the NDWI method in Google Earth Engine. It was considered that the effects of cloud cover, tidal stage, and image resolution on shoreline mapping accuracy are as follows:
- Cloud Cover: Cloud presence can obscure the shoreline and affect classification. To address this, the standard cloud masking functions available in Google Earth Engine was applied to exclude cloudy pixels. Additionally, the image collection was filtered to select only those scenes with low cloud cover (typically less than $10\%$ ), ensuring that only clear-sky images were used for shoreline extraction.
- Tidal Stage: Landsat imagery is acquired at varying tidal stages, which can introduce horizontal displacement of the shoreline. Although tidal data were not explicitly incorporated into the analysis, the use of multiple images across a long-time span, combined with a consistent NDWI threshold, helps reduce the influence of short-term tidal variations. Furthermore, a $\pm 50$ m buffer was applied around each shoreline to account for potential positional shifts, including those caused by tidal fluctuations.
- Image Resolution: The 30-meter spatial resolution of Landsat imagery limits the ability to detect fine-scale shoreline features. While this introduces some positional uncertainty, using the same resolution and NDWI extraction method across all years ensures methodological consistency. The $\pm 50$ m buffer also compensates for potential misalignment due to resolution limitations.
Table (2) indicates the differences and significance of the used indices.
Table 2: Differences among the Indices used along with their Significance.
<table><tr><td>Method</td><td>Full Name</td><td>Purpose in Shoreline Extraction</td><td>Main Advantage</td><td>Main Limitation</td><td>Type</td></tr><tr><td>NDWI</td><td>Normalized Difference Water Index</td><td>Precisely delineates water bodies to extract shoreline</td><td>High accuracy in detecting water-land boundaries, especially in coastal zones</td><td>May misclassify built-up areas or shadows</td><td>Automated (Remote Sensing)</td></tr><tr><td>NDVI</td><td>Normalized Difference Vegetation Index</td><td>Identifies vegetated land; indirectly separates land/water</td><td>Useful where vegetation clearly marks land areas</td><td>Inaccurate in barren or sandy coastlines</td><td>Automated (Remote Sensing)</td></tr><tr><td>Digitizing</td><td>Manual Digitizing (On-Screen)</td><td>Manual tracing of shoreline from imagery</td><td>Allows expert-based corrections in complex cases</td><td>Time-consuming, subjective, and not scalable</td><td>Manual (GIS)</td></tr></table>
## III. RESULTS AND DISCUSSION
### a) Shoreline Extraction Results
The selected shorelines from the shoreline extraction had considerable spatial and temporal changes along Kuwait Bay from 1993 to 2024. Here, 32 shorelines were extracted from the Landsat imagery with low cloud coverage years and high data quality. These shorelines show different degrees of coastal erosion/ accretion, with clear trends demonstrated in regions affected by both natural and human activities.
Several shorelines are depicted in Figure (6) for each of the years under analysis in the study area. The dashed lines in the given color spectrum express the shoreline for different years, based on which one can understand the shifting of the coastline. The extracted area of interest is illustrated at higher magnification to highlight the changes along Kuwait Bay's northern shoreline, where the erosion and accretion features are noted.
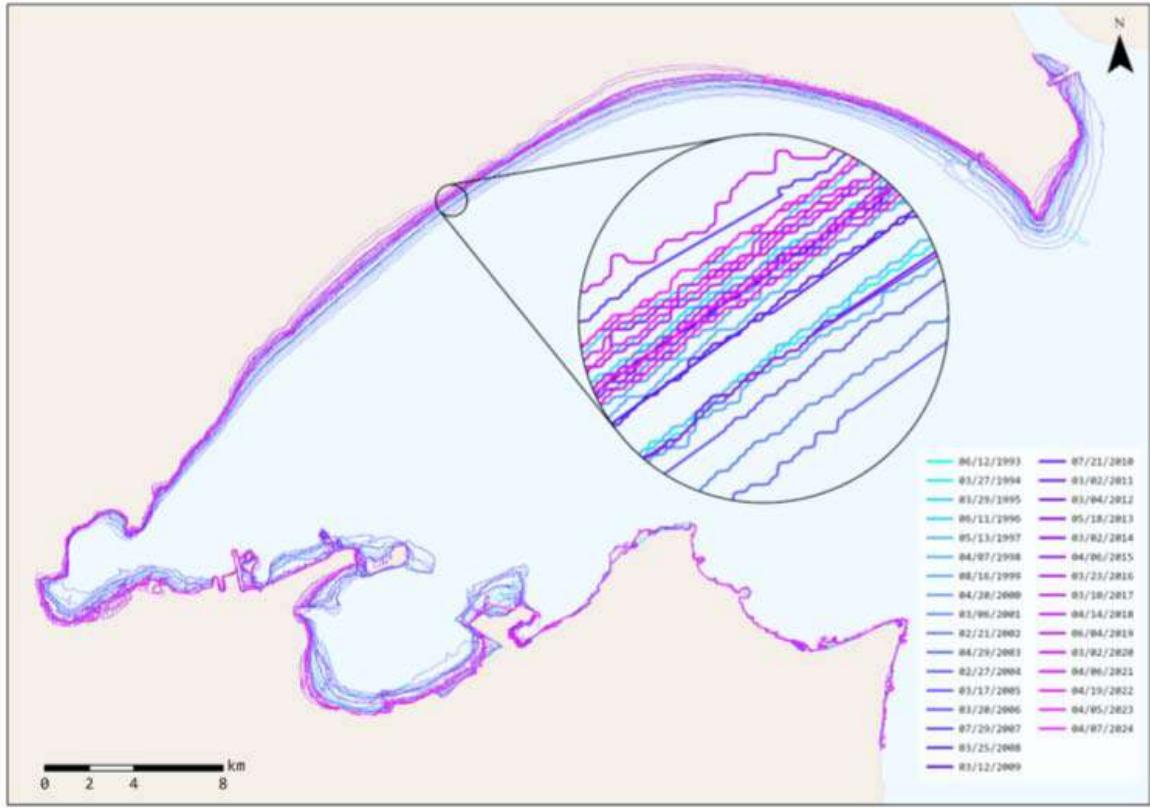
Figure 6: Extracted shoreline positions for Kuwait Bay from 1993 to 2024.
### b) Digital Shoreline Analysis System (DSAS) Result
## i. Baseline and Transects
The concept of baseline and transect generation included establishing an initial line (baseline) along the Kuwait Bay shore by using a Buffer with 50 meters radius and forming cross-sectional lines (transects) with spacings of 100 meters between each transect since the accurate measurement of shoreline shift over time was crucial. Those cross-sections were used as the yardstick for all changes in shoreline positions. Figure (7) shows the baseline and the transects generated over the study area. The transects are laid down at equal intervals, giving a detailed measure of the coastal change from one end of the study period to the other.
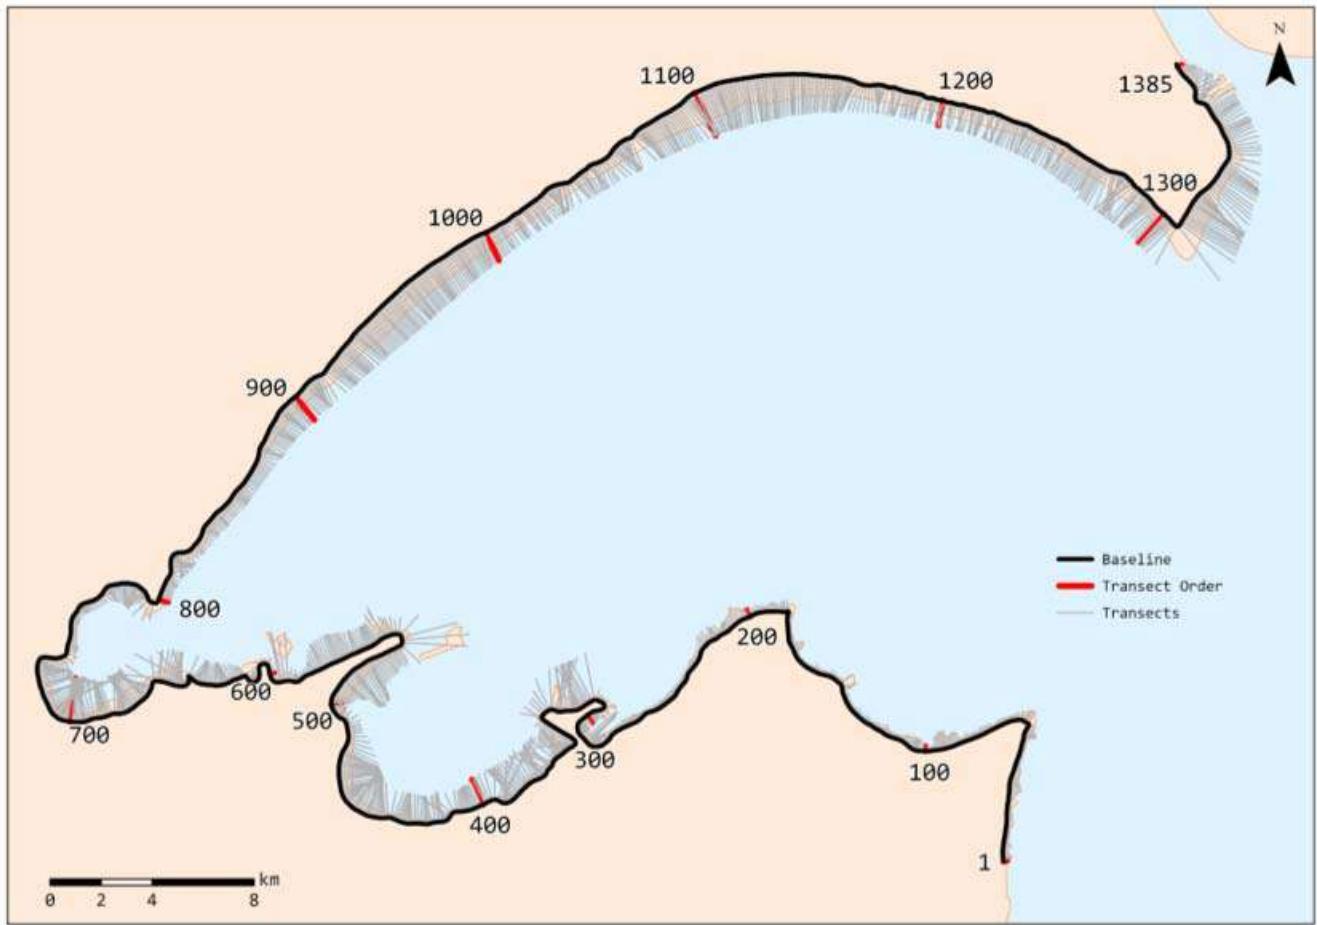
Figure 7: Baseline and transects generated for shoreline analysis across Kuwait Bay.
## ii. Shoreline Change Metrics
The Shoreline Change Metrics describe the overall nature of changes that occurred along the Kuwait Bay shoreline from the early 1993 to middle of 2024. Four main parameters derived with the help of the DSAS tool are as follows: 1) (SCE), 2) Net Shoreline Movement (NSM), 3) (EPR), 4) (LRR). The outcomes of these quantifiable indices have been computed on the basis of 1384 transects conducted along the coast.
### 1. (SCE).
The SCE quantifies the distances between the most landward and seaward shoreline positions along each of these transects. The average SCE value of the study area is 7 meters, which shows that there is a huge fluctuation in the shoreline position all over the region. The highest SCE obtained was 2889.36 meters at transect ID 710 while the lowest was 25.04 meters at transect ID 162.
- Total number of transects: 1384.
- Average SCE: 895.77 meters
- Maximum SCE: 2889.36 meters (Transect ID: 710)
- Minimum SCE: 25.04 meters (Transect ID: 162)
These values indicate that the fluctuations of coastline direction in some parts of this region have experienced substantial number of changes in shoreline position, which may be attributed to natural factors as well as human-made interventions such as land filling.
#### 2. (NSM)
The NSM is defined as the difference in shoreline position between the first and last recognized shorelines. The mean value of NSM average is -318.7 meters which suggests that every NSM site experiences general tendency of shoreline erosion. A comparison of transects indicated that $79.19\%$ of the transects showed negative NSM values (erosion) while $20.81\%$ revealed positive NSM values (accretion). At the same time, the loss of material is maximal at the transect ID 540 (-2423.94 meters,) while the gain of material is maximum at the transect ID 351 (1482.08 meters) (Table 3).
1. Total number of transects: 1384.
2. Average NSM: -318.7 meters
3. Maximum Erosion (Negative NSM): Transect ID: 540:
4. Maximum Accretion (Positive NSM): 1482.08 meters (Transect ID: 351)
5. Percent of transects with erosion: $79.19\%$ (1096 transects)
6. Percent of transects with accretion: $20.81\%$ (288 transects)
Table 3: Shows the resultant values of NSM, EPR, and LRR.
<table><tr><td>Metric</td><td></td><td>Value</td><td>Transect ID.</td></tr><tr><td rowspan="3">NSM</td><td>Max. Erosion</td><td>-2423.94 m</td><td>540</td></tr><tr><td>Max. Accretion</td><td>1482.08 m</td><td>351</td></tr><tr><td>Average</td><td>-318.7 m</td><td>-</td></tr><tr><td rowspan="3">EPR</td><td>Max. Erosion</td><td>-78.64 m/yr</td><td>540</td></tr><tr><td>Max. Accretion</td><td>48.09 m/yr</td><td>351</td></tr><tr><td>Average</td><td>-10.34 m/yr</td><td>-</td></tr><tr><td rowspan="3">LRR</td><td>Max. Erosion</td><td>-29.71 m/yr</td><td>549</td></tr><tr><td>Max. Accretion</td><td>65.04 m/yr</td><td>351</td></tr><tr><td>Average</td><td>-7.27 m/yr</td><td>-</td></tr></table>
#### 3. (EPR)
The EPR gauges the pace of shoreline change throughout the study period. The average EPR is -10.34 m/year; the calculations also indicate that erosion prevails along the coastline. $70.01\%$ of the transects indicated statistically significant erosion, while only $8.96\%$ indicated statistically significant accretion. The highest negative erosion rate was $-78.64$ m/year at transect ID 540, and the highest accretion rate was $48.09$ m/year at transect ID 351.
- Total number of transects: 1384.
- Average EPR: -10.34 m/year
- Maximum Erosion Rate: Debris depth declined at a mean rate of $-78.64\mathrm{m/year}$ (Transect ID: 540).
- Maximum Accretion Rate: 48.09 m/year (Transect ID: 351)
- Percent of erosional transects: $79.19\%$ (1096 transects)
- Percent of statistically significant erosion: $70.01\%$
- Percent of statistically significant accretion: $8.96\%$
These findings underscore the need for further erosion control efforts because at least half of the coastline is eroding at potentially damaging rates that may be proven to be devastating in the long run to local ecosystems and artificial structures within the coastal areas.
#### 4. (LRR)
The LRR determines the long-term rate of motion of the Shorelines by fitting a least squares regression line through all the shoreline positions exposed by the cross-section marriage. Therefore, these results suggest a general withdrawal of the shoreline with an average likelihood ratio estimate of -7.27m/year.
The average erosion percentage for all the transects is $48.19\%$, of which 14 transects indicate a statistically significant erosion rate ranging from $-0.03$ m/year to $-29.71$ m/year at transect ID 549. However, statistically significant erosion is found in only $11.78\%$ of the transects, the maximum accretion rate being 65.04 meters per year at transect 351.
- Total number of transects: 1384.
- Average LRR: -7.27 m/year
- Maximum Erosion Rate (LRR): Approximately -29.71 m/year erosion rate was estimated at Transect ID: 549.
- Maximum Accretion Rate (LRR): 65.04 m/year (Transect ID: 351)
- Percent of erosional transects: $79.12\%$ (1095 transects)
- Percent of statistically significant erosion: $48.19\%$
- Percent of statistically significant accretion: $11.78\%$
Representations of SCE, NSM, EPR, and LRR with their respective figures depicting the changes along transects are presented in Figure (8). These figures and maps illustrate the changes that occurred throughout the study period and the exact location where these changes appeared.
Figure (9) compares the total eroded area, which covered approximately $47 \, \text{Km}^2$, from 1993 to 2024 against the total accreted area, which was $4 \, \text{Km}^2$. The comparison highlights how erosion plays a major role in determining the morphology of the bay. The great extent of land loss has further emphasized the weaknesses of some of the sectors, especially in the northern and western part, which showed high sensitivity to both tidal forces and wave impacts.
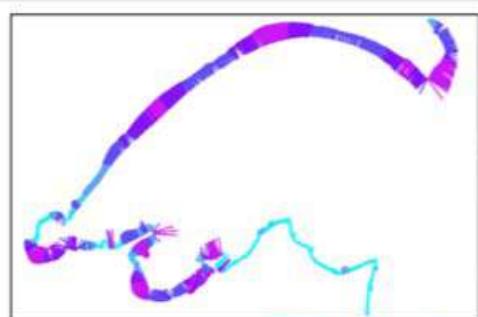
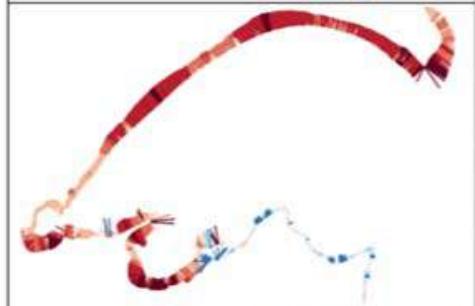

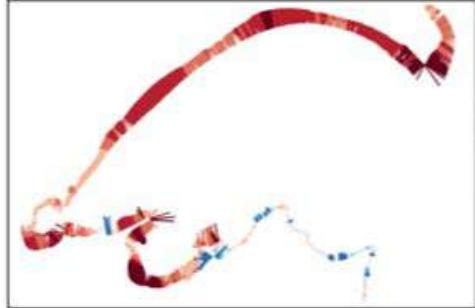
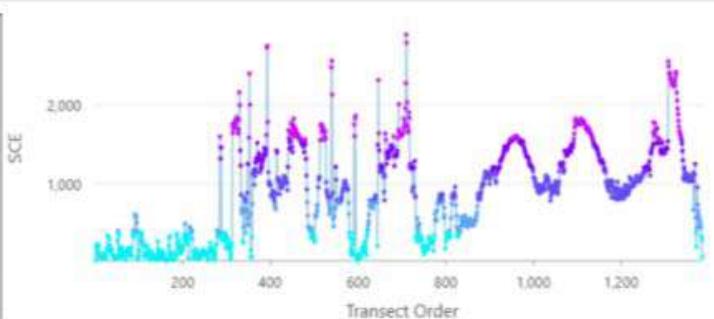
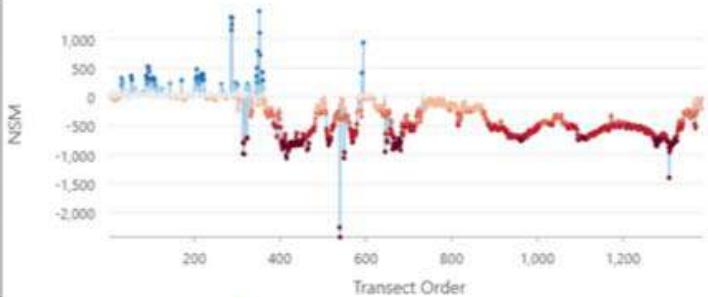
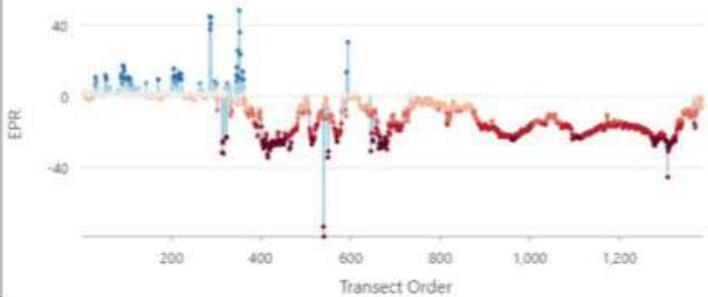
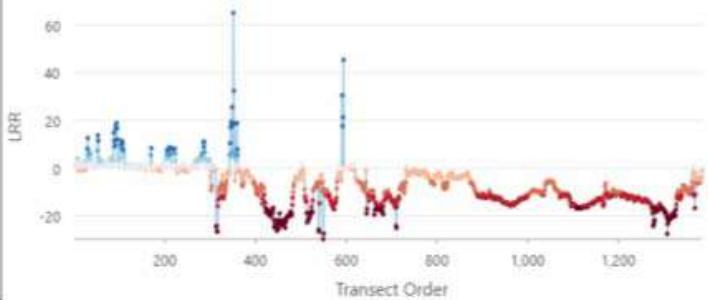
Figure 8: Visualizations of Shoreline Change Metrics for Kuwait Bay, including Shoreline Change Envelope (SCE), Net Shoreline Movement (NSM), End Point Rate (EPR), and Linear Regression Rate (LRR).
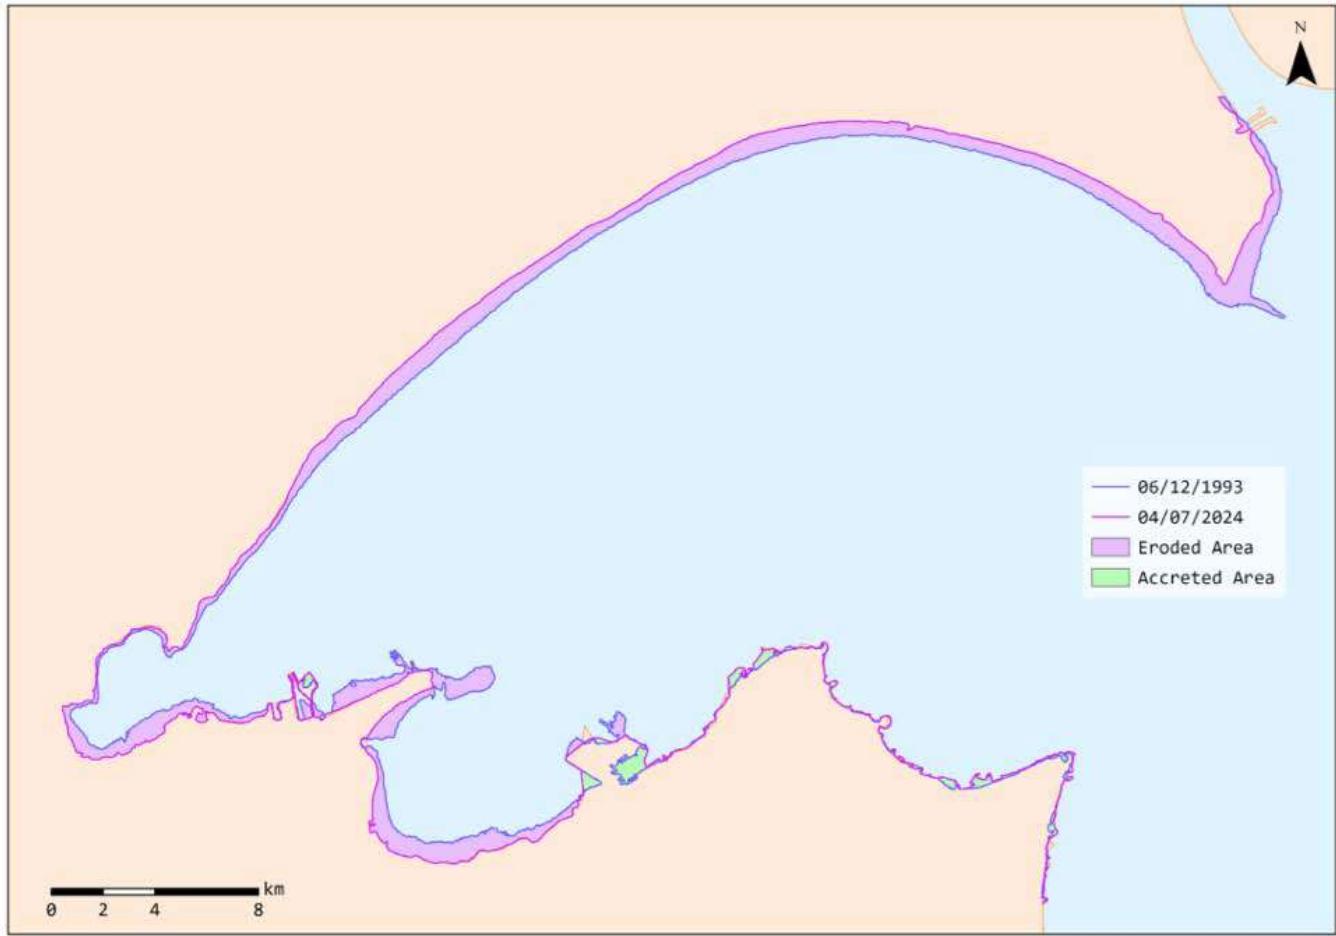
Figure 9: Total eroded and accreted areas between 1993 and 2024.
To identify temporal changes along the shorelines of Kuwait Bay, geographical data sets obtained from remote sensing data were grouped into 5-year periods starting from 1993 to 2023. This approach observed the patterns of erosion and accretion over time and indicated natural processes as well as human intervention on the specific sections of the coastline.
Figure (10) provides a bar chart of the total area of erosion and accretion every 5 years to compare the extent of shoreline response at different time scales. The graph displays extensive slippage between 1993 and 1998, followed by intervals of slippage and buildup, the most significant buildup occurring from 2003 to 2008. The time between 2018-2023 also shows considerable addition and rise, indicating that sedimentation or some other stabilizing factor can occur in a few regions.
Figure (11) illustrates potential and actual site erosion and accretion zones for each 5-year segment to identify the areas of conspicuous variability. Whereas the red color on each map shows the vulnerable or the eroding sectors, the green color reveals the sectors where the coastline is gaining land. It hence acquires the attribute of an accretion zone, all of which visually depicts how different parts of the coastline are changing. Most of the map intervals, especially periods, show comparatively much erosion, particularly on the northern coastal strip, the later periods indicate relatively much accretion on the southern and the western stretch.
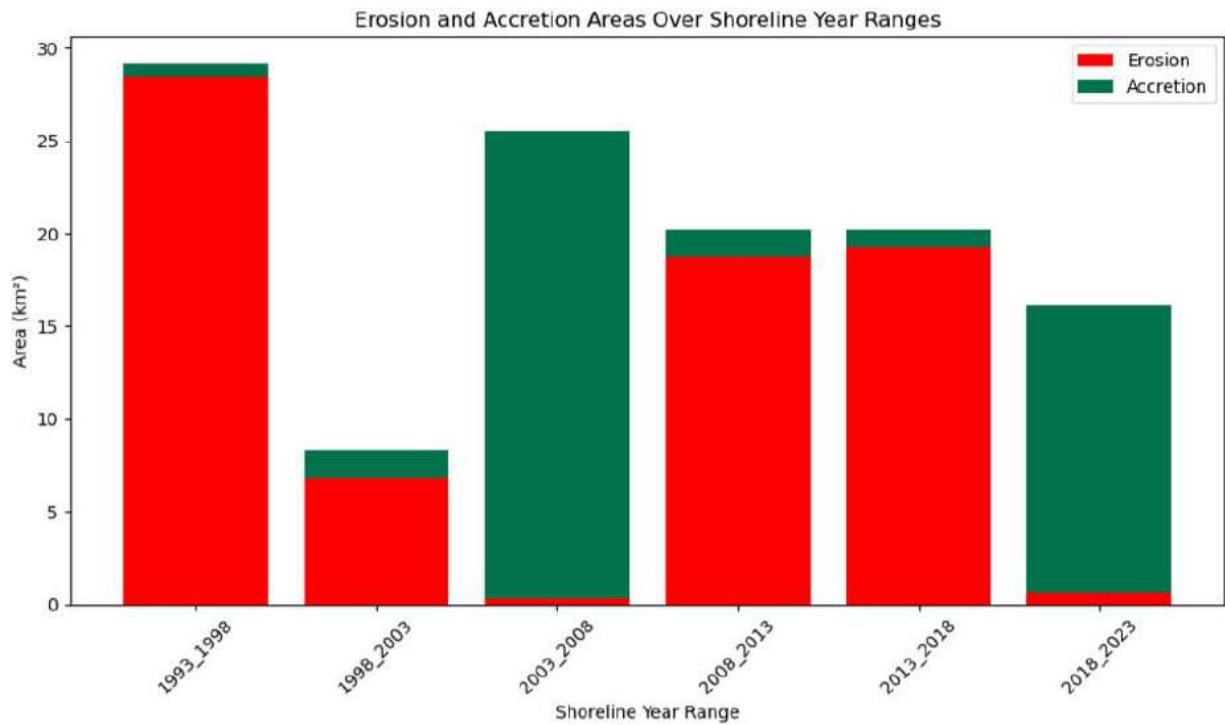
Figure 10: Erosion and accretion areas over 5-year intervals in Kuwait Bay (1993-2023), showing the variation in coastal change across different periods.
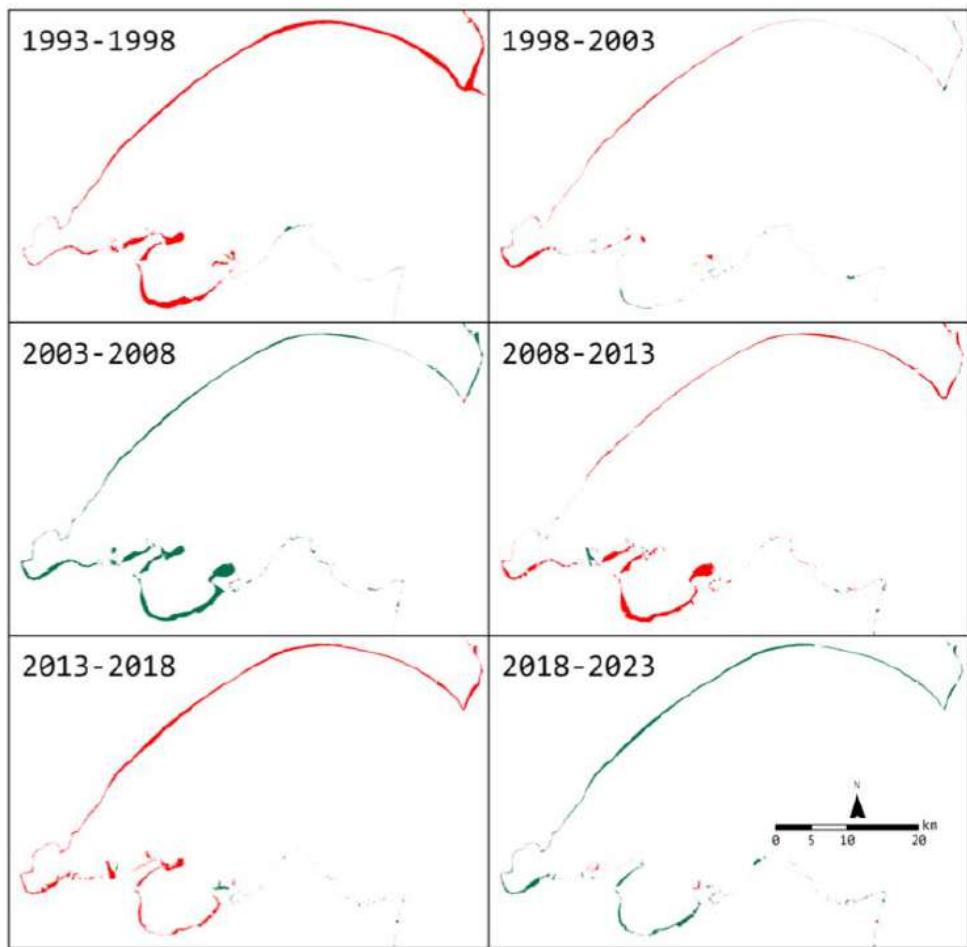
Figure 11: Maps showing spatial distribution of erosion (red) and accretion (green) zones along the Kuwait Bay coastline for each 5-year period from 1993 to 2023.
As shown in Figure (11), erosion predominantly occurred in the northern strip, highlighted in red, and accretion in the southern western parts, highlighted in green. These spatial patterns agree with the findings by Khalaf et al. (1984) [41], who suggest that Kuwait's geomorphology, for example, shallow intertidal flats, plays a pivotal role in the distribution of sediments. High wave energy and the movement of sediments off the shoreline are possible reasons for the northern strip's erosion.
### c) Shoreline Future Prediction (2034 and 2044)
Applying the DSAS, pro forma shoreline positions for 2034 and 2044 were estimated using past beach erosion and accretion rates. Specifically, the following forecast of shorelines shows the further development of the coast and delineates stable and actively eroding beaches. Figure (12) shows the future prediction of 2034 and 2044 shorelines generated from the 1993 to 2024 shorelines change rates.
1. *Eroding Location: Ras Al-Sabiyah, the northern part of Kuwait Bay, specifically Ras Al-Sabiyah, is predicted to experience significant erosion.* The forecasted shorelines for 2034 and 2044 show clear landward movement compared to the 2024 shoreline, indicating that this area is likely to
undergo continued erosion in the future. The historical analysis suggests that Ras Al-Sabiyah has been subject to considerable coastal retreat, and these future projections confirm that the trend is expected to continue, potentially leading to substantial land loss by 2044.
2. *Eroding Location: Jal Az-Zor shoreline: The area in the central western part of Kuwait Bay illustrates the inundation model for the projected shorelines in 2034 and 2044 concerning 2024, indicating shoreline erosion. This area is susceptible to forces like tidal action and sediment loss, which have led to coastal retreats in other parts of the bay; further retreat can thus be expected in the next few decades.
3. Stable Location: Ras Al-Ard: The future scenario of the shorelines of 2034 and 2044 indicated that some parts of the area are experiencing erosion and others experiencing accretion. However, the overall observation shows little to no changes in shoreline in the next two decades. The stability of the region could be due to the morphological shape of the shoreline and the availability of coastal protection measures.
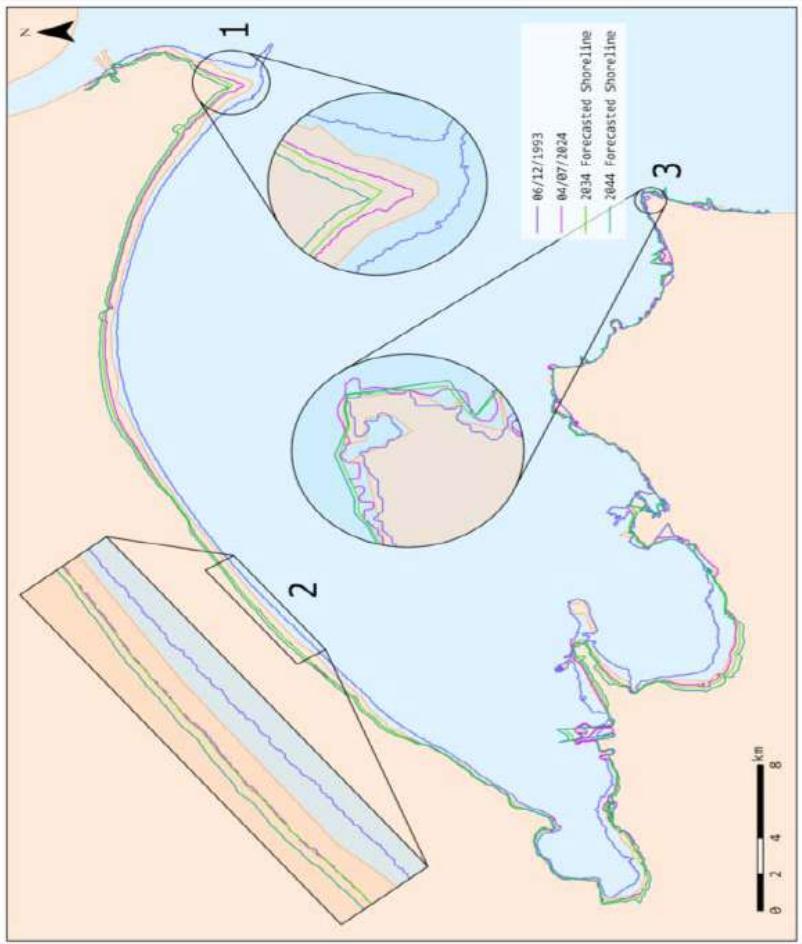
Figure 12: Forecasted shorelines for 2034 and 2044 compared to historical shorelines from 1993 and 2024 in Kuwait Bay.
## IV. CONCLUSIONS
During the period between 1993 and 2024 some parts of the bay, particularly, the northern part witnessed large variation in the shoreline movement. Erosion has dominated along most of the coast, which addresses a crucial problem that would continue on long-term consideration. Ras Al-Sabiyah and Jal Az-Zor retreat is expected to persist through 2044. With such landward retreating in this region the area is encountering a long-term loss of land and possible destruction of the coastal structure.
Continuous retreating of Kuwait Bay's shoreline is highly expected to contribute to habitat loss for the biodiversity characterizing the Bay, affect its coastal ecosystem through changes in sediment dynamics, threaten coastal homes, roads, ports, and coastal utilities leading to costly repairs or relocation, and loss of usable land for development and recreation. Therefore, crucial concern should be focused on providing future erosion control measures.
On the other hand, regions including Ras Al-Ard have remained relatively stable, whereby little changes along the shorelines are expected to occur within the next few decades. Such stability indicates that natural processes like depositional environments of sediments and coastal morphodynamics of Ras Al-Ard provide shelter from strong tidal forces to help stabilize the shoreline. These stable areas might help define "natural," unaltered recovery from coastal change and may require less intervention.
The automated DSAS analysis included transects over Om Al-Namil Island, which submerges during high tide and reappears during low tide. This caused artificially high erosion or accretion values at specific transects (transects 540 and 549). While this is a limitation of the automated methodology, it highlights the challenges of analyzing dynamic coastal systems where tidal variations influence shoreline visibility. Future studies may refine this by manually excluding all the islands close to the mainland and any temporary features that may interfere with this type of analysis.
The southern part of Kuwait Bay shoreline in Shuwaikh Port area, is experiencing a noticeable gain of land (accretion), due to the morphological shape of the shoreline and the tidal currents movement that are redepositing the sediments in this area, in addition to the construction of Shaikh Jaber Causeway and Jaber bridge (Doha Link), which required land reclamation in some parts of the area.
## V. RECOMMENDATIONS
To improve the assessment of shoreline changes, it is highly recommended in future studies to combine detailed datasets and highly predictive models. Moreover, future research should be implemented to assess the actually current-wise and future-wise encountered implications and adverse impacts due to the continuous retreat of the shoreline in environmental, ecological, developmental and socio-economical aspects. Integrated developmental management plans and strategies are highly suggested when conducting any commercial or developmental projects in the study area or similar significant crucial coastal zones taking into consideration their vulnerable and susceptible nature to both natural and anthropogenic activities in order to sustain their unique characteristics.
For future studies, calculating and analyzing the future effects of bridges on the bay's shoreline and the current movement is suggested.
## ACKNOWLEDGMENTS
The authors greatly appreciate the GIS Lab in the Geography Department at Kuwait University for providing ArcMap 10.8.2 and other program licenses that facilitated this research. Additionally, sincere appreciation to Eng. Ebraheem Mahmoud for his invaluable support and technical assistance during this work.
Funding
This research did not require any funding; however, Kuwait University provided all necessary software and applications to complete this work.
Authors' Contribution Statement
Dr. Adeeba Al-Hurban provided and developed the intellectual, comprehensive, geological and geomorphological background of the study site and encouraged Bader Saeed to investigate and predict shoreline changes along Kuwait Bay using GIS and remote sensing tools and techniques. Bader Saeed quantified and analyzed the morphological changes along the shoreline of Kuwait Bay by using the Normalized Difference Water Index (NDWI) and Digital Shoreline Analysis System (DSAS) and estimating the condition of the shoreline in 2034 and 2044 using historical records and analysis to determine possible changes in the morphology of the bay. Both authors contributed to the final version of the manuscript by revising it critically. Both authors are accountable for all aspects of this work and approve of the version to be published.
Conflict of Interest
The authors declare that the research was conducted in the absence of any commercial or financial relationships that could be construed as a potential conflict of interest.
Generating HTML Viewer...
Funding
No external funding was declared for this work.
Conflict of Interest
The authors declare no conflict of interest.
Ethical Approval
No ethics committee approval was required for this article type.
Data Availability
Not applicable for this article.
How to Cite This Article
Dr. Bader Saeed. 2026. \u201cLong Term Shoreline Change Analysis and Forecasting in Kuwait Bay via NDWI and DSAS\u201d. Global Journal of Human-Social Science - B: Geography, Environmental Science & Disaster Management GJHSS-B Volume 25 (GJHSS Volume 25 Issue B1): .
Explore published articles in an immersive Augmented Reality environment. Our platform converts research papers into interactive 3D books, allowing readers to view and interact with content using AR and VR compatible devices.
Your published article is automatically converted into a realistic 3D book. Flip through pages and read research papers in a more engaging and interactive format.
Integrating remote sensing and geographic information systems (GIS) can be applied through shoreline monitoring. Coastal environments undergo both natural and anthropogenic processes that drive shoreline changes, making them highly dynamic systems. Kuwait Bay is characterized by its shallow waters and broad intertidal flats, where the tidal activities, wave action, and sediment transportation influence their morphological changes and contribute to critical socio-economic and environmental impacts. This study aims to quantify, calculate, and analyze the metrics of morphological shoreline changes along Kuwait Bay during and to predict the future shoreline position during 2034 and 2044. Four Landsat sensors (5, 7, 8, and 9) derived from the Google Earth Engine (GEE) platform were used for data acquisition. Shoreline changes were analyzed using the DSAS 5.0 extension in ArcMap 10.4, employing metrics such as SCE, NSM, EPR, and LRR, ArcGIS Pro, and Python (ArcPy library) for shoreline extraction and calculating (NDWI). The highest SCE value was 2889.63 m. As for the NSM, the maximum erosion exceeded that of accretion (2432.94 m and 1482.08 m, respectively). The EPR was 78.64 m/y -1 for erosion and 48.09 m/y -1 for accretion.
Our website is actively being updated, and changes may occur frequently. Please clear your browser cache if needed. For feedback or error reporting, please email [email protected]
Thank you for connecting with us. We will respond to you shortly.