I. INTRODUCTION
A man has two ears (acoustical receivers), which are not very close. When a cicada is singing, the two ears should hear high similar sounds, which makes the man feel that there is only one cicada singing. When many cicadas are singing, the two ears should listen to low similar sounds, which makes the man think that there are many cicadas singing. An interesting question is: what will happen if the distance between two ears becomes shorter or longer?
Gravitational waves have been observed at two stations (H and L stations) . Our studies (unpublished) show that gravitational waves received at two stations are highly similar. Such high similarity can verify the existence of the gravitational wave and the uniqueness of the gravitational wave origin. One should note that the distance between gravitational wave receivers (though several thousand miles) is very short compared to the remote distance of gravitational wave propagation.
When dealing with the seismic wave data (recorded by one seismometer) caused by the two consecutive big blasts at Tianjin China in 2015, we found that the time-frequency similarity of the two seismic waves reached (3). Such a similarity is high enough to make us sure that, only according to the seismic wave data, the two blasts took place at the same site even though the equivalent magnitudes of the two blasts are several times different. Here, we emphasize that high similarity can help us verify the uniqueness of wave origin. So, one can imagine: would low similarity means the multi-origin of waves? Our answer to this question is nearly positive, concluded by the acoustical experiments in this study.
The waves, such as acoustical, electromagnetic, seismic, and gravitational ones, if
Author σ Φ v ξ; State Key Laboratory of Geodesy and Earth's Dynamics, Innovation Academy for Precision Measurement Science and Technology, Chinese Academy of Sciences; Wuhan 430077, China.
emanated from the same source, might show similarity to some degree, no matter what the wave transmission medium is. This study will show that the similarity varies with the distance between two wave receivers. In Section 2, a similarity principle is given. Section 3 defines the similarity function mathematically. We verify the similarity principle by the acoustical experiments in Section 4. Finally, we will have some discussions.
II. SIMILARITY PRINCIPLE
The waves emanated from the same source are similar, as long as two wave receivers are close enough. The closer the receivers are, the more similar the received waves are.
When a proper distance between the wave receivers is fixed, the high similarity of received waves means a unique origin of the waves. In contrast, the low similarity means multi-origins of the waves.
III. MATHEMATICAL DEFINITION OF SIMILARITY
There are many ways to measure the similarity of two variables . Most reflect the degree of linearity, like the Pearson correlation coefficient , where a high value figured out means the two variables are linear while a low value means nonlinear. Based on the condition, we will choose a suitable measurement to calculate the similarity . The similarity is a tool, by which we can research kinds of scientific problems. In the principal component analysis, the principal component can be extracted by the correlation coefficient which could be regarded as similarity . The similarity can be used to analyze two images for spatial concordance , and also used in Complex Network Graphs .
Here, similarity refers to the degree of limit correlation of the concerned oscillating information in two time data sets, and its value interval is . The similarity makes it feasible to estimate the time delay between the two datasets. If the two datasets are not disturbed by noise, then the similarity is determined by a formula similar to the correlation coefficient's, by which the corresponding delay estimation can be worked out directly.
Generally, assuming that there are two closely separated observation stations, respectively recording the infinite oscillation time datasets and , the similarity between the oscillating information in the two datasets can be measured by the following equation.
This function is called the similarity function, where represents an integral time period, showing the length of the information concerned; means the period translates rightly by time; denotes the delay time index; denotes a time interval.
We call
as Similarity Coefficient between the concerned oscillating information around/time, if
Here, can be regarded as the delay of the oscillating information in to that in . The similarity coefficient takes the positive value when the oscillating information is positive phase correlated, and it takes the negative value when the oscillating information is reverse-phase correlated.
If time series and are disturbed by noises, the similarity function (1) can be substituted by
where denotes a normal time-frequency transform (NTFT) , in which and denote time and frequency respectively; Re denotes the real part. S denotes the time-frequency area concerned; denotes area S translating rightly by time.
IV. ACOUSTICAL EXPERIMENTS
To verify the above similarity principle, two acoustical experiments have been done in our work. The first experiment is one sound source test, and the other three sound sources test. We use two microphones to receive the sounds. In each experiment, a series of distances (0.008m, 0.2m, 0.415m, 1.5m, and 4.3m.) between two microphones have been set, reflecting how the Similarity Coefficient varies with the distance. Every recording time series lasts about 30 seconds with a sampling frequency 128KHz.
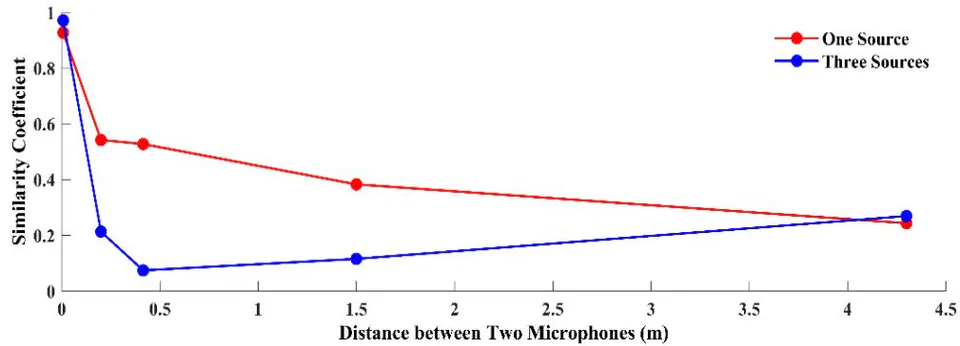
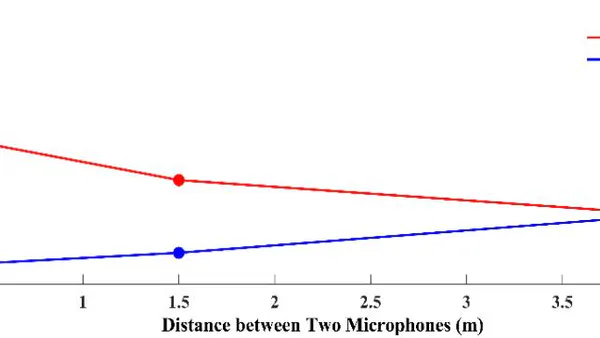
Fig.1 shows the result of the two experiments. Each line shows the Similarity Coefficient varies over the distance between two microphones. In fact, the Similarity Coefficient is averaged along the time. The red line corresponds to one source and the blue line to three sources. Figure 1 shows that the Similarity Coefficient decreases with the increasing distance based on the red line. The blue line shows some difference in this phenomenon. When the distance is close, its trend is the same compared to the red line. When the distance is far, the Similarity Coefficient shows a little increase. We conjecture it may be caused by the position distribution of two microphones and three sources, which requires further research. However, despite the close or far distance between two microphones, the Similarity Coefficient is larger than 0.9 in an enough close distance (it can be in our experiments). On the contrary, less than 0.3 in a far distance . It can be concluded that if the distance between two microphones is not close enough, the Similarity Coefficient is down sharply. The two acoustical experiments are sufficient to verify Similarity Principle I that the closer distance between the two receivers, the higher similarity of the two received waves.
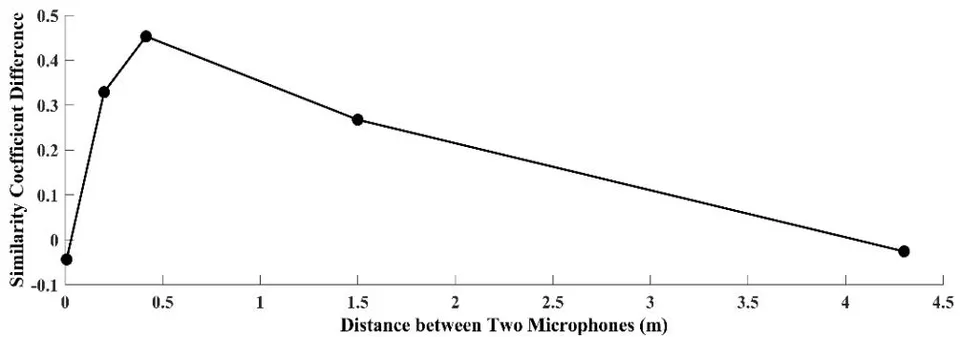
Comparing the difference in the Similarity Coefficient in two experiments at a distance between two microphones, the result is shown in Figure 2. The difference approximates 0, which indicates the two degrees of similarity are almost the same, then is significant, and lastly goes back to be near-zero value. It suggests an interval of distance in which the Similarity Coefficient is significantly different for one source against three sources. This case agrees with Similarity Principle II. A suitable distance (0.2m) between two microphones can be found, where the Similarity Coefficient is high in one source but low in three sources. According to the principle, it is possible to judge whether there is only one source or two more by making two receivers be arranged at a proper distance.
V. DISCUSSION
This study shows a physical principle, the similarity principle, verified by acoustical experiments. In the traditional sense, waves emanated from the same source should be highly similar, and similarity should be little related to the distance between two receivers. However, Similarity Principle I negates this traditional sense. Similarity Principle II suggests that the distance between man's two ears should result from evolution. Such a distance is proper for a man to judge whether the sounds come from the same source or not.