I. INTRODUCTION
Water accessibility is the proportion of the population with reliable improved drinking water. Such improved sources include piped water into a residence, public standpipes in a neighbourhood, boreholes, protected well, protected springs and rainwater harvesting. Climate change affects these water sources in multiple ways, with complex spatio-temporal patterns, feedback and interactions between physical and human processes (Bates et al., 2008). These effects are already adding challenges to sustainable water resources management, which are already under severe pressure in many regions of the world and are subject to high climate variability and extreme weather events (Stewart et al., 2020; Baninla et al., 2022). The main effects of climate change on water resources include accessibility, availability, quality and quantity of water for basic human needs (water security), threatening the effective enjoyment of the human rights to water and sanitation. Although the effects can be highly individual at the local scale (Intergovernmental Panel on Climate Change-IPCC, 2019; Tanwie et al., 2022; Baninla et al., 2022), current trends and future projections indicate major shifts in climate, and more extreme weather events in many parts of the world (IPCC, 2014). It is therefore paramount that water resources managers consider the potential impacts of a changing climate when planning for water resources development.
This study bridges some methodological gaps identified in previous works like Zotem and Nfor (2020) who analysed rainfall variability and quantity of water supply in Bamenda I. These authors used a household questionnaire, Standardized Precipitation Index (SPI) and Seasonality Index (SI), but did not assess water accessibility through springs, streams, the spatial distribution of public taps as well as basics such as distances covered by households to the nearest water points. Although they used major climatic indices such as SPI and SI, they failed to show detailed decadal variations and consequences on water supply. In other studies, Tume (2019, 2021a and b, 2022 a and b) used SPI and SI respectively to assess the vulnerability of water resources to climate variability on the Bui Plateau but failed to assess the state of other water sources on which households rely on springs, streams, wells and boreholes. Chiaga et al., (2019) examined watershed management and the sustainability of the urban water supply in Bamenda. The authors revealed that the Bamendankwe Highland is the main watershed of Mezam Division of the North West Region of Cameroon. These researchers, however, did not take into account the role of climate change in water resources dynamics in the city of Bamenda. Furthermore, Wirba et al., (2020) explored water management practices and sustainability implications in the Bamenda metropolis. Although the study covered the entire city of Bamenda, only two neighbourhoods were selected in the Bamenda III municipality, that is, Mile IV and Mile VI, where 40 questionnaires were administered. Given that Bamenda
III is the second most populated municipality in the metropolis, with 55 neighbourhoods and a population of over 230,000 inhabitants, a sample of 40 was not representative enough. This paper, therefore, attempts to blend the role of climate change on water accessibility in Bamenda III, using a household questionnaire and a detailed analysis of climatic data.
Local hydrological changes induced by climate change imply major risks for society, not only directly through alterations in the hydro-meteorological processes that govern the water cycle, but also indirectly through risks for energy production, food security, economic development and social inequalities, among others (Figure 1).
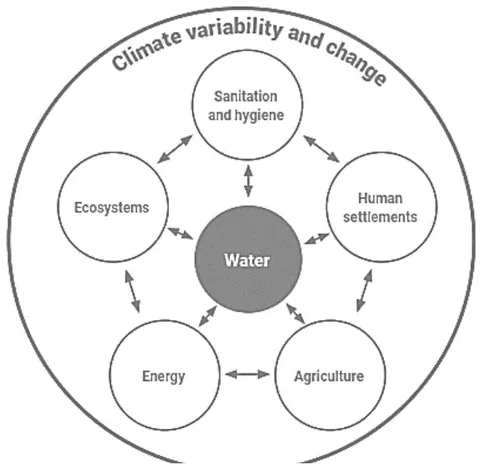
Climate change adaptation and mitigation through water management is therefore critical to sustainable development, and necessary to achieve the 2030 Agenda for Sustainable Development, the Paris Agreement and the Sendai Framework for Disaster Risk Reduction. This paper falls within the context of the global development agenda, with an overarching emphasis on some Sustainable Development Goals (SDGs), namely SDG-6 (ensure availability and sustainable management of water and sanitation for all), SDG-11 (sustainable cities and communities) and SDG-13 (take urgent action to combat climate change and its impacts). The impacts of climate change on urban and semi-urban water systems include higher temperatures, reduced precipitation and recurrent meteorological and hydrological droughts on the one hand, and increasing heavy precipitation and flooding events on the other (Smith et al., 2019). It is precisely these extremes that make the planning of urban space and the provision of infrastructure so difficult (Tume, 2022). Urban water resilience goes way beyond the traditional city boundaries. In cases where water supplies rely on distant watersheds, planning needs to look well beyond the city's boundaries and consider the long-term impacts of urban expansion on distant freshwater ecosystems and the local communities that also rely on them (World Bank, 2011).
II. STUDY AREA AND METHODOLOGY
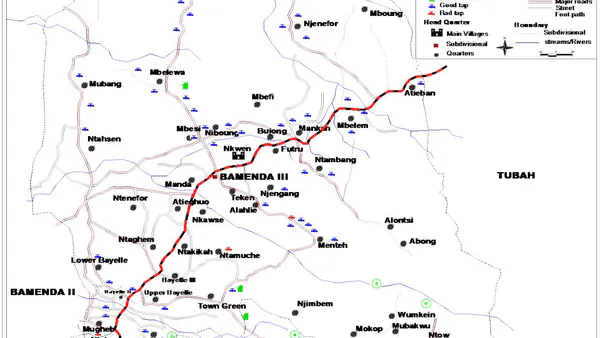
The Bamenda III Municipality is found in Mezam Division of the Northwest Region of Cameroon, located between Longitude and East of the Greenwich Meridian and Latitude and North of the Equator (Figure 2).
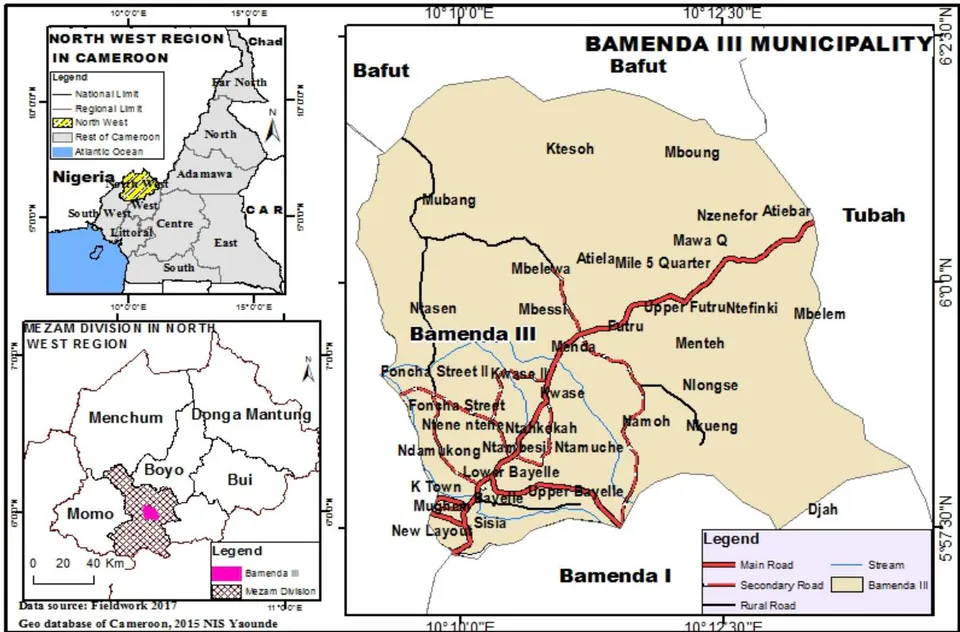
The area has boundaries with Bafut to the North, Tubah to the West, Bamenda II to the East and Bamenda I to the South. Characteristic features of Bamenda III municipality include hills ranging from steep to gentle slopes, but much of the area especially its urban site is a low land area lying in the flood plain of River Mezam and below the Bamendakwe escarpment at Up-Station. Features in the lowland include wetlands and many streams with altitudes ranging from 1,200-1,500m above sea level. There are two main villages, Nkwen with 46 neighbourhoods and Ndzah with 9 neighbourhoods (Tume, 2021 b).
Primary data was in the form of a household questionnaire, which was administered in 10 neighbourhoods in Nkwen and two neighbourhoods in Ndzah. A total of 269 questionnaires were administered
(Table 1). The choice of these neighbourhoods is because the spatial distribution represents all of the study areas. In addition, the 12 neighbourhoods in both villages represent of the surface area of the study and of the total population. Secondary data was rainfall, collected from the Regional Meteorological Service at the Northwest Delegation of Transport for a period of 56 years (1963-2019). Some current literature on climate and water resources was also appreciated from UN-Water Development Reports and journals. The household questionnaire was treated in the Statistical Package for Social Sciences (SPSS) Version 20. A cross-tabulation of various variables under treatment were established and exported into Microsoft Excel 2016.
| Village | Neighbourhood | Questionnaires administered |
| Nkwen | Atielah-Mbelewa | 24 |
| Atiesu-Mbessi | 15 | |
| Bayelle I | 22 | |
| Bunjong-Mambu | 19 | |
| Futru I | 31 | |
| Lower Menteh | 9 | |
| Manka-Mambu | 34 | |
| Nchang-Ntambang | 44 | |
| Sisia I | 11 | |
| Mubang | 20 | |
| Ndzah | Mokop | 13 |
| Terrekoh | 27 | |
| Total | 269 |
This entailed calculation of percentages and the establishment of tables and charts. The climatic data were treated in Microsoft Excel 2016, where monthly and inter-annual graphs were generated. Rainfall data were further analysed using the Standardized Precipitation Index (SPI), a tool that was developed primarily for defining and monitoring drought. It allows an analyst to determine the rarity of a drought at a given time scale (temporal resolution) of interest for any rainfall station with historic data. It can also be used to determine periods of anomalously wet events. Conceptually, SPI is the number of standard deviations by which the precipitation values recorded for a location would differ from the mean over certain periods. In statistical terms, the SPI is equivalent to the Z-score.
; Where: -score expresses the score's distance from the mean ( ) in standard deviation ( ) units. Statistically, the SPI is based on the cumulative probability of a given rainfall event occurring at a geographic location (Table 2).
| SPI Value | Category | Probability (%) | Freq. in 100 years | Severity of event |
| >2.00 | Extreme wet | 2.3 | 100 | 1 in 1 year |
| 1.5 to 1.99 | Severely wet | 4.4 | 70 | 1 in 1.1 years |
| 1.00 to 1.49 | Moderately wet | 9.2 | 50 | 1 in 1.3 years |
| 0 to 0.99 | Mildly Wet | 34.1 | 45 | 1 in 1.5 years |
| -0.1 to -0.99 | Mild dryness | 34.1 | 33 | 1 in 3 years |
| -1.00 to -1.49 | Moderate dryness | 9.2 | 10 | 1 in 10 years |
| -1.50 to -1.99 | Severe dryness | 4.4 | 5 | 1 in 20 years |
| <-2 | Extreme dryness | 2.3 | 2.5 | 1 in 50 years |
SPI was used to assess the occurrence of drought incidents. All anomaly graphs generated from the data were fitted with trend lines and linear equations. The trend lines indicate an increase or decrease in the elements under study. Other measures of central tendencies for rainfall included Standard Deviation and Coefficient of Variation (CV). CV is calculated thus:
III. RESULTS
The results for this paper are sub-divided into climate variability and change, as well as the impact of climate variability and change on water accessibility.
a) Climate Variability and Change
Climate change is the statistical variations in the properties of the climate system such as changes in temperatures, precipitation, and other climatic elements due to natural or human drivers over a long period. Climate change could drastically alter the distribution and quality of natural resources, thereby adversely affecting the livelihood security of the people (IPCC, 2018). The population of Bamenda III perceive that the magnitude of climate variability is high (Figure 3).
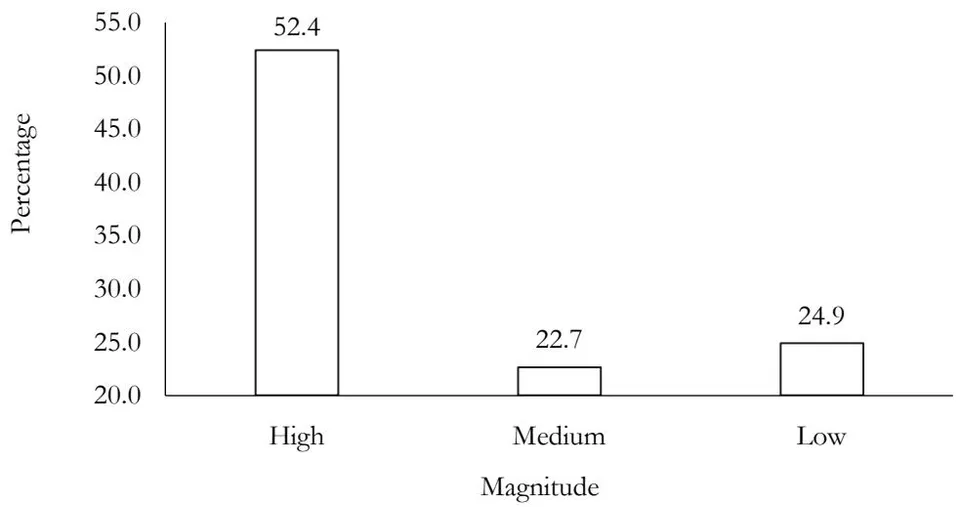
Field data revealed that of the population perceived a high magnitude, while perceived a low magnitude and perceived that the magnitude is moderate. Sources of climate information are diverse. The majority of the people receive climate-related information from television , followed by seminars , radio , government agencies and the internet . This proves that the population of Bamenda is well informed about changing climatic conditions as none of the field responses did not indicate that they do not receive any climate-related information.
b) Actual climate variability and change
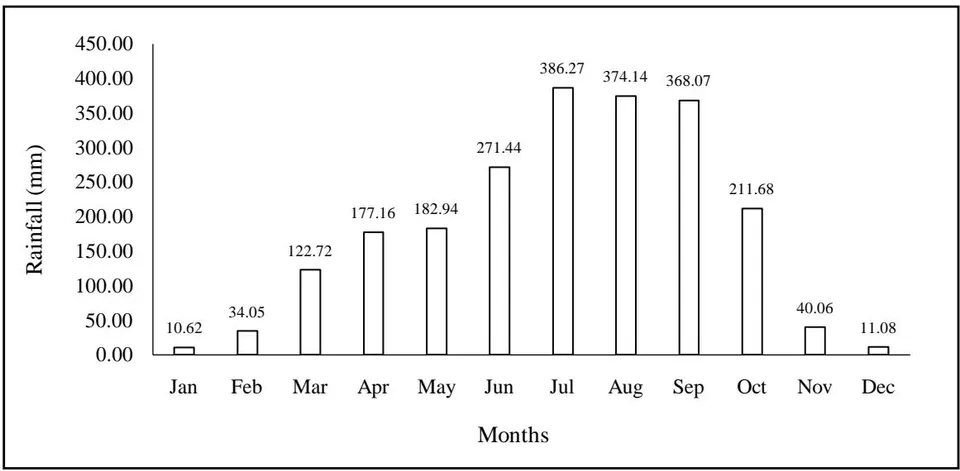
Rainfall in Bamenda increases from the onset of the wet season to a peak in July to September and gradually drops as the dry season sets in (Figure 4).
Data source: Regional Meteorological Service, Northwest
The lowest rainfall is recorded from December to March. To assess how much rainfall has changed, the data were grouped into 3-month segments (Table 3).
| Months | Decadal mean rainfall (mm) | |||||
| 1963-1972 | 1973-1982 | 1983-1992 | 1993-2002 | 2003-2012 | 2013-2019 | |
| DJF | 25.07 | 19.85 | 16.5 | 9.7 | 17.71 | 24.5 |
| MAM | 184.17 | 161.78 | 158.82 | 149.1 | 138.9 | 178.01 |
| JJA | 387.6 | 361.9 | 364.2 | 356.4 | 325.9 | 235.06 |
| SON | 238.81 | 240.9 | 202.5 | 210.9 | 195.97 | 126.5 |
| Mean | 208.91 | 196.11 | 185.51 | 181.53 | 169.62 | 141.02 |
| Change | 26.39 | 13.59 | 2.98 | -1.00 | -12.90 | -41.50 |
From 1963-1972, rainfall had an excess of 26.39 mm and has been declining over time. Between 1973-1982, the rainfall dropped by 13.59 mm and 2.98 mm from 1983-1992. Since 1993, Bamenda has witnessed rainfall deficits (-1 mm from 1993-2002, -12.9 mm from 2003-2012 and -41.5 mm from 2013-2019). The average rainfall decline from 1963-2019 is -2.07 mm. This proves that the climate is changing and is affirmed by the declining inter-annual rainfall trend (Figure 5).
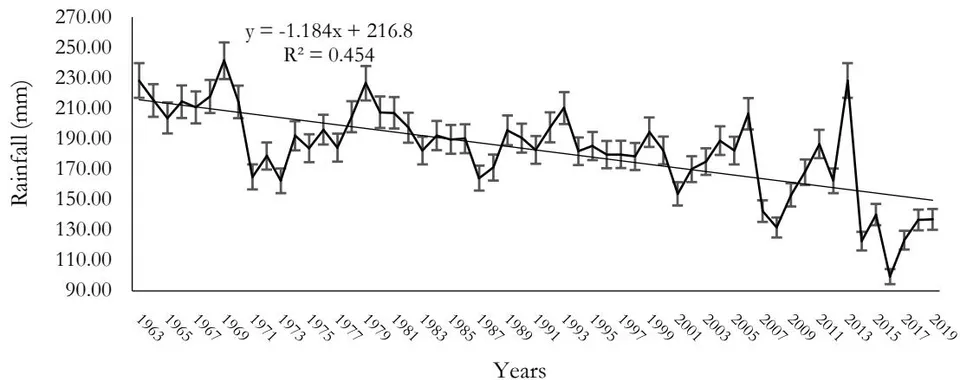
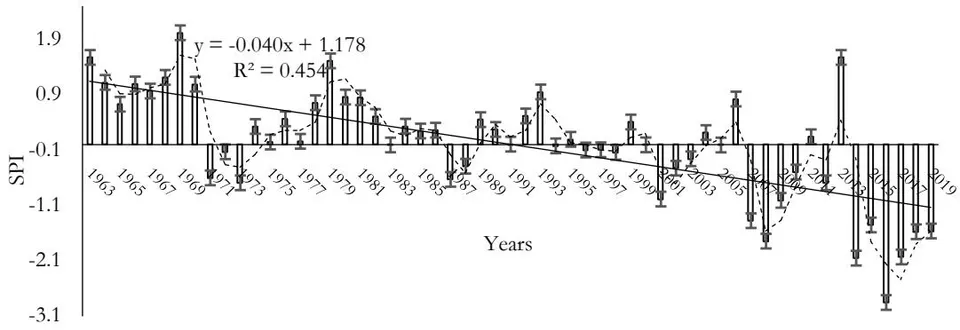
The mean annual rainfall for Bamenda is 182.52 mm, with a Standard Deviation (SD) of 29.16 and a Coefficient of Variation (CV) of (reliable). The climatic index used in assessing climate variability and change for this study is SPI. The SPI inter-annual pattern is the same as the inter-annual rainfall, with the same Coefficient of Determination of 0.4548 (45.48%) (Figure 6).
Additional understandings of rainfall change over Bamenda are better presented through decadal
SPI trends. From 1963-1972, the SPI trend decreased above the average (Figure 7).
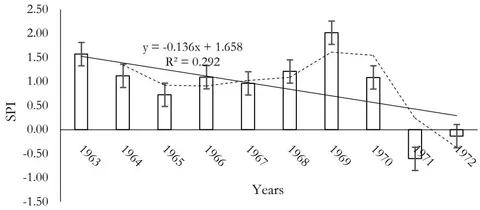
The SPI episodes were 1963 (1.57-moderately wet), 1964 (1.12-moderately wet), 1965 (0.73-mildly wet), 1966 (1.09-moderately wet), 1967 (0.96-mildly wet), 1968 (1.21 (moderately wet), 1969 (2.02-extreme wet), 1970 (1.09-moderately wet), 1971 (-0.6-mild dryness) and 1972 (-0.13-mild dryness). Eight out of the ten years of this decade were wet years, except 1971 and 1972. The dry years continued till 1973. The decade 1973-1982 experienced an increasing SPI trend, with nine wet years out of ten (Figure 8).
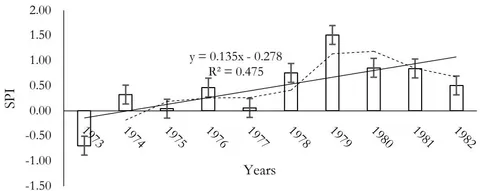
The SPI episodes were 1973 (-0.69-mild dryness), 1974 (0.32-mildly wet), 1975 (0.04-mildly wet), 1976 (0.46-mildly wet), 1977 (0.06-mildly wet), 1978 (0.75-mildly wet), 1979 (1.51-moderately wet), 1980
(0.86-mildly wet), 1981 (0.84-mildly wet) and 1982 (0.51-mildly wet). The SPI trend increased above the average from 1983 to 1992 (Figure 9).
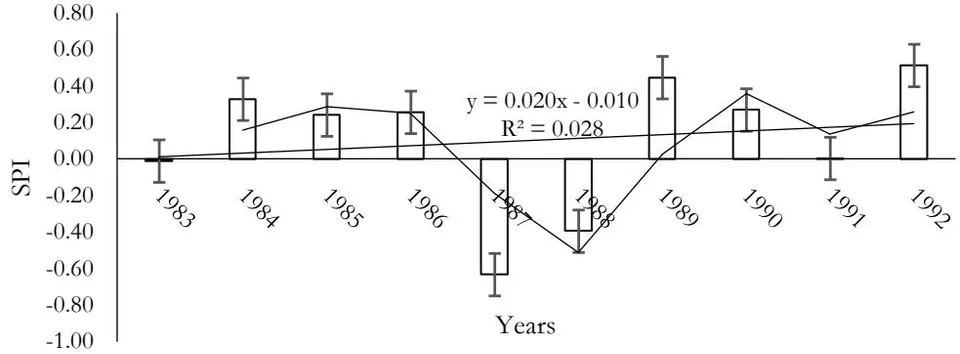
In 1983, the SPI value was (-0.01-mild dryness), 1984 (0.33-mildly wet), 1985 (0.24-mildly wet), 1986 (0.26-mildly wet), 1987 (-0.63-mild dryness), 1988 (-0.39-mild dryness), 1989 (0.45-mildly wet), 1990 (0.27- mildly wet), 1991 (0-mildly wet) and 1992 (0.51-mildly wet). The 1993 to 2002 period can be seen as a dry decade, with a decreasing SPI trend and seven years of negative SPI (Figure 10).
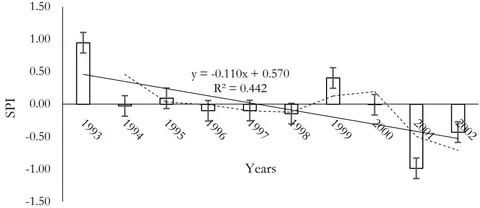
The SPI episodes were 0.95 (mildly wet) in 1993, 1994 (-0.03-mild dryness), 1995 (0.09-mildly wet), 1996 (-0.10-mild dryness), 1997 (-0.10-mild dryness), 1998 (-0.14-mild dryness), 1999 (0.4-mildly wet), 2000 (-0.01-mild dryness), 2001 (-0.99-mild dryness) and 2002 (-0.43-mild dryness). The 2003 to 2012 period was also another dry decade, with a decreasing SPI below the average (Figure 11).
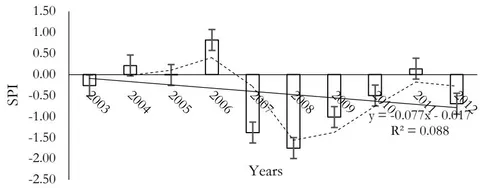
The SPI values were, 2003 (-0.26-mild dryness), 2004 (0.21-mildly dry), 2005 (-0.01-mild dryness), 2006 (0.82-mildly wet), 2007 (-1.38-moderate dryness), 2008 (-1.75-severe dryness), 2009 (-1.01-moderate dryness),
2010 (-0.50-mild dryness), 2011 (0.14-mild dryness and 2012 (-0.69-mild dryness). From 2013 to 2019, the SPI continued to decline below the average (Figure 12). It is also another dry decade.
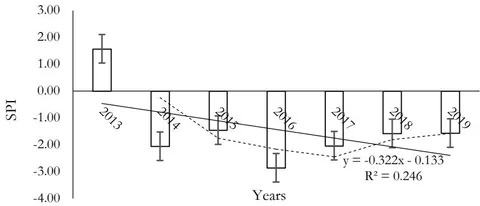
The SPI incidents were, 2013 (1.57-severely wet), 2014 (-2.06-extreme dryness), 2015 (-1.46-moderate dryness), 2016 (-2.86-extreme dryness), 2017 (-2.03-extreme dryness), 2018 (-1.58-severe dryness) and 2019 (-1.56-severe dryness). Rainfall and SPI characteristics for Bamenda can be summarized (Table 4).
| Period | MAR (mm) | SD | CV (%) | Mean SPI | SPI class | R2 | Trend | Reliability |
| 1963-1972 | 208.92 | 22.34 | 10.69 | 0.91 | Mildly wet | 0.2927 | Decreasing | Reliable |
| 1973-1982 | 196.1 | 17.33 | 8.84 | 0.47 | Mildly wet | 0.4752 | Increasing | Reliable |
| 1983-1992 | 185.52 | 10.73 | 5.78 | 0.1 | Mildly wet | 0.0286 | Increasing | Reliable |
| 1993-2002 | 181.51 | 14.61 | 8.05 | -0.03 | Mild dryness | 0.4424 | Decreasing below average | Reliable |
| 2003-2012 | 169.62 | 22.89 | 13.49 | -0.44 | Mild dryness | 0.0886 | Decreasing below average | Reliable |
| 2013-2019 | 141 | 40.95 | 29.04 | -1.42 | Severe dryness | 0.246 | Decreasing below average | Unreliable |
| Mean | 180.445 | 21.50 | 12.65 | -0.07 | Mild dryness | 0.2623 | Decreasing | Reliable |
Rainfall was reliable from 1963 to 2012. Since 2013, dry episodes have been recurrent with a mean SPI of -1.42 and an unreliable CV of . These characteristics show that rainfall has been deficient, thereby resulting in water scarcity. In all, the 1963-2019 period was characterised by 1 episode of extreme wet conditions (1969), 2 severely wet (1963, 2003), 5 moderately wet (1964, 1966, 1968, 1970, 1979), 23 mildly wet (1965, 1967, 1974, 1975, 1976, 1977, 1978, 1980, 1981, 1982, 1984, 1985, 1986, 1989, 1990, 1991, 1992, 1993, 1995, 1999, 2004, 2006, 2011), 16 mild
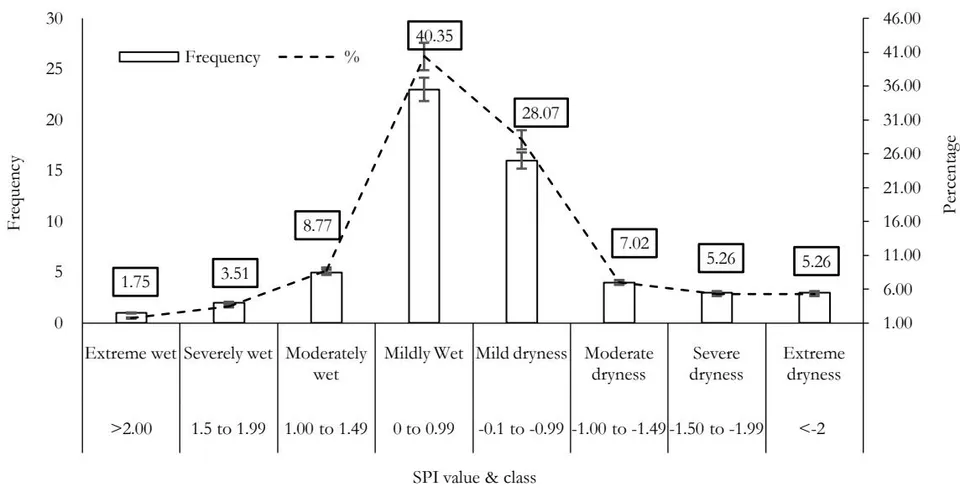
The overall mean SPI for the period under study is -0.07 (mild dryness) and a mean CV of (reliable).
c) Domestic Water Accessibility
Sources of water in Bamenda III are public taps, streams, private taps, boreholes, protected springs, protected wells and unprotected springs (Table 5, Figure 14). The sampled neighbourhoods have at least one of the water sources, meaning that water is relatively accessible.
| Neighbourhoods | Public tap | Stream | Private tap | Borehole | Protected spring | Protected well | Unprotected spring | |||||||
| F | % | F | % | F | % | F | % | F | % | F | % | F | % | |
| Atielah-Mbelewa | 6 | 12.50 | 5 | 10.87 | 6 | 6.12 | 2 | 10.00 | 3 | 16.67 | 1 | 5.88 | 1 | 4.55 |
| Atiesu-Mbessi | 1 | 2.08 | 2 | 4.35 | 5 | 5.10 | 3 | 15.00 | 1 | 5.56 | 2 | 11.76 | 1 | 4.55 |
| Bayelle | 4 | 8.33 | 3 | 6.52 | 8 | 8.16 | 1 | 5.00 | 1 | 5.56 | 1 | 5.88 | 4 | 18.18 |
| Bunjong-Mambu | 6 | 12.50 | 1 | 2.17 | 8 | 8.16 | 1 | 5.00 | 1 | 5.56 | 1 | 5.88 | 1 | 4.55 |
| Futru I | 5 | 10.42 | 9 | 19.57 | 12 | 12.24 | 1 | 5.00 | 1 | 5.56 | 2 | 11.76 | 1 | 4.55 |
| Lower Munteh | 1 | 2.08 | 2 | 4.35 | 2 | 2.04 | 1 | 5.00 | 1 | 5.56 | 1 | 5.88 | 1 | 4.55 |
| Manka-Mambu | 10 | 20.83 | 3 | 6.52 | 14 | 14.29 | 3 | 15.00 | 1 | 5.56 | 2 | 11.76 | 1 | 4.55 |
| Nchang-Ntambang | 8 | 16.67 | 6 | 13.04 | 22 | 22.45 | 2 | 10.00 | 2 | 11.11 | 2 | 11.76 | 2 | 9.09 |
| Sisia I | 1 | 2.08 | 2 | 4.35 | 1 | 1.02 | 1 | 5.00 | 1 | 5.56 | 1 | 5.88 | 4 | 18.18 |
| Mubang | 3 | 6.25 | 8 | 17.39 | 5 | 5.10 | 1 | 5.00 | 1 | 5.56 | 1 | 5.88 | 1 | 4.55 |
| Mokop | 1 | 2.08 | 2 | 4.35 | 4 | 4.08 | 2 | 10.00 | 1 | 5.56 | 1 | 5.88 | 2 | 9.09 |
| Terrekoh | 2 | 4.17 | 3 | 6.52 | 11 | 11.22 | 2 | 10.00 | 4 | 22.22 | 2 | 11.76 | 3 | 13.64 |
| Total | 48 | 100 | 46 | 100 | 98 | 100 | 20 | 100 | 18 | 100 | 17 | 100 | 22 | 100.00 |
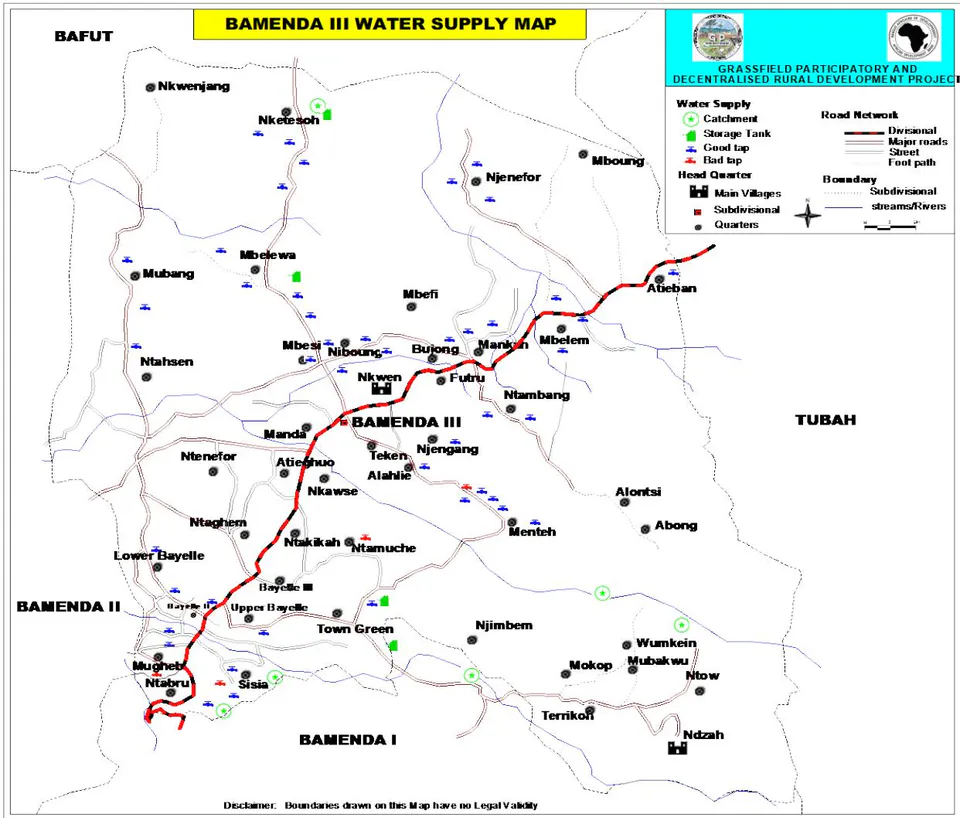
Source: Bamenda III Council, 2012
The most accessible water sources are public taps, streams, private taps in homes and unprotected springs (at watersheds). The population gets water through head portage, wheelbarrows, cars and private water lines in households (Table 6).
| Neighbourhoods | Head | Wheelbarrow | Car | Private water line | ||||
| F | % | F | % | F | % | F | % | |
| Atielah-Mbelewa | 10 | 6.54 | 4 | 21.05 | 3 | 7.89 | 7 | 11.86 |
| Atiesu-Mbessi | 11 | 7.19 | 0 | 0.00 | 1 | 2.63 | 3 | 5.08 |
| Bayelle | 13 | 8.50 | 1 | 5.26 | 2 | 5.26 | 6 | 10.17 |
| Bunjong-Mambu | 9 | 5.88 | 2 | 10.53 | 4 | 10.53 | 4 | 6.78 |
| Futru I | 25 | 16.34 | 0 | 0.00 | 5 | 13.16 | 1 | 1.69 |
| Lower Menteh | 0 | 0.00 | 1 | 5.26 | 1 | 2.63 | 7 | 11.86 |
| Manka-Mambu | 24 | 15.69 | 1 | 5.26 | 2 | 5.26 | 7 | 11.86 |
| Nchang-Ntambang | 25 | 16.34 | 4 | 21.05 | 8 | 21.05 | 7 | 11.86 |
| Sisia I | 5 | 3.27 | 3 | 15.79 | 2 | 5.26 | 1 | 1.69 |
| Mubang | 16 | 10.46 | 0 | 0.00 | 4 | 10.53 | 0 | 0.00 |
| Mokop | 1 | 0.65 | 2 | 10.53 | 1 | 2.63 | 9 | 15.25 |
| Terrekoh | 14 | 9.15 | 1 | 5.26 | 5 | 13.16 | 7 | 11.86 |
| Total | 153 | 100 | 19 | 100 | 38 | 100 | 59 | 100 |
Water accessibility in terms of distance to the nearest water point is related to water security. Water security is sustainable access, on a watershed scale, to adequate quantities of water of acceptable quality, to
ensure human and ecosystem health (Norman et al., 2010). It is a multi-dimensional concept that recognizes that sufficient good quality water is needed for social, economic and cultural uses while, at the same time, adequate water is required to sustain and enhance important ecosystem functions. From another perspective, water security is the capacity of a population to safeguard sustainable access to adequate quantities of acceptable quality water for sustaining livelihoods, human well-being, and socio-economic development, for ensuring protection against waterborne pollution and water-related disasters, and for preserving ecosystems in a climate of peace and political stability (UN-Water, 2018). In Bamenda III municipality, the majority of the people cover distances of less than water points (Table 7).
| Neighbourhoods | <50 m | 51-100 m | 101-200 m | 200 m+ | ||||
| F | % | F | % | F | % | F | % | |
| Atielah-Mbelewa | 8 | 5.84 | 6 | 13.64 | 5 | 11.90 | 5 | 10.87 |
| Atiesu-Mbessi | 9 | 6.57 | 3 | 6.82 | 0 | 0.00 | 3 | 6.52 |
| Bayelle | 12 | 8.76 | 6 | 13.64 | 1 | 2.38 | 3 | 6.52 |
| Bunjong-Mambu | 6 | 4.38 | 6 | 13.64 | 2 | 4.76 | 5 | 10.87 |
| Futru I | 18 | 13.14 | 0 | 0.00 | 10 | 23.81 | 3 | 6.52 |
| Lower Menteh | 4 | 2.92 | 2 | 4.55 | 1 | 2.38 | 2 | 4.35 |
| Manka-Mambu | 20 | 14.60 | 9 | 20.45 | 1 | 2.38 | 4 | 8.70 |
| Nchang-Ntambang | 21 | 15.33 | 6 | 13.64 | 8 | 19.05 | 9 | 19.57 |
| Sisia I | 3 | 2.19 | 4 | 9.09 | 2 | 4.76 | 2 | 4.35 |
| Mubang | 10 | 7.30 | 0 | 0.00 | 8 | 19.05 | 2 | 4.35 |
| Mokop | 7 | 5.11 | 1 | 2.27 | 0 | 0.00 | 5 | 10.87 |
| Terrekoh | 19 | 13.87 | 1 | 2.27 | 4 | 9.52 | 3 | 6.52 |
| Total | 137 | 100 | 44 | 100 | 42 | 100 | 46 | 100 |
Water insecurity sets in when people cover a distance of more than to carry drinking water and water for other domestic chores. In Bamenda III, a significant proportion of the population covers more than to get water. Water accessibility is directly linked to water availability for domestic chores. The basic domestic uses of water in Bamenda III like elsewhere are shower, laundry, toilet sanitation, house cleaning, doing dishes, cooking and drinking (Table 8).
| Chores | <5 L | 6-10 L | 11-15 L | 16-20 L | 21 L+ | |||||
| F | % | F | % | F | % | F | % | F | % | |
| Shower | 0 | 0.0 | 143 | 53.2 | 72 | 26.8 | 25 | 9.3 | 29 | 10.8 |
| Laundry | 0 | 0.0 | 28 | 10.4 | 34 | 12.6 | 75 | 26.4 | 132 | 49.1 |
| Toilet flush/cleaning | 106 | 39.4 | 79 | 29.4 | 64 | 23.8 | 8 | 3.0 | 12 | 4.5 |
| House cleaning | 59 | 21.9 | 58 | 21.6 | 42 | 15.6 | 75 | 27.9 | 35 | 13.0 |
| Cleaning dishes | 60 | 22.3 | 54 | 20.1 | 50 | 18.6 | 75 | 27.9 | 30 | 11.2 |
| Cooking | 23 | 8.6 | 79 | 29.4 | 60 | 22.3 | 75 | 27.9 | 32 | 11.9 |
| Drinking | 269 | 100.0 | 0 | 0 | 0 | 0 | 0 | 0 | 0 | 0 |
| Average | 27.5 | 23.4 | 17.1 | 17.5 | 14.3 | |||||
On the average, majority of the people use about 6 to 10 litres every day, which falls below international standards, implying there is water scarcity to meet domestic needs. Water scarcity is caused by several factors, and climate change is one of the leading drivers (Table 9, Figure 15).
| Drivers | Options | Frequency | % |
| Irregular/unreliable rainfall | Yes | 194 | 72.1 |
| No | 50 | 18.6 | |
| Don't know | 25 | 9.3 | |
| Farming at watersheds | Yes | 168 | 62.5 |
| No | 58 | 21.6 | |
| Don't know | 43 | 16.0 | |
| Mismanagement of water projects | Yes | 180 | 66.9 |
| No | 67 | 24.9 | |
| Don't know | 22 | 8.2 | |
| Eucalyptus plantations at watersheds | Yes | 149 | 55.4 |
| No | 54 | 20.1 | |
| Don't know | 66 | 24.5 | |
| Grazing at watersheds | Yes | 159 | 59.1 |
| No | 70 | 26.0 | |
| Don't know | 40 | 14.9 | |
| Private land ownership at the watershed | Yes | 151 | 56.1 |
| No | 56 | 20.8 | |
| Don't know | 62 | 23.0 | |
| Deforestation in the watersheds | Yes | 188 | 69.9 |
| No | 31 | 11.5 | |
| Don't know | 50 | 18.6 | |
| Conflicting land uses at the watersheds | Yes | 123 | 45.7 |
| No | 53 | 19.7 | |
| Don't know | 93 | 34.6 | |
| Irregular repairs of leakages | Yes | 202 | 75.1 |
| No | 53 | 19.7 | |
| Don't know | 14 | 5.2 |
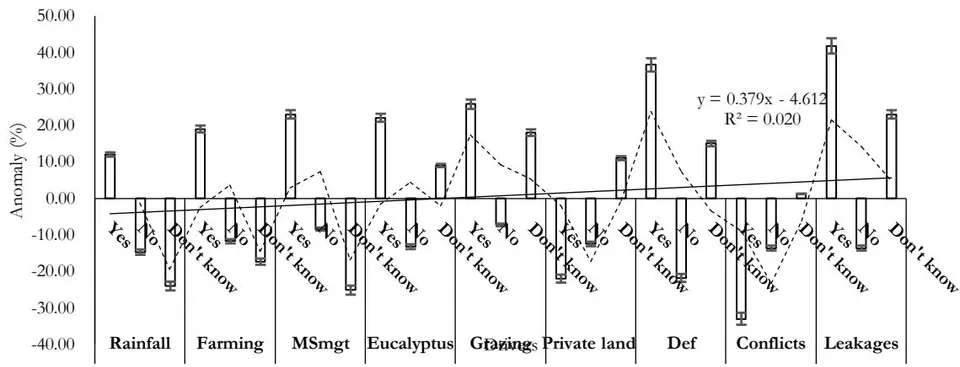
The trend of water scarcity is increasing. The population perceived that unreliable rainfall contributes to of the scarcity. This is affirmed by the rainfall data which proved that rainfall is becoming unreliable in Bamenda with an average CV of for the period 2013 to 2019, and recurrent incidents of dryness through negative values of SPI for the same period. Other contributors to water scarcity are farming and grazing at watersheds, mismanagement of water projects, eucalyptus plantations around watersheds, private land ownership at watersheds, deforestation, conflicting water uses and irregular repairs of pipeline leakages. The peak periods of water scarcity are during the dry season when the water table is lowest (Figure 16).
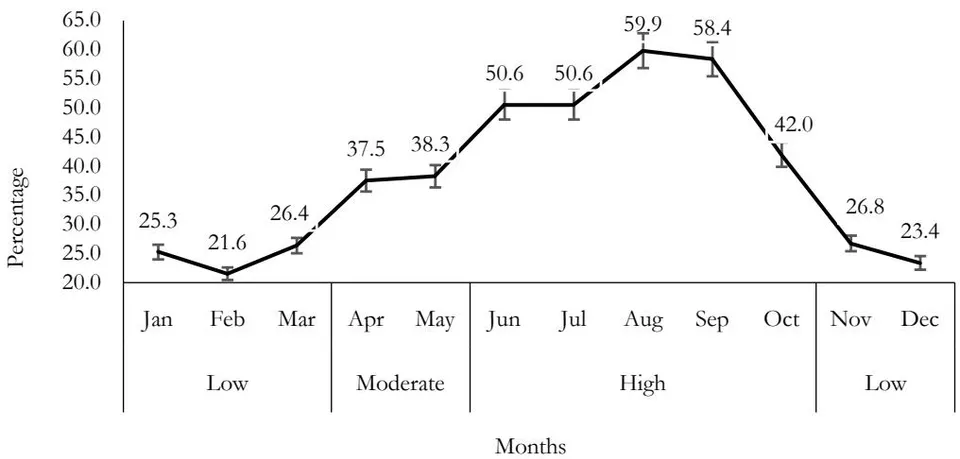
The population's perception of low water availability from November to March coincides accurately with the dry season. Moderate water supply sets in April to May when people begin to collect rainwater to meet some of the domestic chores. Water availability is generally high from June to October when rainfall is relatively high. The perceived annual fluctuation and reliability of domestic water supply have the same patterns of mean monthly rainfall. The population of Bamenda III indicated that water scarcity is manifested through chronic water shortages, drying streams, periodic floods and rising temperatures (Table 10).
| Neighbourhoods | Manifestation | Very Visible | Not Visible | Don't know | |||
| F | % | F | % | F | % | ||
| Atielah-Mbelewa | Chronic water shortages | 19 | 10 | 5 | 10 | 0 | 0 |
| Drying streams | 20 | 10 | 4 | 11 | 0 | 0 | |
| Floods | 10 | 13 | 9 | 8 | 5 | 7 | |
| Rising temperatures | 13 | 11 | 7 | 10 | 4 | 5 | |
| Atiesu-Mbessi | Chronic water shortages | 9 | 5 | 2 | 4 | 4 | 17 |
| Drying streams | 9 | 4 | 2 | 5 | 4 | 15 | |
| Floods | 2 | 3 | 6 | 5 | 7 | 10 | |
| Rising temperatures | 4 | 3 | 7 | 10 | 4 | 5 | |
| Bayelle | Chronic water shortages | 15 | 8 | 4 | 8 | 3 | 13 |
| Drying streams | 17 | 8 | 2 | 5 | 3 | 12 | |
| Floods | 4 | 5 | 12 | 10 | 6 | 8 | |
| Rising temperatures | 8 | 7 | 9 | 13 | 5 | 6 | |
| Bunjong-Mambu | Chronic water shortages | 12 | 6 | 5 | 10 | 2 | 8 |
| Drying streams | 10 | 5 | 5 | 14 | 4 | 15 | |
| Floods | 3 | 4 | 9 | 8 | 7 | 10 | |
| Rising temperatures | 6 | 5 | 5 | 7 | 8 | 10 | |
| Futru I | Chronic water shortages | 25 | 13 | 5 | 10 | 1 | 4 |
| Drying streams | 30 | 15 | 0 | 0 | 1 | 4 | |
| Floods | 18 | 23 | 9 | 8 | 4 | 6 | |
| Rising temperatures | 18 | 15 | 7 | 10 | 6 | 7 | |
| Lower Menteh | Chronic water shortages | 5 | 3 | 4 | 8 | 0 | 0 |
| Drying streams | 6 | 3 | 3 | 8 | 0 | 0 | |
| Floods | 3 | 4 | 5 | 4 | 1 | 1 | |
| Rising temperatures | 7 | 6 | 1 | 1 | 1 | 1 | |
| Manka-Mambu | Chronic water shortages | 22 | 11 | 5 | 10 | 7 | 29 |
| Drying streams | 24 | 12 | 3 | 8 | 7 | 27 | |
| Floods | 6 | 8 | 15 | 13 | 13 | 18 | |
| Rising temperatures | 10 | 9 | 15 | 21 | 9 | 11 | |
| Nchang-Ntambang | Chronic water shortages | 32 | 17 | 8 | 15 | 4 | 17 |
| Drying streams | 30 | 15 | 8 | 22 | 6 | 23 | |
| Floods | 11 | 14 | 19 | 16 | 14 | 20 | |
| Rising temperatures | 16 | 14 | 9 | 13 | 19 | 23 | |
| Sisia I | Chronic water shortages | 10 | 5 | 1 | 2 | 0 | 0 |
| Drying streams | 30 | 15 | 8 | 22 | 6 | 23 | |
| Floods | 4 | 5 | 4 | 3 | 3 | 4 | |
| Rising temperatures | 4 | 3 | 4 | 6 | 3 | 4 | |
| Mubang | Chronic water shortages | 16 | 8 | 4 | 8 | 0 | 0 |
| Drying streams | 30 | 15 | 8 | 22 | 6 | 23 | |
| Floods | 12 | 15 | 6 | 5 | 2 | 3 | |
| Rising temperatures | 12 | 10 | 4 | 6 | 4 | 5 | |
| Mokop | Chronic water shortages | 8 | 4 | 5 | 10 | 0 | 0 |
| Drying streams | 9 | 4 | 4 | 11 | 0 | 0 | |
| Floods | 3 | 4 | 9 | 8 | 1 | 1 | |
| Rising temperatures | 9 | 8 | 1 | 1 | 3 | 4 | |
| Terrekoh | Chronic water shortages | 20 | 10 | 4 | 8 | 3 | 13 |
| Drying streams | 21 | 10 | 5 | 14 | 1 | 4 | |
| Floods | 4 | 5 | 15 | 13 | 8 | 11 | |
| Rising temperatures | 10 | 9 | 2 | 3 | 15 | 19 | |
All the sampled neighbourhoods have experienced all these manifestations, though in different intensities. In the face of these problems, the population has resorted to adaptation by water storage, rationing, restoration of watersheds, good governance, no farming and grazing at watersheds, rainwater collection, planting of environmentally friendly trees, parks and gardens (Town Green) water reserves and inculcating water resources management into the local development agenda (Figure 17).
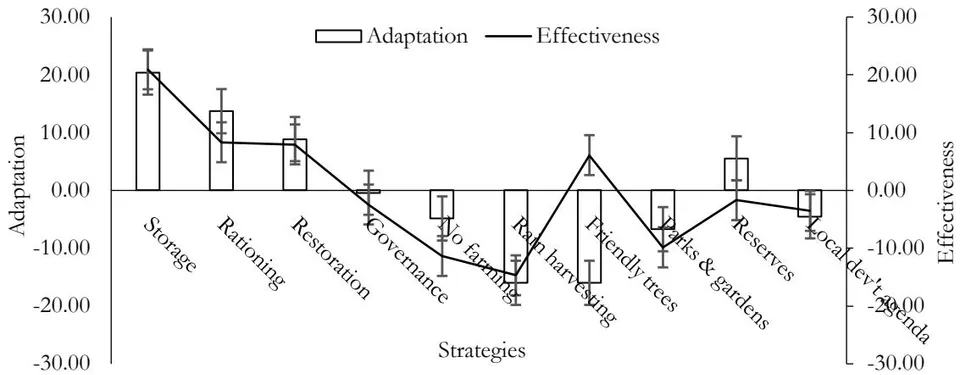
These adaptation strategies are not very effective. Water governance, farming and grazing at watersheds, rain harvesting, parks and gardens, water reserves and factoring in water into the local development agenda are not effective. Some of this ineffectiveness in adaptation strategies are climate-related like prolonged dry seasons, unprotected watersheds, mismanagement of funds, and low representation of women in water governance, amongst others (Table 11).
| Limitations | Yes | No | Don't know | |||
| F | % | F | % | F | % | |
| Prolonged dry seasons | 241 | 89.6 | 8 | 3.0 | 20 | 7.4 |
| Incessant rationing | 210 | 78.1 | 20 | 7.4 | 39 | 14.5 |
| Unprotected watersheds | 176 | 65.4 | 58 | 21.6 | 35 | 13.0 |
| Mismanagement of funds | 165 | 61.3 | 80 | 29.7 | 24 | 8.9 |
| Inadequate storage facilities | 126 | 46.8 | 85 | 31.6 | 58 | 21.6 |
| Difficult topography | 137 | 50.9 | 54 | 20.1 | 78 | 29.0 |
| Conflicting water users | 143 | 53.2 | 55 | 20.4 | 71 | 26.4 |
| Poor maintenance of pipelines | 194 | 72.1 | 35 | 13.0 | 40 | 14.9 |
| Irregular payment of levies | 159 | 59.1 | 66 | 24.5 | 44 | 16.4 |
| Gender imbalances in water management | 116 | 43.1 | 81 | 30.1 | 72 | 26.8 |
| Farming at watersheds | 176 | 65.4 | 62 | 23.0 | 31 | 11.5 |
| Cattle rearing at watersheds | 179 | 66.5 | 51 | 19.0 | 39 | 14.5 |
| Bush fires | 181 | 67.3 | 51 | 19.0 | 37 | 13.8 |
| Average | 63.0 | 20.2 | 16.8 | |||
Again, population increase against a backdrop of little or no efforts to improve water sources has been one of the key drivers of water scarcity in Bamenda III. Bamenda III has urban and semi-urban characteristics, with an influx of population in search of better opportunities through commercial ventures and education. Since 2016, the population has also increased by internally displaced people from hotspots of the crisis in the North West Region.
IV. DISCUSSION
In the phase of so many problems plaguing water accessibility in the Bamenda III municipality, much needs to be done in terms of water governance, restoring water sources (watersheds) and many other strategies in the face of climate change. Water governance is the decision-making process through which water is managed (Norman et al., 2010). Good governance involves adhering to principles of human rights, including effectiveness, responsiveness and accountability; openness and transparency; participation in the performance of key governance functions relating to policy and institutional arrangements; planning and coordination and regulation and licensing (Tume, 2021 b). For the integration of substance, integrated water resources management (IWRM) provides a process to involve stakeholders
across society, the economy and the environment. Greater public participation to manage climate risk is suggested as a way to build adaptive capacities at multiple levels, avoid institutional traps and prioritize risk reduction for socially vulnerable groups. At the same time, scientific information and data also need to be made available at the local level and included as information in local multi-stakeholder decision processes (Stewart et al., 2020).
The 2021-2030 period has been declared as a decade of ecosystem restoration by the international community. At the local level of Bamenda III, much can be done from lowland wetlands to watersheds. Restoring wetlands and riverine areas can improve water quality by capturing pollutants and sediment from land degradation. In catchment areas, restoration can improve the flow and availability of water. Restoration of forests and other ecosystems has the potential to save an estimated USD 890 million each year in water treatment costs in the world's largest cities (United Nations Environment Programme-UNEP, 2021). To avoid catastrophic climate change, 2030 should mark two milestones: the end of the UN Decade on Ecosystem Restoration and the achievement of emissions reduction targets in line with the Paris Agreement goal to limit global warming to below . Delaying this will push humanity to pass a tipping point, beyond which solutions will be less effective and some damage, irreversible (IPCC, 2018). Improved land stewardship, including restoration, is one effective strategy to limit global warming (Strassburg et al., 2020). Restoration is only part of the solution. Successfully achieving net-zero emissions will also rely on rapid emission reductions across all sectors worldwide. Without this multi-pronged effort, the benefits gained through restoration efforts may be only temporary.
Nature-based Solutions (NbS) can potentially contribute over one-third of the total climate change mitigation needed by 2030 to keep global warming to just below . NbS is inspired and supported by nature and uses, or imitates natural processes to contribute to the improved management of water (UN-Water, 2018). NbS can involve conserving or rehabilitating natural ecosystems and/or the enhancement or creation of natural processes in modified or artificial ecosystems like watersheds. Within nature-based solutions, the restoration of watersheds is a key element. This could involve action to better manage some 2.5 billion hectares of forest, crop and grazing land (restoration and avoided degradation), and restoring over 230 million hectares of natural cover (Griscom et al., 2019). This is reflected in the evolution of themes for the celebration of World Water Day (Table 12).
| Years | Themes |
| 2003 | Water for people, water for life |
| 2004-2006 | Water, a shared responsibility |
| 2007-2009 | Water in a changing world |
| 2010-2012 | Managing water under uncertainty and risk |
| 2013-2014 | Water and energy |
| 2015 | Water for a sustainable world |
| 2016 | Water and jobs |
| 2017 | Wastewater: the untapped resource |
| 2018 | Nature-based solutions for water |
| 2019 | Leaving no one behind |
| 2020 | Water and climate change |
| 2021 | Valuing water |
| 2022 | Groundwater: Making the invisible visible |
Humanity is altering the climate by continually emitting GHGs into the atmosphere is an inescapable reality (IPCC, 2014). Ecosystem and watershed restoration can play an important role in people's adaptation to climate change by increasing resilience and reducing vulnerability to extreme events. Restoration, conservation and sustainable management of biodiversity and ecosystem services can be included alongside more conventional approaches as part of an overall adaptation strategy (Kapos et al., 2019). Ecosystem restoration inland can also reduce climate-related hazards, such as flooding, soil erosion and landslides linked to extreme rainfall events. Forest restoration on slopes reduces erosion that results from intense rainfall and enhances groundwater recharge.
Attention to NbS has significantly increased in recent years. This is evidenced through the mainstreaming of NbS into a wide range of policy advances, including in water resources, food and water security, biodiversity, environment, disaster risk reduction, urban settlements and climate change. This shows a growing convergence of interests around the recognition of the need for common objectives and the identification of mutually supporting actions such as the 2030 Agenda for Sustainable Development through its acknowledgement of the interdependency of its various goals and targets. NBS mainly address water supply by managing precipitation, humidity, water storage, infiltration and transmission, so that improvements are made in the location, timing and quantity of water available for human needs. NBS for addressing water availability in urban settlements are also of great importance, given that the majority of the world's population is now living in cities.
An important sub-set of NbS is Ecosystem-based Adaptation (EbA), which helps people adapt to climate change. EbA is a nature-based approach that uses biodiversity and ecosystem services to help people adapt to the adverse effects of climate change (International Institute for Environment and Development-IED, 2019). It involves activities such as water catchment restoration by tree planting, slope stabilization by tree planting to prevent landslides, applying integrated water resource management to address water shortages and managing forests sustainably to prevent erosion and regulate water flow. EbA rests on combining local knowledge with evolving information on climate change and has been applied to address the local challenges of climate change impacts.
V. CONCLUSION
Climate variability and change are already a reality in Bamenda III. Water catchments and sources are not properly harnessed. Water governance institutions are weak and inactive. There is a limited supply of pipe-borne water in communities and waterborne diseases are inevitable. Both climate and water management require mechanisms for oversight and coordination. Sectoral fragmentation and bureaucratic competition may pose serious challenges for the integration across scales. This calls for greater public participation to discuss and manage climate risk; build adaptive capacities at multiple levels, and prioritise risk reduction for socially vulnerable groups. Upscaling NbS and EbA are central to achieving the 2030Agenda for Sustainable Development. Sustainable water security will not be achieved through business-as-usual approaches. NbS work with nature instead of against it, and thereby provide an essential means to move beyond business-as-usual to escalate social, economic and hydrological efficiency gains in water resources management. NbS show particular promise in achieving progress towards sustainable food production, improved human settlements, access to water supply and sanitation services, and water-related disaster risk reduction. They can also help to respond to the impacts of climate change on water resources.