The cluster UAVs have developed rapidly in recent years with the advantages of low cost, expandability and high reliability. However, due to their small size, they have the shortages of range and flight time. Wingtip connection technology, as an important way to increase the range and flight time of fixed-wing cluster UAVs, has also developed rapidly in recent years. From the theoretical analysis, it is concluded that the wingtip connection can effectively improve the aerodynamic characteristics of fixed-wing UAVs, and the conclusions are validated by vortex lattice method simulation. Based on this, the influence of the number of units on the flight performance of the combination is analysed theoretically. As the number of units increases, the combination can have higher ceiling, larger range and longer flight time.
## I. INTRODUCTION
With the increasingly complex battlefield environment, the war has put forward higher requirements for the mission capability and viability of UAVs. The cost of large strategic deterrence UAVs continues to rise, and the cluster UAVs have gradually become a new focus [1]. However, due to the cost and volume constraints, cluster UAVs are inherently short of range and endurance. At present, there are three common methods to improve the range and endurance of the aircraft: First, the aerial refuelling technology is adopted, but for a large number of cluster UAVs, the efficiency of aerial refuelling cannot meet the actual needs. The second is to use a large aspect ratio design combined with solar power module, but for clustered UAVs that need high flexibility and mobility, the aspect ratio will be greatly limited, while the small aspect ratio combined with solar power module will have very low income. Third, like the "Gremlins" in the United States, large transport planes are used for long-distance delivery, but this only solves the problem of long distance, not the endurance time.
In recent years, with the rise of clustered UAVs, a technology that once appeared has been re-valued, namely wingtip connection technology. Scientists hope that the fixed-wing cluster UAVs can form a combination with a large aspect ratio through wingtip connection. At this time, if the UAVs combined with solar technology, the range and endurance time can be greatly extended [2].
Wingtip connection was first proposed by Richard Vogt, a German scientist who immigrated to the United States after World War II. Based on this concept, the United States carried out "MX-1018" (Tip-Tow) and "Tom Tom" projects. However, due to the aerodynamic interference at the wingtip, this research has caused great potential safety hazards and even casualties. In addition, the impact of the gradual maturity of aerial refuelling technology at that time temporarily caused the flight test of wingtip connection stop [3].
Since the 21st century, scientists in the United States, Germany and China have seen the great value of wingtip connection, see Figure 1, for it can improve the ceiling and endurance of cluster UAVs, and gradually resumed and accelerated the study on wingtip connection. Through computational fluid dynamics analysis and wind tunnel test, American scientists analysed and studied aerodynamics and aerodynamic control in the process of wingtip connection [4-7], and verified the flight control system through flight test [8-10]; German scientists mainly explored and practiced the wingtip connection technology in engineering [11], and focused on designing the control system of the combination [12]; Since 2018, China has started the exploration and study of relevant technologies, demonstrated that wingtip connection can improve range and endurance [13, 14], and conducted relevant flight tests [15, 16].
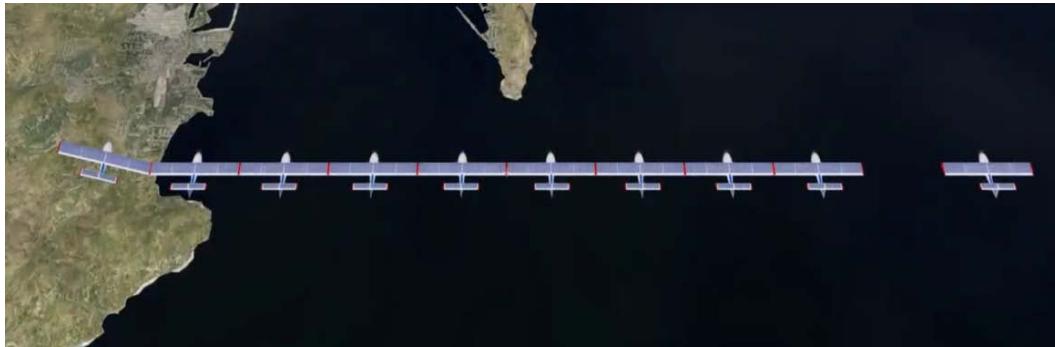 Figure 1: Cluster UAVs with wingtip connection
In this paper, through the study on the aerodynamic theory of the UAV combination, simulation and example verification are carried out on the improvement of the ceiling and endurance of the wingtip connection, so as to verify that the clustered UAVs can improve the ceiling and endurance by wingtip connection.
## II. BASIC THEORETICAL RESEARCH ON FLIGHT PERFORMANCE OF WINGTIP CONNECTION
Taking the conventional aircraft with a wing, without offset, dihedral and twist, as an example, the aerodynamic performance of the combination formed by the wingtip connection of the flying units with identical $n$ frames is analysed theoretically.
### a) Effect of Wingtip Connection on Lift-drag Ratio
Lift-drag ratio is the most intuitive embodiment of aircraft aerodynamic performance. The larger the lift- drag ratio, the better the aerodynamic performance. In this section, it is assumed that the external environment before and after wingtip connection is unchanged, and the flight altitude and speed of the aircraft are unchanged. When the flight state is approximately at the minimum resistance, the endurance can reach the maximum. This is an ideal state, which can predict the trend and simplify the formula. For this state, there is always a waste resistance coefficient, $C_{D0n}$, equal to the induced resistance coefficient, $C_{Din}$, because the induced resistance is inversely proportional to the square of the velocity, and the waste resistance is proportional to the square of the velocity. When the two are equal, the total resistance is the smallest, see Figure 2, that is
$$
C _ {D n} = C _ {D i n} + C _ {D 0 n} = 2 C _ {D 0 n} \tag {1}
$$
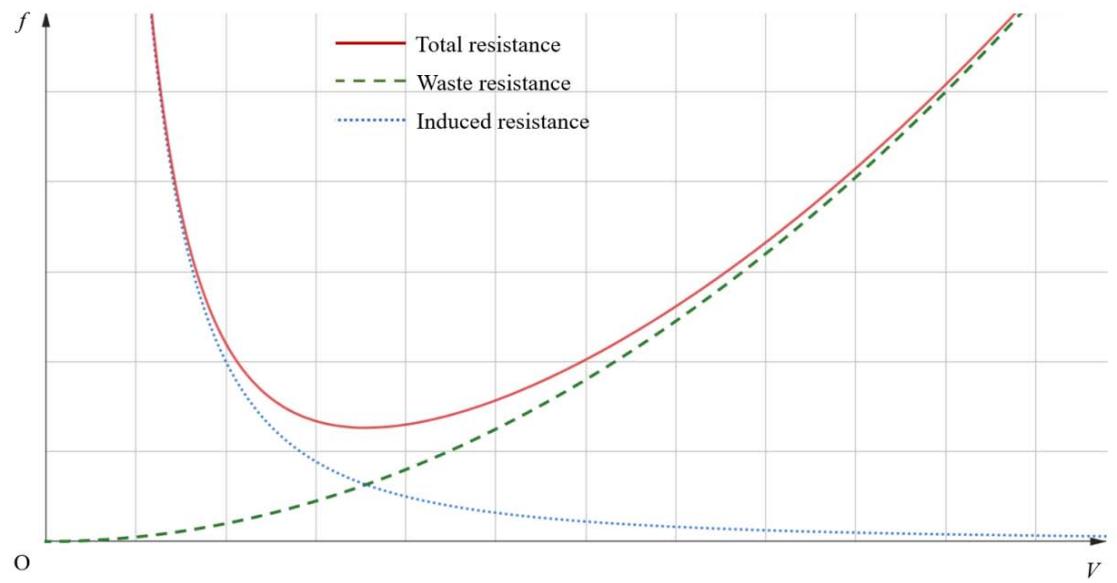 Figure 2: Relationship between resistance and speed
Of which, $\left\{ \begin{array}{l} C_{D0n} = \frac{C_{Ln}^2}{\pi A_ne_n} \\ A_n = nA \end{array} \right.$ (2)
Where, $C_D$ is the resistance coefficient, $C_L$ is the lift coefficient, and $A$ is the aspect ratio, $e$ is Oswald efficiency factor, and the lower corner mark $n$ represents the number of same flight units formed the combination.
The lift-drag ratio, $K$, can be derived from equations (1) and (2).
$$
K_{n} = \frac{C_{Ln}}{C_{Dn}} = \sqrt{\frac{\pi A_{n} e_{n}}{4 C_{D0n}}} = \sqrt{\frac{\pi A}{4 C_{D0n}}} \cdot \sqrt{n e_{n}} \tag{3}
$$
Under the assumptions in this section, the parasitic resistance coefficient of the combination is equal to the coefficient of the flight unit, which is a constant, that is $C_{D0n} = C_{D0}\sqrt{\frac{\pi A}{4C_{D0n}}}$.
$$
K _ {n} \propto \sqrt {n e _ {n}} \tag {4}
$$
That is, the lift-drag ratio of the assembly $K_{n}$ is proportional to $\sqrt{ne_{n}}$. Here, the Oswald efficiency factor can be calculated according to the formula mentioned in literature [2], that is
$$
e _ {n} = \frac {1}{\pi n A k C _ {d 0} + 1 / (\mu s)} \tag {5}
$$
Where, according to the Oswald efficiency coefficient of the high aspect ratio wing, $k$ is assumed to be $0.18^{[17]}$, $C_{d0}$ is the resistance coefficient of the airfoil. $\mu$ is the theoretical Oswald coefficient without considering the influence of the fuselage, $s$ indicating the influence of the fuselage on the induced resistance, which is a function of the fuselage diameter $d$ and the wingspan $b$.
$$
s = 1 - 2 \left(\frac {d}{b}\right) ^ {2} \tag {6}
$$
For the specified flight unit, in equation (5), all are constants except $e_n$ and $n$, so it is advisable to set
$$
\left\{
\begin{array}{l}
k _ {1} = \pi A k C _ {d 0} \\
k _ {2} = \frac{1}{\mu s}
\end{array}
\right.
\tag {7}
$$
Then equation (5) can be reduced to
$$
e _ {n} = \frac {1}{k _ {1} n + k _ {2}} \tag {8}
$$
It can be seen that Oswald efficiency factor decreases with $n$ increasing.
### b) Effect of Wingtip Connection on Cruise Speed
This section assumes that the maximum lift-drag ratio point of the flight unit is taken at $0^{\circ}$, so that the cruise speed of the flight unit is the speed of horizontal flight at $0^{\circ}$ angle of attack. It is assumed that the force balance of flight units before and after the wingtip connection is always satisfied, and the flight altitude remains unchanged.
Define that in the two-dimensional plane, the horizontal flight direction of the aircraft is the x-axis positive direction, and the y-axis is perpendicular to the x-axis and upward. Carry out force analysis on the X and Y directions of the aircraft respectively, and then equation (9) is on X axis, equation (10) is on Y axis.
$$
F_{n} = D_{n} = \frac{1}{2} \rho_{n} V_{n}^{2} C_{Dn} S_{n}
$$
$$
G_{n} = L_{n} = \frac{1}{2} \rho_{n} V_{n}^{2} C_{L n} S_{n} \tag{10}
$$
It can be seen from equation (9) and (10),
$$
F _ {n} = G _ {n} / K _ {n} \tag {11}
$$
That is, when the maximum lift-drag ratio is reached, the cruising pull is the smallest, so that the endurance time is the longest.
The lift coefficient calculation formula given by reference [15] under the constant speed assumption.
$$
C _ {L n} \approx \left(\frac {1}{2} \rho_ {n} V _ {n} ^ {2}\right) ^ {- 1} \frac {n L _ {i} - 2 \Delta L}{n S} = \left(\frac {1}{2} \rho_ {n} V _ {n} ^ {2}\right) ^ {- 1} \left(\frac {L _ {i}}{S} - 2 \frac {\Delta L}{n S}\right) \tag {12}
$$
It can be seen that the lift coefficient increases with the increasing of $n$. Where $L_{i}$ is the ideal lift of a single wing calculated according to the two-dimensional infinite length model, and $\Delta L$ is the lift difference for one side of a single wing. Under the assumption of this section, when $G_{n}$ unchanged, $V_{n}$ gradually decreases with the increase of $C_{Ln}$, and equation (10) can be reduced to equation (13).
$$
V _ {n} \propto \sqrt {\frac {1}{C _ {L n}}} \tag {13}
$$
That is, the cruising speed of the combination is inversely proportional to $\sqrt{C_{Ln}}$.
## III. SIMULATION STUDY ON FLIGHT PERFORMANCE OF WINGTIP CONNECTION
The vortex lattice method is used to simulate the aerodynamic performance of the wingtip connection. Under the constant lift mode, the simplified full USA-35b airfoil model of a rectangular wing with $3\mathrm{m}$ wingspan and $0.4\mathrm{m}$ chord length is calculated, as shown in Figure 3, assuming that the wingtip is rigidly connected and there is no gap. The mass of the flight unit is $60\mathrm{kg}$, when the angle of attack is $\alpha = 0^{\circ}$ and the torque coefficient $C_m = 0$ at approximately the maximum lift-drag ratio.
 Figure 3: Simulation Model of flight unit
The approximate equivalent method of direct size increase is used in the calculation of the combination, which will lead to some errors in the simulation results. This method is used to simulate the changes of lift-drag ratio and flight speed with different number of units. The simulation results of aerodynamic characteristics at an altitude of $2000\mathrm{m}$ are shown in Figure 4.
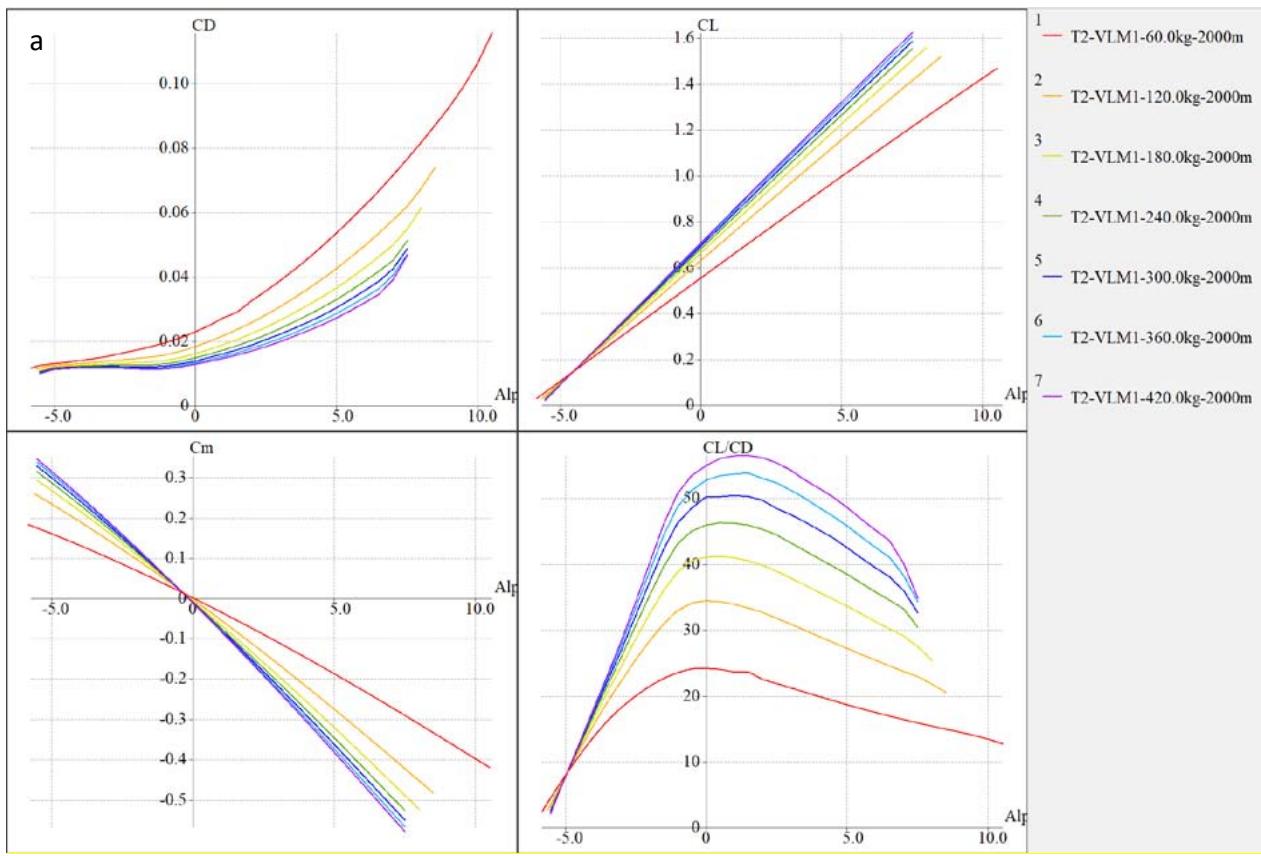
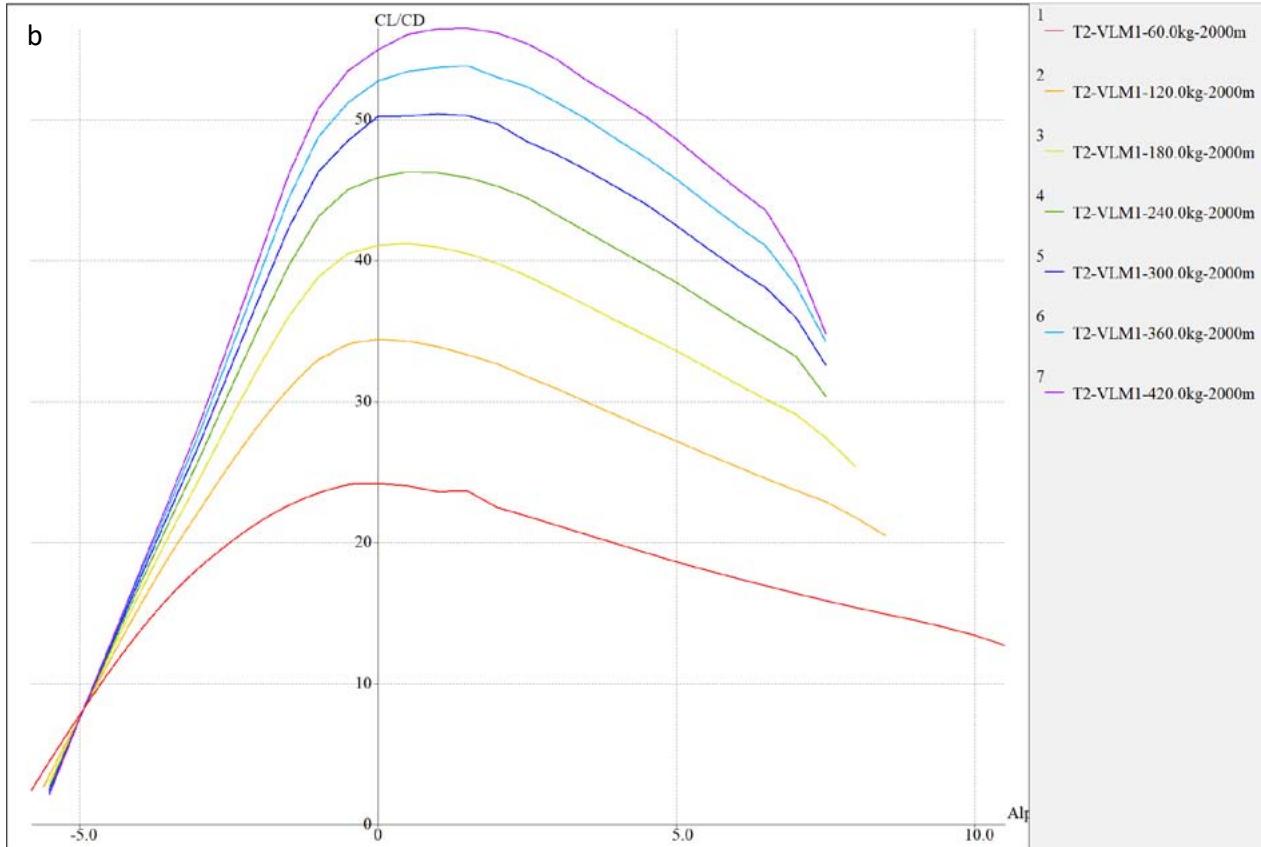 Figure 4: Variation of aerodynamic parameters vary with respect to the number of units in the assembly. (a) Variation of lift coefficient, resistance coefficient, torque coefficient and lift-drag ratio with respect to angle of attack. (b) Variation of lift-drag ratio with respect to angle of attack
See Table 1 for the sorted data, and draw Figure 5 for the simulation lift-drag ratio at $0^{\circ}$ and the calculated theoretical lift-drag ratio. It can be seen that the law of lift-drag ratio approximately meets $\sqrt{n}$ times, and the failure to reach $\sqrt{n}$ times is caused by $e_n < 1$. This result is consistent with the conclusion in Section 2.1.
Table 1: Data of calculation and simulation \\begin{table}[htbp] \\centering \\begin{tabular}{I^ccI^ccI^cc|} \\hline \\textbf{n} & \\textbf{Simulated lift-drag ratio} & \\textbf{Theoretical lift-drag ratio} & \\textbf{Speed[m/s]} & \\textbf{Lift coefficient} & \\textbf{$C_{ln} \cdot V_n^2$} \\ \\hline 1 & 24.161 & 24.161 & 42.00 & 0.553 & 975.49 \\ 2 & 34.397 & 34.164 & 39.38 & 0.629 & 975.44 \\ 3 & 41.050 & 41.847 & 38.40 & 0.661 & 974.68 \\ 4 & 45.870 & 48.322 & 37.88 & 0.679 & 974.29 \\ 5 & 50.199 & 54.024 & 37.56 & 0.691 & 974.83 \\ 6 & 53.539 & 59.170 & 37.34 & 0.699 & 974.60 \\ 7 & 56.095 & 63.930 & 37.18 & 0.705 & 974.56 \\ \\hline \\end{tabular} \\caption{Data of calculation and simulation} \\end{table}
<table> <tr> <td>n</td> <td>Simulated lift-drag ratio</td> <td>Theoretical lift-drag ratio</td> <td>Speed[m/s]</td> <td>Lift coefficient</td> <td>C<sub>ln</sub>·V<sub>n</sub>[2]</td> </tr> <tr> <td>1</td> <td>24.161</td> <td>24.161</td> <td>42.00</td> <td>0.553</td> <td>975.49</td> </tr> <tr> <td>2</td> <td>34.397</td> <td>34.164</td> <td>39.38</td> <td>0.629</td> <td>975.44</td> </tr> <tr> <td>3</td> <td>41.050</td> <td>41.847</td> <td>38.40</td> <td>0.661</td> <td>974.68</td> </tr> <tr> <td>4</td> <td>45.870</td> <td>48.322</td> <td>37.88</td> <td>0.679</td> <td>974.29</td> </tr> <tr> <td>5</td> <td>50.199</td> <td>54.024</td> <td>37.56</td> <td>0.691</td> <td>974.83</td> </tr> <tr> <td>6</td> <td>53.539</td> <td>59.170</td> <td>37.34</td> <td>0.699</td> <td>974.60</td> </tr> <tr> <td>7</td> <td>56.095</td> <td>63.930</td> <td>37.18</td> <td>0.705</td> <td>974.56</td> </tr> </table>
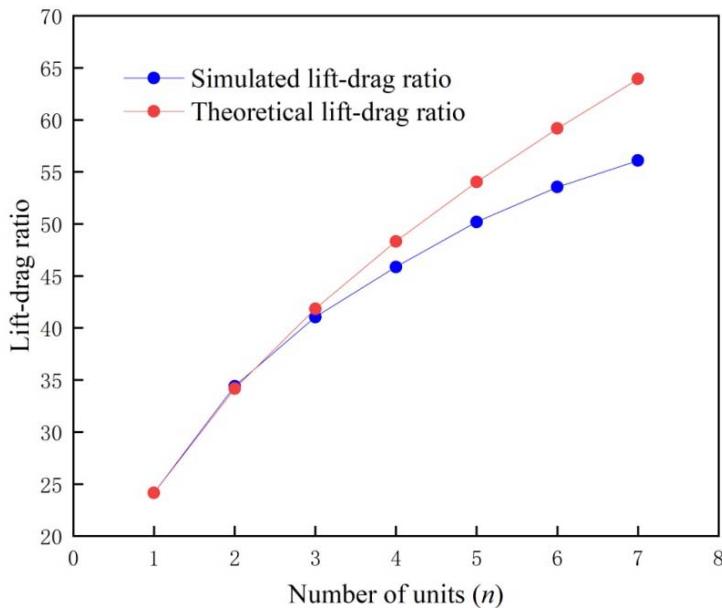 Figure 5: Relationship between lift-drag ratio and $1n$
Shown in Figure 6, two parameters of lift coefficient and flight speed with different $n$ are extracted from the simulation results. It can be seen that the demand for cruise speed gradually decreases with the increase of $n$, thus reducing the consumption of power and energy. The relationship between $C_{Ln} \cdot V_n^2$ and $n$ is shown in Figure 7, verifying equation (13), which is consistent with the conclusion in Section 2.2.
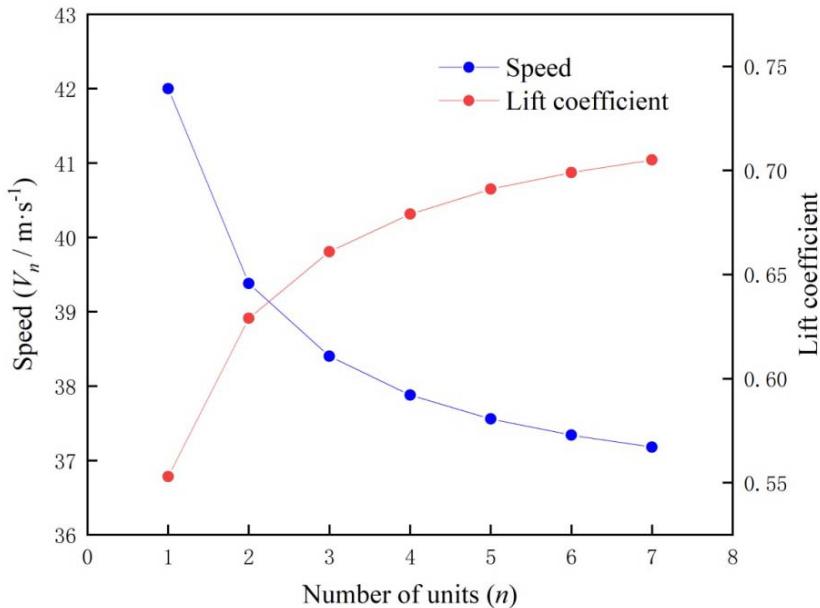 Figure 6: Relationship between lift coefficient, flight speed and $n$
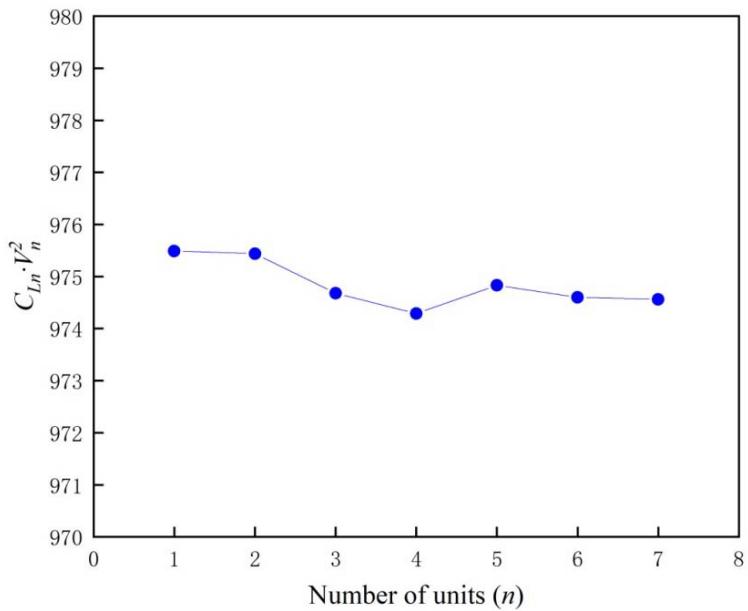 Figure 7: Relationship between $C_{Ln} V_n^2$ and $n$
## IV. EFFECT OF WINGTIP CONNECTION ON CRUISE PERFORMANCE
In this section, it is assumed that the flight unit or combination will fly at a constant speed and level under the condition of force balance.
### a) Influence of Different Heights and Unit Numbers on Tensile Demand
When $n$ is constant, both $G_{n}$ and $S_{n}$ are constant, too. Then let equation (10) be reduced to $k_{3} = \rho_{n}V_{n}^{2}C_{Ln}$.
$$
G_{n} = L_{n} = \frac{1}{2} S_{n} k_{3}
$$
It can be seen that $G_{n}, S_{n}$ and $k_{3}$ remain unchanged when the height changes. Then equation (9) can be reduced to
$$
F _ {n} = D _ {n} = \frac {1}{2} S _ {n} k _ {3} \frac {1}{K _ {n}} \tag {15}
$$
That is, when the flight altitude changes, the pull required for the level flight of the combination is only related to the lift-drag ratio, which mainly depends on the flight speed and angle of attack [18], and is not sensitive to the altitude change, so the demand for pull at different altitudes is basically unchanged.
Using the model of Section 3, since the influence of the fuselage is not considered, the induced resistance is used to estimate the resistance of the whole aircraft. The induced resistance of the flight unit is calculated according to the following formula.
$$
D_{i1} = \frac{1}{2} \rho_1 V_1^2 C_{Di1} S_1
$$
In the formula, the lower corner mark 1 represents the flight unit, and the induced resistance of the flight unit is calculated, $D_{i1} = 14.91\mathrm{N}$. The induced resistance of the small fixed wing UAV accounts for $25\% \sim 40\%$ of the total resistance. Here, the waste resistance of the flight unit is calculated according to the induced resistance accounting for $30\%$ of the total resistance, $D_{p1} = 41.74\mathrm{N}$. Similarly, the induced resistance of the combination, $D_{in}$, can be obtained, while the waste resistance of the combination, $D_{pn}$, can be calculated using the following formula.
$$
D _ {p n} = n D _ {p 1} \frac {V _ {n} ^ {2}}{V _ {1} ^ {2}} \tag {17}
$$
Then calculate the tensile demand of a single propeller through the following formula.
$$
F _ {n} = \frac {D _ {i n} + D _ {p n}}{n} \tag {18}
$$
The relationship between tensile force $F_{n}$ and $n$ is shown in Figure 8.
Table 2: Relationship between tensile force ${F}_{n}$ and $n$
<table><tr><td>n</td><td>Tensile demand of single propeller Fn[N]</td></tr><tr><td>1</td><td>56.64</td></tr><tr><td>2</td><td>45.59</td></tr><tr><td>3</td><td>41.48</td></tr><tr><td>4</td><td>39.15</td></tr><tr><td>5</td><td>37.81</td></tr><tr><td>6</td><td>36.78</td></tr><tr><td>7</td><td>36.05</td></tr></table>
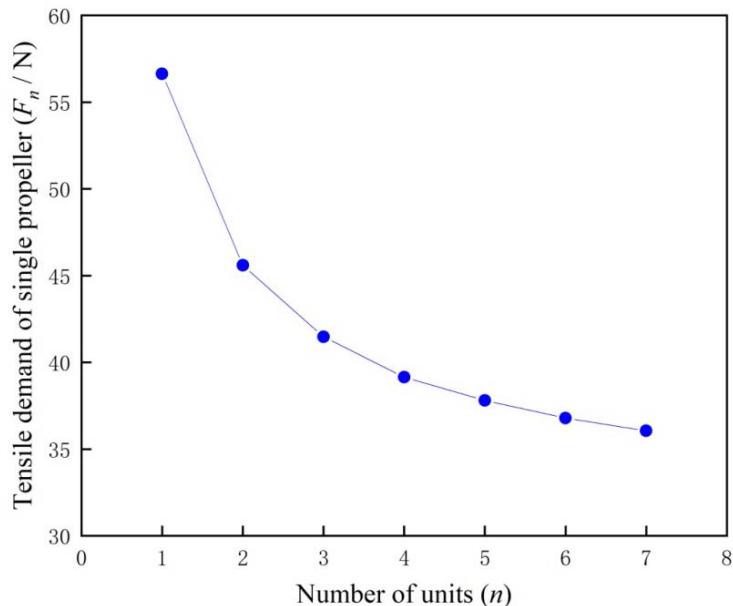 Figure 8: Relationship and trend between tensile force $F_{n}$ and $n$
It can be seen that the required tension $F_{n}$ decreases with the increase of $n$, and the change rate decreases.
# b) Wingtip Connection can Raise the Ceiling
When estimating the resistance according to Section 4.1 using the model of section 3, for a motor drive, the 1.5:1 reduction mechanism and $16 \times 8$ APC propeller is calculated under $32 \mathrm{~V}$ power supply. The maximum pull of single propeller at different altitudes is shown in Table 3, and Figure 9 is drawn accordingly.
Table 3: Maximum tension at different altitudes
<table><tr><td>Altitude H[km]</td><td>Maximum pulling force Fmax[N]</td><td>Altitude H[km]</td><td>Maximum pulling force Fmax[N]</td></tr><tr><td>0</td><td>60.22</td><td>7</td><td>46.30</td></tr><tr><td>1</td><td>58.61</td><td>8</td><td>43.61</td></tr><tr><td>2</td><td>56.91</td><td>9</td><td>40.65</td></tr><tr><td>3</td><td>55.10</td><td>10</td><td>37.43</td></tr><tr><td>4</td><td>53.15</td><td>11</td><td>33.83</td></tr><tr><td>5</td><td>51.05</td><td>12</td><td>29.84</td></tr><tr><td>6</td><td>48.76</td><td></td><td></td></tr></table>
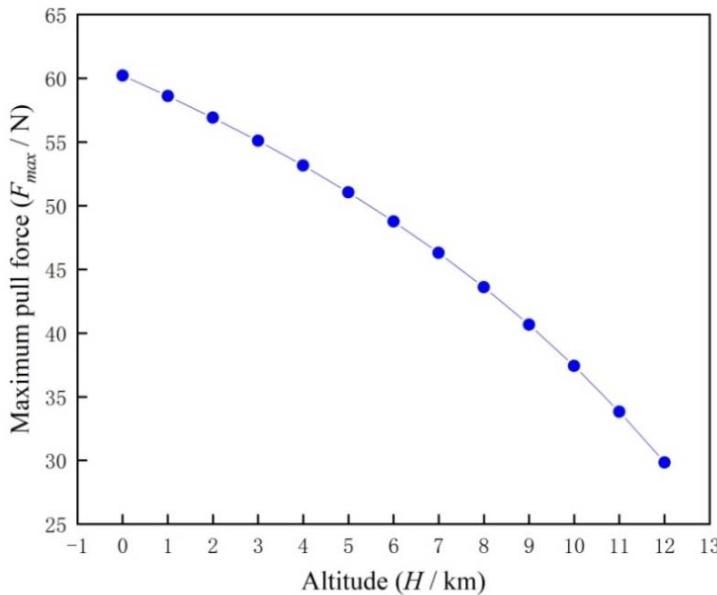 Figure 9: Relationship between altitude and maximum pulling force of single propeller
The fitting formula of the curve is obtained.
$$
F_{max} = -0.1037 H^2 - 1.0283 H + 61.071 \tag{19}
$$
Substituting the values of $F_{n}$ in Table 2 into the formula above, the obtained results are the different ceiling with different $n$, and the results are shown in Table 4.
Table 4: Ceiling of different unit number
<table><tr><td>n</td><td>Tensile demand of single propellerFn[N]</td><td>Ceiling Hmax[km]</td></tr><tr><td>1</td><td>56.64</td><td>3.25</td></tr><tr><td>2</td><td>45.59</td><td>8.22</td></tr><tr><td>3</td><td>41.48</td><td>9.65</td></tr><tr><td>4</td><td>39.15</td><td>10.40</td></tr><tr><td>5</td><td>37.81</td><td>10.82</td></tr><tr><td>6</td><td>36.78</td><td>11.13</td></tr><tr><td>7</td><td>36.05</td><td>11.35</td></tr></table>
The relationship between $n$ and the ceiling is shown in Figure 10.
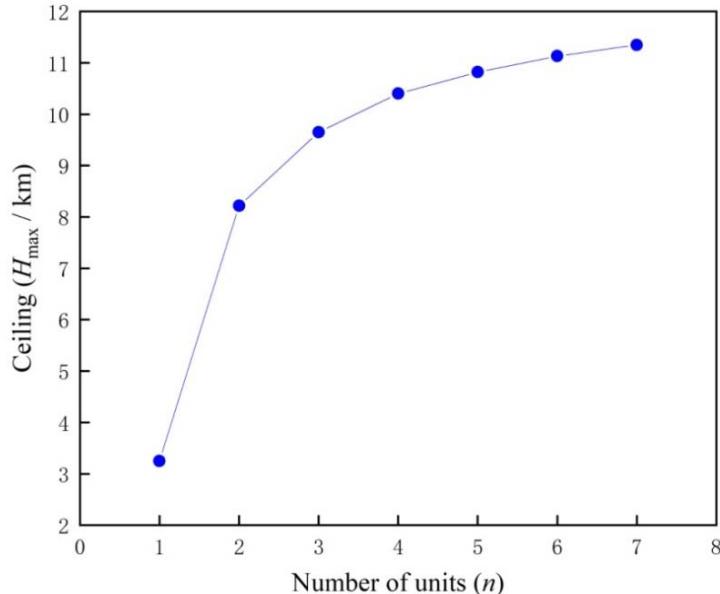 Figure 10: Relationship between $n$ and the ceiling
It can be seen that increasing the number of flight units can effectively improve the ceiling of the aircraft. The ceiling increases with the increase of $n$, while the change rate decreases.
km, the working current and flight time of the combination with different $n$ are calculated as shown in Table 5.
### c) Wingtip Connection can Increase Endurance Time
Assuming a 128 Ah 32 V power supply is used and the combination flies horizontally at an altitude of 2
Table 5: Influence on working current and flight time $1n$
<table><tr><td>n</td><td>Current [A]</td><td>Flight time [min]</td><td>Endurance improvement</td></tr><tr><td>1</td><td>29.93</td><td>256.6</td><td>0.00%</td></tr><tr><td>2</td><td>21.78</td><td>352.7</td><td>37.45%</td></tr><tr><td>3</td><td>18.97</td><td>404.8</td><td>57.76%</td></tr><tr><td>4</td><td>17.45</td><td>440.2</td><td>71.55%</td></tr><tr><td>5</td><td>16.59</td><td>463.0</td><td>80.44%</td></tr><tr><td>6</td><td>15.93</td><td>482.0</td><td>87.83%</td></tr><tr><td>7</td><td>15.48</td><td>496.2</td><td>93.37%</td></tr></table>
The relationship between $n$ and flight time is shown in Figure 11.
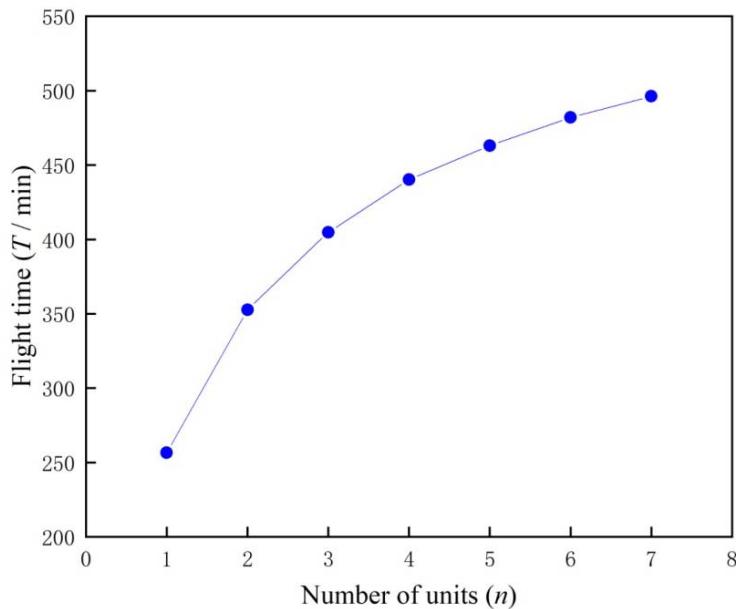 Figure 11: Relationship between $n$ and flight time
It can be seen that increasing the number of flight units can effectively improve the flight time. The endurance time increases with the increase of $n$, while the change rate decreases.
## V. RESULTS AND DISCUSSION CONCLUSION
With the rise of cluster UAVs, wingtip connection technology has been paid attention again. Wingtip connection can make the flight unit fly higher, farther and more durable.
Firstly, the theoretical analysis of wingtip connection is carried out, and two conclusions are obtained through the theoretical analysis. First, the lift-drag ratio of the combination $K_{n}$ is proportional to $\sqrt{ne_{n}}$, and the Oswald efficiency factor $e_{n}$ decreases with the increase of $n$; The second is that the cruise speed of the combination $V_{n}$ is inversely proportional to $\sqrt{C_{Ln}}$. Then, the correctness of the above two conclusions is verified by simulation. Based on this, the influence of wingtip connection on endurance performance is analysed, and the following conclusions are obtained. First, the flight altitude has little effect on the tensile demand, but tensile demand decreases with the increase of $n$, while the change rate decreases; The second is that the ceiling increases with the increase of $n$, while the rate of change decreases; Third, the endurance time increases with the increase of $n$, while the change rate decreases. Theoretically, increasing the number of units $n$ can continuously improve the flight performance of aircraft.
However, as the number of assembly units increases, the ceiling and endurance benefits brought by connection gradually decrease. In addition, large-scale wingtip connections have high requirements for control systems and connecting mechanisms. Too many units will lead to more complex control and connecting mechanisms with greater loads. Therefore, the number of wingtip connections is not the more the better.
Data Availability
The aerodynamic parameters in this paper are calculated by xflr5 v6.48, and the file has been uploaded. The file name is model.xfl.
### Conflicts of Interest
The authors declare that there is no conflict of interest regarding the publication of this paper.
#### ACKNOWLEDGMENTS
The authors are grateful for the financial support from the China Aviation Science Foundation Program (201829U8007). They would also like to thank the Aeromodelling Team of RFUE for providing support.
Generating HTML Viewer...
References
18 Cites in Article
X Wang,Z Liu,Y Cong (2020). Miniature fixed wing UAV swarms: review and outlook.
Mingjian Wu,Zhiwei Shi,Tianhang Xiao,Haisong Ang (2021). Effect of wingtip connection on the energy and flight endurance performance of solar aircraft.
C Anderson (2000). Dangerous experiments: wingtip coupling at 15,000 feet.
Amrita Chakraborty,Aaron Difilippo,Anshu Madwesh,Calvin Hong,Sheena Deivasigamani,Marius Orlowski (2002). Novel approaches to enhance electrical conductivity of nanoscale PEDOT: PSS layers.
C Montalvo (2014). Meta aircraft flight dynamics and controls.
C Montalvo,M Costello (2015). Meta aircraft flight dynamics.
Carlos Montalvo,Mark Costello (2012). Meta Aircraft Connection Dynamics.
C Collin,C Montalvo (2018). Experimental control of two connected fixed wing aircraft.
Maxwell Cobar,Carlos Montalvo (2021). Takeoff and Landing of a Wing-Tip-Connected Meta Aircraft with Feedback Control.
J Cooper,P Rothhaar (2018). Dynamics and control of in-flight wing tip docking.
S Wlach,G Balmer,M Hermann (2017). ELAHAelastic aircraft for high altitudes concept and current development state of an unconventional stratospheric UAV.
Alexander Köthe,Robert Luckner (2017). Flight Path Control for a Multi-body HALE Aircraft.
R Zhou,W Zhou,D Wang (2020). Overview of UAV link wing system technology.
Y Yang,Z Zhang,P Ying (2021). Flexible modular swarming UAV: innovative, opportunities, and technical challenges.
W Zhou,P Ma,Z Guo (2022). Research progress of combined fixed-wing unmanned aerial vehicle based on wingtip chained.
Chao An,Guixi Huo,Yang Meng,Changchuan Xie (2019). Study on Aerodynamic Characteristics and Flight Dynamics of Multi-body Aircraft.
Tommy Chen,Joseph Katz (2004). Induced Drag of High-Aspect Ratio Wings.
Z Fang,W Chen,S Zhang (2005). Flight dynamics of aircraft.
No ethics committee approval was required for this article type.
Data Availability
Not applicable for this article.
How to Cite This Article
Wei Zhou. 2026. \u201cStudy on the Influence of UAV Wingtip Connection on Ceiling and Endurance\u201d. Global Journal of Research in Engineering - D: Aerospace Science GJRE-D Volume 23 (GJRE Volume 23 Issue D1): .
Explore published articles in an immersive Augmented Reality environment. Our platform converts research papers into interactive 3D books, allowing readers to view and interact with content using AR and VR compatible devices.
Your published article is automatically converted into a realistic 3D book. Flip through pages and read research papers in a more engaging and interactive format.
The cluster UAVs have developed rapidly in recent years with the advantages of low cost, expandability and high reliability. However, due to their small size, they have the shortages of range and flight time. Wingtip connection technology, as an important way to increase the range and flight time of fixed-wing cluster UAVs, has also developed rapidly in recent years. From the theoretical analysis, it is concluded that the wingtip connection can effectively improve the aerodynamic characteristics of fixed-wing UAVs, and the conclusions are validated by vortex lattice method simulation. Based on this, the influence of the number of units on the flight performance of the combination is analysed theoretically. As the number of units increases, the combination can have higher ceiling, larger range and longer flight time.
Our website is actively being updated, and changes may occur frequently. Please clear your browser cache if needed. For feedback or error reporting, please email [email protected]
Thank you for connecting with us. We will respond to you shortly.