I. GRAPHITE/Li BATTERY THE CYCLING PROCESS MECHANISM AND PERFORMANCE DEGRADATION MECHANISM [1,2-4]
The so-called cycle is that a time charge-discharge of the battery is one cycle period, which is the imitation of the working state of the battery, in order to observe the change of the battery performance with the increase of the cycle period and explore the stability and durability of the battery performance
a) Cycle performance of graphite/Li(Ni Co Mn )O battery
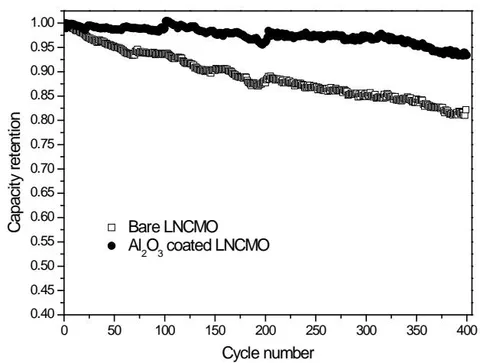
The battery is cycled at room temperature, 2C rate and , and the cycle performance curve of the whole battery is shown in figure 1.It can be seen from the figure that the coating not only greatly improves the cycle stability of the battery, but also greatly improves the cycle performance. After 200 and 400 cycles, the capacity retention rate of uncoated batteries decreased by and , respectively, while that of coated batteries was and , respectively.
b) Changes of fine structure and microstructure of positive active material during cycling
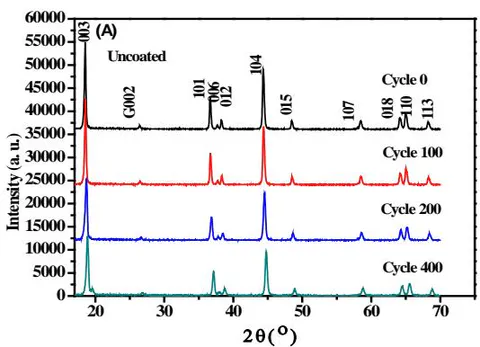
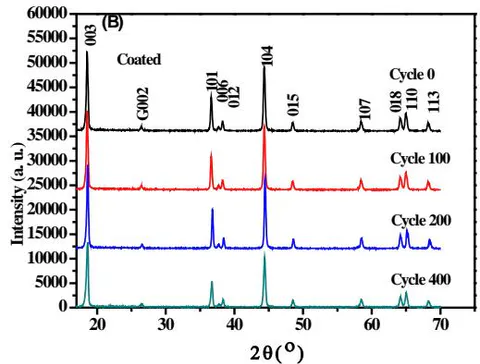
The XRD patterns of positive active materials before and after 2C charge-discharge cycle are shown in figure 2. At first glance, all the diffraction lines belong to structural , and there seems to be no change. However, after careful analysis, it is found that there are obvious changes in its fine structure.
i. Lattice parameters of positive active materials
The variation of the lattice parameters of the positive active material with the cycle is shown in figure 3. It can be seen from figure 3 that the changing trends of a and c of the uncoated positive active materials are roughly the same, but the lattice parameters of the coated positive active materials are obviously different with the decrease of the cycle, a decreases with the increase of the cycle, while c increases at first and then decreases. This shows that after 100 cycles, the proportion of remaining Li atoms in the positive active material (NCM) is higher.
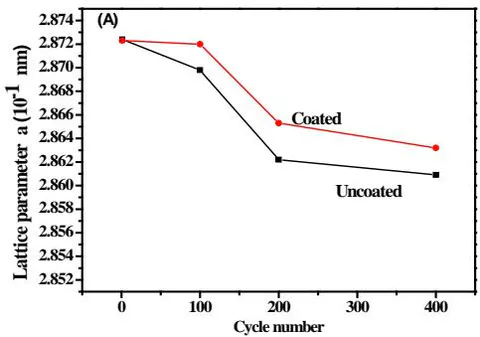
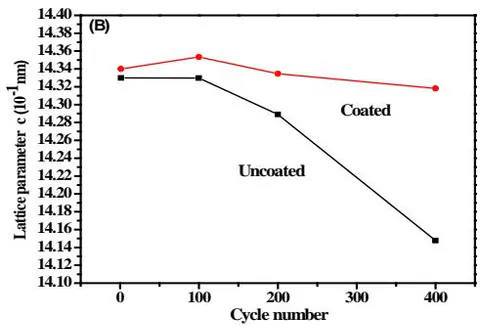
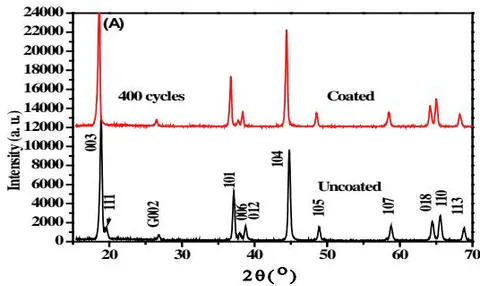
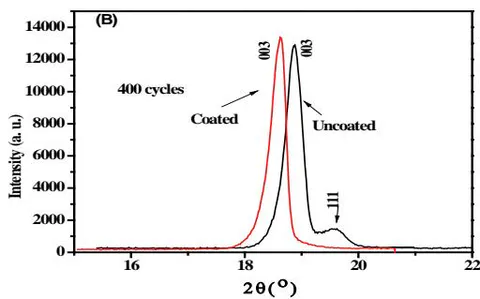
Figure 4 shows the XRD pattern of the positive active material NCM after 400 cycles of the battery, in which figure 4(A) shows the full spectrum and figure 4(B) shows the amplification near the main diffraction peak of (003). It can be seen that the (003) peak of NCM changes after 400 cycles of uncoated battery, and the 111diffraction peak of spinel appears in the uncoated material.
The spinel phase is the product of the side reaction of NCM with electrolyte, but the peak is not seen in the coated material. The phase change is mainly due to the oxygen evolution and the dissolution of transition metal compounds during the cycle, and the reaction can be expressed as follows:
Me is a transition metal element (Ni,Co,Mn). enters the liquid phase, and MeO is easily dissolved in the electrolyte, thus promoting the formation of spinel .
ii. Microcrystal size and micro-strain of positive active materials
In order to calculate the microstructure parameters of positive active material, the FWHM of 003and 104diffraction lines were measured, and the average microcrystal size and average micro-strain of the material were calculated according to the least square method of separating microcrystal-micro-strain effect. The results are shown in figure 5. It can be seen that (i) after charge-discharge cycle, the grain size is obviously refined and the micro-strain is obviously decreased, and the grain refinement of the coated cathode active material is greatly decreased; (ii) the micro-strain of the uncoated material decreases with the increase of the cycle, and finally changes from tensile strain to compressive strain, while the micro-strain of the coated material is larger than that of the uncoated material after the number of cycles is more than 100, especially the tensile strain is still maintained.
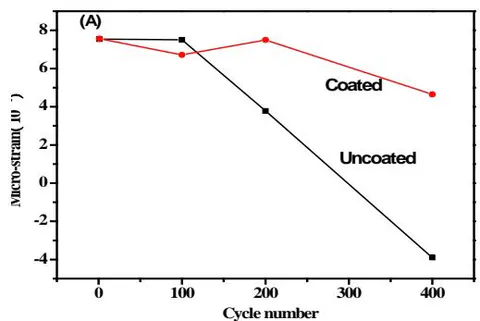
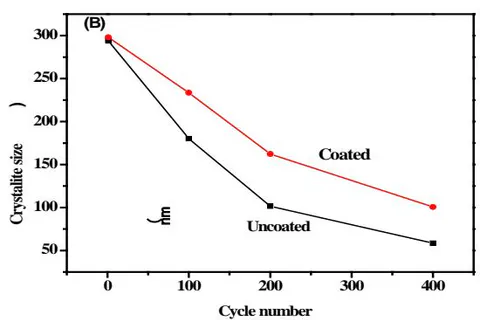
During the cycle of the battery, the strain of uncoated NCM starts to be tensile strain, which is mainly due to the fact that lithium ion enters into the lattice of NCM precursor during the crystallization process, which can be regarded as a kind of lattice expansion. With the progress of the cycle, the structure changes such as O precipitation appear in the uncoated NCM bulk phase, which leads to lattice contraction and compressive strain gradually. On the other hand, the coating can inhibit the precipitation of O, thus maintaining the state of compressive strain during the cycle. It is not difficult to see that the change law of micro-strain is consistent with the law of microcrystal refinement. This is mainly due to the accumulation and release of micro-stress caused by the change of micro-strain, which leads to the refinement of microcrystals. The coating suppresses the change of micro-strain, thus inhibiting the refinement of microcrystals.
c) Fine structure of negative active materials
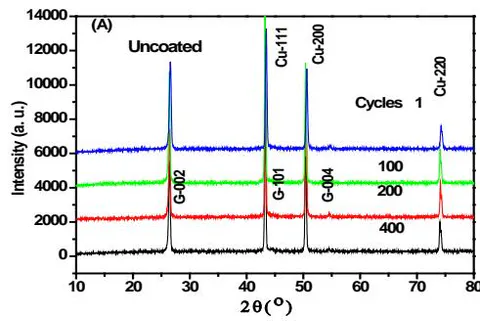
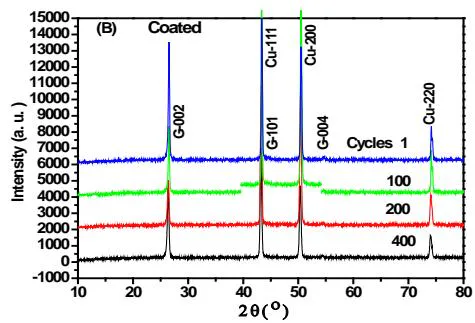
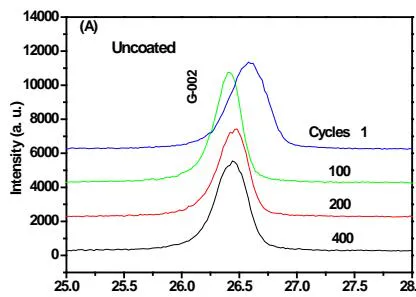
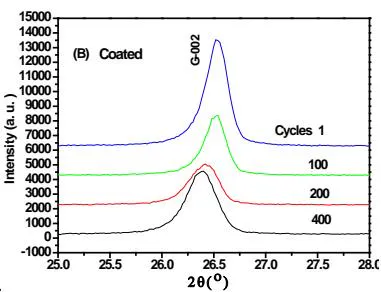
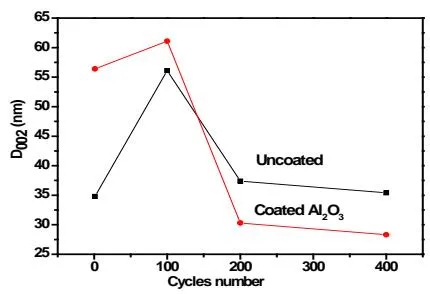
The XRD pattern of the negative plate is shown in figure 6, which is partially magnified as in figure 7. It can be seen that the diffraction peak of graphite is obviously different in both peak position and half width. Because the negative electrode plate is directly used as the sample, the diffraction spectrum includes three diffraction peaks of 111,200,220 of the current collector Cu. We also measured the grain size of the extension c-axis direction [002](see figure 8). Using Cu 111as the internal standard, the position of the 002 diffraction peak of graphite was accurately determined. According to the method [5~7], the value was determined by experiment, and the following formula was used.
Obtain and then according to Bragg formula to calculate the exact value of graphite. The distance between the crystal planes in the c-axis direction is d002, and finally press the following formula:
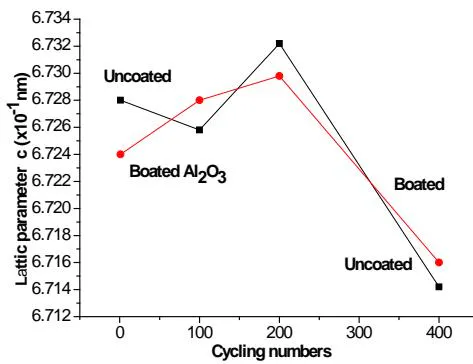
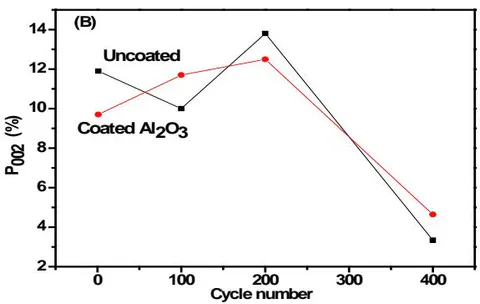
The stacking disorder degree of graphite is calculated, and the results are shown in figs. 9 (a) and (b), respectively. It can be seen that: (i) when the number of cycles is more than 100, decreases with the increase of cycles, indicating that the grains are obviously refined during the cycle; (ii) the lattice parameters c and stacking disorder of graphite change obviously with the number of cycles, but there is no obvious difference between coated and uncoated.
d) Changes in the fine structure of the diaphragm with the cycle [3]
The diaphragm of this kind of battery is composed of three layers of PP-PE-PP, PP is polypropylene film, belongs to monoclinic structure, P21
No.14 space group, PE is polyethylene, belongs to orthorhombic system, Pnam (No.62) space group. 2C the XRD pattern of the diaphragm before and after the charge-discharge cycle is shown in figure 10, in which the diffraction peaks have been indexed, it can be seen that (1) the diffraction peaks of PP-131 and PE-110, PP-111 and PE-200 overlap; and (2) the positions of amorphous scattering peaks of PP and PE are at and , respectively, indicating that the crystallinity of all samples is very high, and the amorphous part is very few; (3) the peak position shifts before and after the cycle, and the lines are obviously broadened; (4) compared with the uncoated ones, the broadening phenomenon decreases obviously.
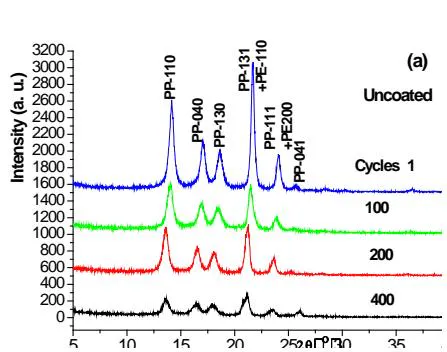
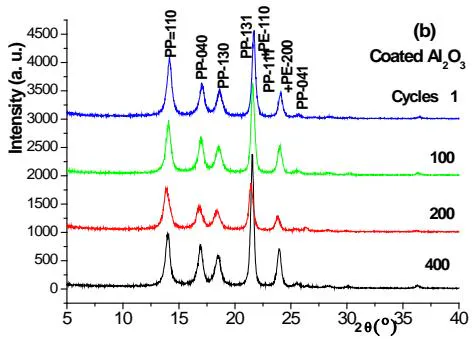
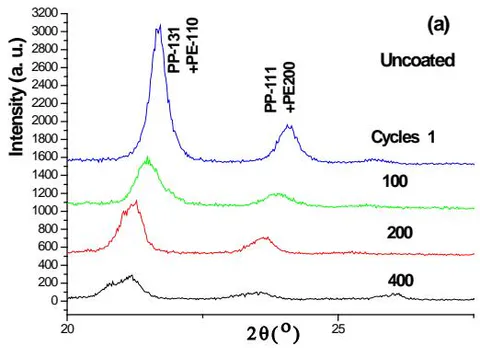
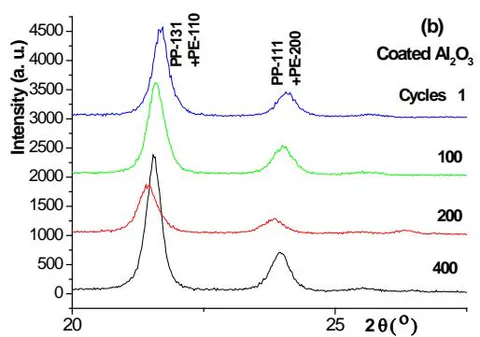
In order to investigate the situation of two pairs of overlapping peaks, the enlarged pattern is shown in figure 11, which shows that the coated and uncoated peaks are obviously different, and the latter peak displacement and broadening are much more serious; after 200,400 cycles, the PP-131 and PE-110 of the uncoated samples have obviously split, indicating that the surface of the diaphragm (PP) is seriously damaged and thinned during the cycle.
Because the diaphragm is two layers of polypropylene and one layer of polyethylene, the lattice parameters of polypropylene are calculated by using the peak position data of six diffraction peaks of PP. The results show that the three lattice parameters change with the increase of cycle, but the coated samples change more slowly than uncoated samples, an and b are smaller than uncoated ones, and c has a similar situation. This shows that the coating of positive active materials has a certain protective effect on the diaphragm.
There is an obvious difference in the broadening phenomenon of the observed diffraction peaks, especially between coated and uncoated, which indicates that there is an obvious difference in the microstructure (microcrystal size and/or micro-strain) of the diaphragm. The results show that the change of the uncoated data is irregular, but the effect of the coating is obvious: the coating of the positive active material slows down the grain refinement of the diaphragm, or the change of micro-strain is also reduced.
e) Degradation mechanism of cyclic performance of graphite/LiMeO battery
Summing up the changing rules of the cycle performance, the positive and negative active materials and the fine structure of the diaphragm, we can see clearly that no matter whether the positive and negative active materials are coated or not, the attenuation of cycle performance has a good corresponding relationship with the changes of the positive and negative active materials and the fine structure of the diaphragm during the cycle. It also shows that the coating plays an important role in improving the cycle performance and slowing down the change of the positive and negative active materials and the fine structure of the diaphragm during the cycle.
In the discussion of the degradation mechanism of cycle performance of lithium-ion Secondary battery, many researchers attribute it to the effect of electrode surface, such as the chemical corrosion of electrolyte on electrode surface and diaphragm surface and so on. Of course, this kind of corrosion can not be ignored. First, let us focus on the changes of the positive and negative active materials and the internal structure of the diaphragm during the cycle, that is, the bulk effect, and first discuss the uncoated situation, and combine the results of surface analysis.
- The positive lattice parameters a and c decrease with the increase of cycle period, indicating that there are more and more inactive Li atoms, and the grains and micro-strain of the positive active material decrease with the increase of the cycle period, and these two points are corresponding to each other. As a result, the activity of positive active materials will be reduced.
- Negative lattice parameter c and stacking disorder increase at first and then decrease with the increase of cycle period, and the cycle refines the grain. Embedding Li atoms is unprofitable. In other words, the activity of graphite decreases with the increase of cycle period. Coating can obviously slow down the process of all kinds of changes mentioned above.
- The three lattice parameters of the diaphragm change with the increase of the cycle period, especially with the increase of the cycle, the more serious the damage of the surface layer of the diaphragm. The combined action of the above three aspects is the main reason for the decline of cycle performance.
- The performance degradation mechanism of 2025 graphite/Li( ) battery was studied, which was caused by the increase of electrochemical impedance caused by the deposition of fluoride and NiO on the surface of Li( ) .
- The capacity decay mechanism of 18650 graphite/Li( ) battery was studied. The deposition of Ni, Co and Mn in the negative electrode during charge and discharge destroyed the integrity of SEI, and the regrowth of SEI film promoted the loss of active lithium during the cycle.
- The decay mechanism of the rate performance of 18650 graphite/Li( ) battery was studied, which was mainly caused by the deposition of fluoride and NiO on the surface of the positive electrode, and the electrochemical reaction impedance of the positive electrode increased faster than that of the negative electrode.
- The mechanism of coating to improve the cycle performance of material and graphite/Li battery was studied. In order to reduce the deposition of fluoride and NiO on the surface of the positive electrode, and reduce the deposition of Ni, Co and Mn on the surface of the negative electrode, respectively.
It can be seen that in addition to the bulk effect of positive and negative active materials and diaphragm materials in the cycle process, the surface effect also plays an important role. The coating not only alleviates the surface effect, but also affects the bulk effect. It can be seen that the coating of positive active materials is very effective to improve and improve the performance of lithium-ion batteries.
II. CYCLE PROCESS MECHANISM AND PERFORMANCE DECAY MECHANISM OF GRAPHITE/LiFePO4 BATTERY[1,5,6]
a) 2H-graphite/LiFePO4 battery cycle performance
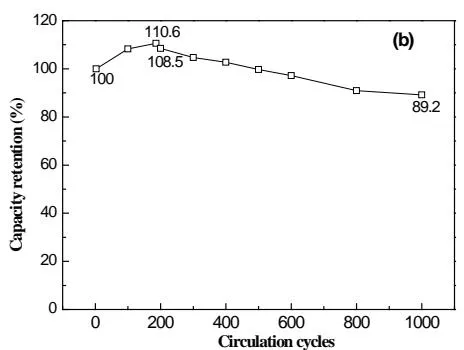
Figure 12 shows the discharge capacity curve (a) and capacity retention change (b) of 452340 2H-graphite/LiFePO4 battery under . It can be seen from the figure that the capacity increases with the increase of the cycle cycle, and its peak is at 186cycle, and then decreases slowly, until 1000 cycles, the capacity retention rate is still nearly . Specific performance data are listed in Table 1. It can be seen that both the charging capacity and the discharge capacity increase, and then decrease gradually, and the maximum value is near the cycle 200 cycle; the charging platform voltage decreases at first and then increases slightly, and the minimum value is around the cycle 200 cycle, which corresponds to the change of the charging capacity; and the discharge platform voltage also increases at first and then decreases, which is consistent with the discharge capacity rising at first and then decreasing.
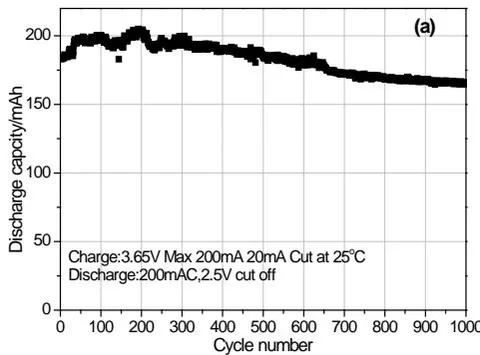
Number of cycles Charging capacity mAh Charging platform V Discharge capacity mAh Discharge platform, V 3 182.5 2.462 185.2 2.143 100 198.8 2.428 200.5 2.165 200 201.4 2.430 201.0 2.168 300 195.3 2.435 192.9 2.161 400 189.6 2.436 190.2 2.154 500 185.4 2.438 184.6 2.158 600 178.8 2.446 180.1 2.146 800 168.9 2.440 168.4 2.147 1000 164.8 2.435 165.2 2.150
b) The relationship between the variation of cycle performance and the fine structure of positive and negative electrode and diaphragm material In order to explore the relationship between cycle performance and the fine structure of positive and negative electrodes and diaphragm materials, the experimental results are summarized in Table 2. It can be
seen that the change law of cycle performance has a good corresponding relationship with the change of the relative content of in the positive electrode, the change of lattice parameters b and c, the change of disorder in negative graphite, and the change of lattice parameters a, b and micro-strain of PP in the diaphragm.
| Cycle performance | Positive active material | Negative active material | Diaphragm |
| Cycle performance and capacity retention increased at first and then decreased slowly with the cycle, with a maximum of about 200 cycles. | The relative content of LiFePO4 decreased at first and then increased with the cycle, and the maximum value was around 400th cycle. | The general change trend of stacking disorder is that it increases with the increase of cycle period. | The lattice parameters an and b of polypropylene increase with the increase of cycle period, but the change of c is irregular. |
| 1.The charge capacity and discharge capacity obtained from the charge-discharge curve increase slightly with the increase of the cycle, and then decrease gradually, and their maximum values are both around 200 cycles.2.The charging platform decreases at first, then increases slowly, while the discharge platform increases at first and then decreases. | 1. The lattice parameters c and b of LiFePO4 increase slightly at first and then decrease with the cycle, and the maximum is around 300th cycle.2. The general trend of D and ε of LiFePO4 is to increase. | 1. The parameters of graphite lattice change little with the cycle.2. The micro-structure parameters D and ε do not change much. | 1.The micro-strain ε increases with the increase of cycle period.2.After a long cycle, PP-113 and PE-110 split obviously, indicating that the surface of the diaphragm (PP) was seriously damaged and thinned during the cycle. |
c) Mechanism of cyclic performance degradation of 2H-graphite/LiFePO battery From the chemical and physical study of the charge and discharge process of 2H-graphite/LiFePO battery, it is known that there is a lag effect in the discharge process, or the asymmetry of charge and discharge, and from the study of the storage process of 2H-graphite/LiFePO battery, it is known that the storage can greatly reduce the hysteresis effect of the discharge process.
The so-called cycle is that the charge-discharge cycle is one cycle at a time, so the tested samples are in the discharge state. Because of the hysteresis effect of discharge, how to change the hysteresis effect in the cycle is the first problem that should be paid attention to. It seems that this problem can be revealed from the change of the relative content of and with the cycle and the change of lattice parameters with the cycle. If the content after the subsequent cycle is greater than that in the previous cycle, the discharge lag effect is weakened, on the contrary, the discharge lag effect is enhanced.
- After the beginning of the cycle, the relative content of increases and the content of decreases, indicating that there is more Li in the positive active materials, which increases the lattice parameters b and c of , and can provide more Li ions, so the capacity after the cycle is increased, up to about , resulting in a certain weakening of the discharge lag effect. However, when the cycle exceeds 200 to 300 cycles, the amount of Li embedded into after discharge decreases, and the lattice parameters b and c of begin to decrease, so the capacity decreases, and the discharge hysteresis effect increases until 1000 cycles, and some fluctuations may occur in the cycle.
- The diaphragm is subjected to compressive strain at the beginning of the cycle, then becomes tensile strain, and increases with the increase of the cycle, and the lattice parameters an and b increase with
the positive pole of the cycle. In the later stage, the two pairs of overlapping lines of PP and PE are obviously broadened and split. All these indicate that there are obvious changes in the diaphragm during the cycle, and reveal that: 1) the fine structure inside the diaphragm is not conducive to the passage of ions, and becomes more and more serious with the extension of the cycle, especially after 800 cycles; 2) the degree of damage to the surface of the diaphragm and the thinning of the surface PP layer become more and more serious with the increase of the cycle.
The combined effect of the above two reasons makes the cycle performance of graphite/LiFePO4 battery improve at the beginning and then gradually decline with the change of cycle cycle. Although the negative active material does not play a great role, it reflects the result of the first effect. Due to the decrease of the atomic weight of Li embedded in after discharge, in other words, there are more Li atoms dissolved in graphite, which increases the degree of disorder in graphite.
III. MECHANISM OF STORAGE PROCESS AND DEGRADATION OF STORAGE PERFORMANCE OF 2H-GRAPHITE/LIMEO BATTERY[1,7-9]
a) Storage performance of 2H-graphite/LiMeO battery[7~9]
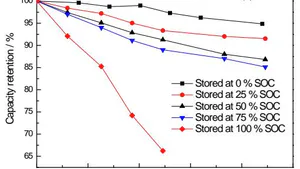
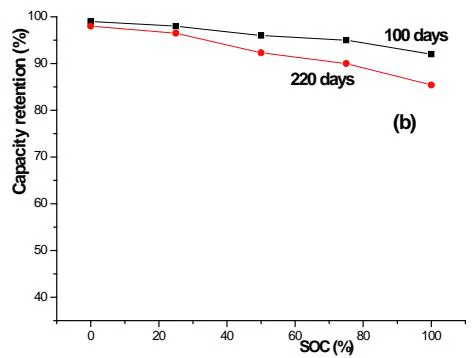
Fig.13 (a) (b) respectively shows the variation of the 0.2C (240mA) capacity of 2H-graphite/LiCoO and 2H-graphite/Li(Ni Co Mn )O batteries stored at 55 °C with different charged states. It can be found that: (I) the capacity of all batteries stored at high temperature (55°C) decays with the increase of storage days; (ii) the attenuation of battery capacity increases with the increase of the charge state during storage. The capacity decay rate of fully charged state (100%SOC) storage battery is significantly faster than that of other charged state batteries, and the attenuation is the most severe.
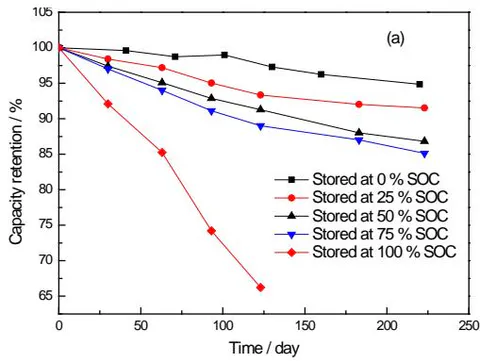
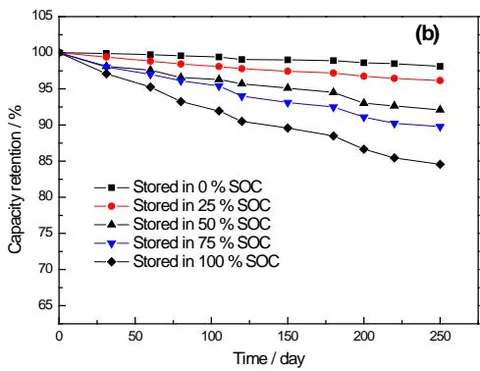
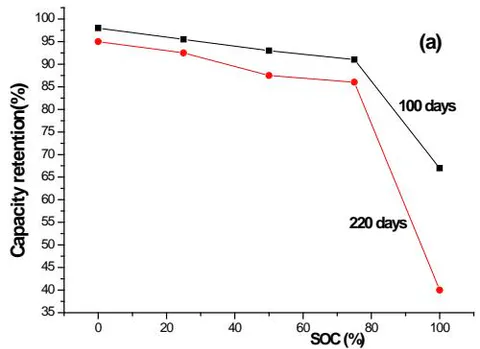
Compared with the two kinds of batteries, the storage performance of Graphite/Li( battery in full state is greatly improved. Figure 14 shows the relationship between the storage capacity decay rate and the degree of charge (SOC). It can be seen that the graphite/Li( battery can greatly improve the storage performance with high charge. These changes can be explained by the thickening of the passive film on the electrode surface after storage. The passivation film on the electrode surface is composed of the reaction products of lithium and electrolyte, and the increase of its thickness will consume the effective lithium removal amount of the positive electrode, resulting in the attenuation of battery capacity. At the same time, when diffuses between the electrode and the electrolyte, it must pass through the passivation film on the electrode surface. It has been proved that the diffusion rate of in this film is lower than that in the electrode and electrolyte. Therefore, the diffusion of in this film becomes the speed control step of the whole process. With the increase of the thickness of the film, the diffusion resistance of increases, which leads to the increase of the impedance of the electrode and the polarization of the battery in the process of charge and discharge.
b) Fine structure changes of battery positive and negative active materials before and after storage
In order to study the changes of the microstructure and surface morphology of the electrode active material during storage, the new battery and the battery stored under different conditions were discharged to 1.75V at 0.2C, so that the battery was in . In the glove box filled with argon, the battery was dissected, several positive and negative plates were removed, washed repeatedly with DMC solvent, and dried naturally. The positive and negative active materials were scraped off respectively, and the X-ray diffraction analysis was carried out on the Rigaku D/max-2200PC X-ray diffractometer. the contents of the analysis included phase structure identification, lattice parameters, microstructure and so on.
i. Microstructural changes of negative active materials before and after storage
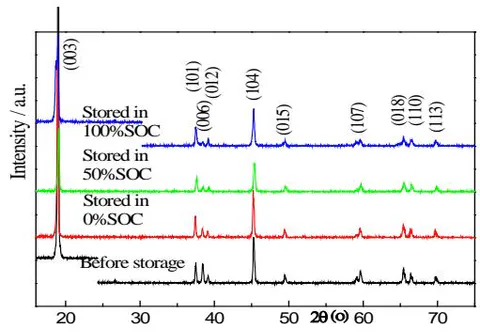
Figs.15 (a) and (b) are 2H-graphite/LiCoO battery and 2H-graphite/Li( with different charges, respectively. The XRD patterns of positive and negative active materials before and after storage at for SOC.
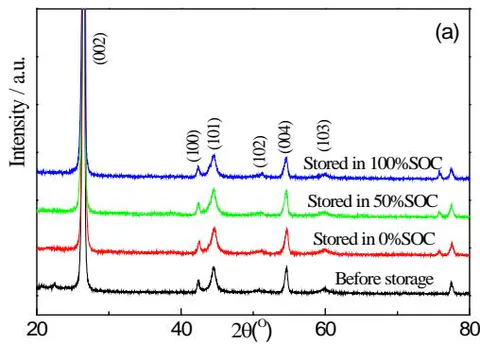
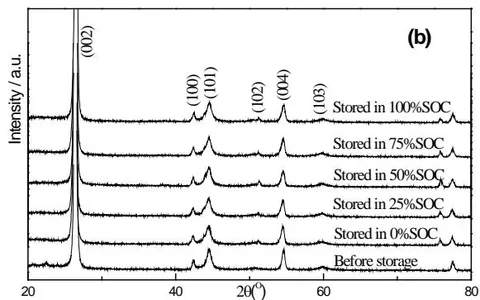
The lattice parameters, cell volume, microcrystal, microstrain and stacking fault of 2H-graphite, the negative electrode active material of graphite/LiCoO and graphite/Li(Ni Co Mn )O battery, are calculated. The results are listed in tables 3 and 4, respectively. It can be found that the test results of the two kinds of batteries are similar, and the lattice parameters of the negative active material 2H-graphite have no obvious change after storage. at the same time, except for the slight increase of micro-strain after storage, there is no obvious change in microcrystals and stacking faults, indicating that storage has no significant effect on the bulk phase structure and microstructure of negative active material graphite. This once again shows that the decline in the storage performance of lithium-ion batteries is due to the positive electrode.
| Before storage | 0%SOC after storage | 50%SOC after storage | 100%SOC after storage | ||
| Lattice parameter/Å | a | 1.4627 | 1.4538 | 1.4527 | 1.4517 |
| c | 6.7207 | 6.6960 | 6.7196 | 6.7219 | |
| Micro-structure parameter | D (nm) | 51.9 | 75.7 | 111.8 | 65.8 |
| ε(×10-3) | 0.983 | 1.350 | 1.404 | 1.400 | |
| P (%) | 40.0 | 45.6 | 51.2 | 42.4 |
Table 4: Negative active materials of graphite/Li(
) battery before and after storage at in different charged states. Microstructure parameters of 2H-graphite
| Before storage | 0%SOC storage | 25%SOC storage | 50%SOC storage | 75%SOC storage | 100%SO C storage | ||
| Lattice parameter Å | a | 1.4496 | 1.4486 | 1.4534 | 1.4520 | 1.4650 | 1.4528 |
| c | 6.7115 | 6.7233 | 6.7338 | 6.7256 | 6.7213 | 6.7331 | |
| Micro-structure parameter | D (nm) | 84.5 | 72.8 | 68.4 | 88.7 | 79.5 | 95.8 |
| ε(×10-3) | 1.087 | 1.051 | 1.115 | 1.312 | 1.089 | 1.554 | |
| P (%) | 45.1 | 54.2 | 45.9 | 52.8 | 51.2 | 48.7 |
ii. Microstructural changes of cathode active material before and after storage[3]
Figure 16 shows the XRD map of the positive and negative active material before and after storage at for 100 days. It can be seen from the figure that there is no obvious change in the diffraction peak position of the positive active material before and after storage, but it still clearly shows the characteristic peak of , but the relative intensity of some peaks has changed. For example, the intensity of the peak is very high before storage, but its intensity decreases greatly after high temperature storage, which indicates that the phase structure of the material does not change after storage. At the same time, it is found that some of the XRD peaks (such as 003,101) of the positive active material LiCoO2 are broadened after high temperature and high charge storage. At the same time, it can be found that the X-ray diffraction peak shape and position of the negative active material are almost the same before and after storage, indicating that the bulk phase structure does not change after storage, but its fine structure changes. Tables 5 and 6 show the half-height widths and calculated results of (003), (101) and (104), respectively. It can be seen that the crystallite size decreases greatly with the increase of SOC, while the micro-strain changes from tensile strain to compressive strain after storage, and the compressive strain increases with the increase of SOC.
hkl before 0%SOafter storage 50%SOafter storage 100%SOafter storage 003 Half 0.134 0.161 0.206 0.364 101 peak 0.146 0.148 0.196 0.173 104 width(°) 0.153 0.154 0.195 0.204
Table 6: Lattice parameters, microcrystals and micro-strain of positive active material
before and after storage in different charged states
| Before storage | 0%SOC after storage | 50%SOC after storage | 100%SOC after storage | ||
| Lattice parameter (Å) | a | 1.8156 | 1.8126 | 1.8119 | 1.8123 |
| c | 14.0159 | 12.9975 | 12.9604 | 14.0072 | |
| Micro-structure parameter | D (nm) | 336.1 | 116.9 | 67.2 | 19.4 |
| ε (×10-3) | 0.269 | -0.187 | -0.352 | -2.447 |
c) Microstructural changes of positive active material before and after storage [9]
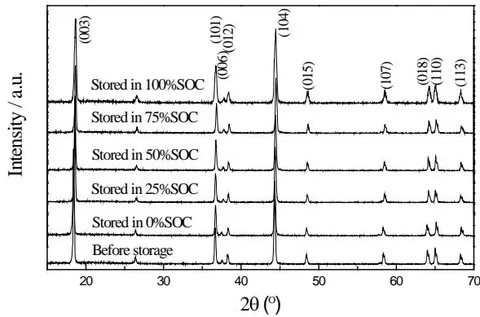
Figure 17 shows the XRD diagram of the positive active material before and after storage at for 250d at different charge states (SOC) of the battery. It can be seen from the figure that there is no obvious change in the diffraction peak position of the positive active material before and after storage, but the characteristic peak of is still clearly shown, which indicates that there is no new phase in the positive active material after storage, and its bulk phase structure does not change. However, after careful observation, it is found that the relative intensity of the diffraction peak of the sample seems to have changed slightly before storage, and some of the diffraction peaks have been broadened, which indicates that the fine structure of the sample may have changed after storage. The calculation results of the microstructure parameters are given in Table 7, which shows that the law of the microstructure parameters is similar to that of , but the change rate slows down obviously.
graphite/LiNi1/3Co1/3Mn1/3O2battery Before storage 0%SOC after storage 25%SOC after storage 50%SOC after storage 75%SOC after storage 100%SOC after storage Lattice parameter (Å) a 1.8610 1.8665 1.8661 1.8685 1.8643 1.8689 c 14.2736 14.2720 14.3151 14.3127 14.4502 14.4196 Microstructure parameter D (nm) 239.2 208.7 181.6 165.5 121.3 95.4 ε (×10-3) 0.2367 -0.1367 -0.1439 -0.2984 -0.468 -0.9641
It is found that for lithium-ion battery positive active materials containing Ni, such as , Li and , etc., due to the small difference between the radius of ions of and , the phenomenon of cation mixing is easy to occur in these materials, that is, some at 3a site and at 3b site change their positions. Once enters the 3b site, it loses its deintercalation activity. Therefore, the mixed discharge of cations directly disturbs the detachment and intercalation of in the process of charge and discharge, resulting in the decline of the electrochemical performance of the materials [7]. It is considered that the phenomenon of cationic mixed discharge may occur in the synthesis stage and charge-discharge cycle stage of the material, and this phenomenon may also occur in the storage stage of the battery due to the thermal vibration of lithium-nickel and the spontaneous reintercalation of lithium ion. Therefore, it is necessary to determine the crystallographic occupation of Li and Ni in before and after storage.
At present, based on the comprehensive study and analysis of the main diffraction characteristics of this kind of Ni-containing materials, we propose a new simulation method, that is, according to the addition and subtraction relationship of the contribution of 3a and 3b atoms to the diffraction intensity of each hkl crystal plane, we propose to use the diffraction integral intensity ratio of additive and subtractive lines to study the crystallographic occupation of Li and Ni in this kind of materials. The method for calculating the mixed occupancy parameter of is briefly introduced below[10,11].
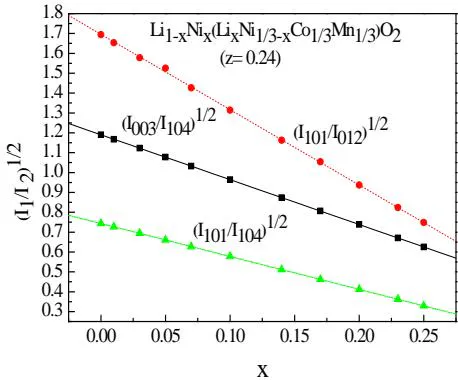
According to the mixed occupancy model of , it is simulated with the help of Powder Cell1.0 calculation program. The curves of the relationship between the strength ratio , , or , , and the mixed space occupying parameter are calculated, as shown in figure 18. It can be seen from the diagram that the relationship between and the mixed parameter is a straight line, so the corresponding mixed occupying parameter can be calculated, as shown in Table 8.
It shows that the synthesis process of this material is excellent, so it can be seen from the previous experiments that the performance of this material is also superior. After storage, the mixed space occupying parameters of the materials increase with the increase of SOC. This shows that the mixed discharge of cations occurs in the positive active material after storage, and the amount of lithium-nickel ions mixed discharge increases with the increase of the charge state of the battery during storage. This phenomenon can correspond to the decline of the performance of the positive electrode and the whole battery after storage. The results show that the performance attenuation of positive active material after storage is related to the increase of cationic mixed.
Before storage 0%SOC storage 25%SOC storage 50%SOC storage 75%SOC storage 100%SOC storage I101 4964 4967 5247 5129 5367 13277 I104 8910 9151 10086 10529 11549 31423 I101/I104 0.5571 0.5428 0.5202 0.4871 0.4647 0.4225 x 0.0076 0.0136 0.0233 0.0378 0.0479 0.0676
d) Corresponding relationship between storage performance and fine structure of battery materials
Summarizing the previous research results, the The law change of performance changes for 2H-graphite/LiCoO lithium-ion battery and 2H-graphite/Li(Ni Co Mn )O battery before and after storage are obtained.
It is found that the capacity, charge-discharge performance, cycle performance, power characteristics and safety of the battery stored at high temperature . All the properties attenuate, and the degree of attenuation attenuates with the increase of storage days, and the attenuation rate increases with the increase of charged state.
After storage at room temperature (25 °C), the performance decay law of the battery is the same as that of 55°C storage, but the attenuation rate decreases obviously Slow.
After storage at low temperature , the performance of the battery did not decrease obviously.
The storage temperature and the charge state of the battery have great influence on the storage performance of the battery. Performance retention of battery. The relationship between storage temperature, DC internal resistance increase rate and temperature is consistent with the described exponential relationship, and the relationship between battery performance retention rate and charge (SOC), DC internal resistance increase rate and storage charge state is also consistent with this exponential relationship.
It can be seen that graphite/Li( ) battery is better than graphite/LiCoO battery in all aspects.
Summarize the previous results and compare the changes of positive and negative active materials and diaphragm structure of graphite/LiCoO lithium ion battery and graphite/Li(Ni Co Mn )O battery before and after storage.
The main results are as follows:
- Change of the microcrystal size and micro-strain of negative active materials change irregularly with the increase of storage charge after storage.
- In the positive active material, D becomes smaller after storage and refines with the increase of storage SOC, and the positive electrode is subjected to tensile stress after storage. It changes into compressive stress and increases with the increase of storage SOC, and the increase rate of LiCoO2 is much faster than that of Li(Ni Co Mn ) O . The mixing parameter x of Ni and Li in Li (Ni Co Mn )O becomes larger after storage and increases with the increase of SOC.
- SEI film is formed on the surface of negative electrode and thickens with the increase of SOC, but the SEI film of graphite/Li (Ni1/3Co1/3Mn1/3) O2 battery has obvious concavity and convexity.
- Passivation film is also formed on the surface of positive electrode, and the surface of LiCoO2 is relatively dense. The surface of O2 is not dense, and the content of F in the film of the former medium battery is much larger than that of the latter.
- The effect of the diaphragm on the negative side of the storage is not obvious, but the storage has a great influence on the diaphragm on the positive side, especially on the positive side of the graphite/LiCoO battery.
By connecting the above two five points, it can be found that there is a good corresponding relationship between the storage performance attenuation and the fine structure of the electrode active material, especially with the fine structure change of the positive active material and the damage of the diaphragm on one side of the positive electrode.
e) Discussion on the decay mechanism of storage performance of battery
To sum up, the mechanism of storage performance degradation is discussed as follows: there are two functions of the battery during storage: (1) self-discharge of the battery; (2) Chemical/electrochemical interaction between the electrolyte and the positive and negative electrode surfaces and the two surfaces of the diaphragm. Let's first discuss the self-discharge effect.
- In the process of storage, the battery will self-discharge. This leads to obvious changes in the fine structure of the battery materials, including positive and negative active materials and diaphragms, and makes the microcrystal refinement and micro-strain of positive active materials change from tensile strain to compressive strain, which obviously affects the de intercalation behavior of Li ions in the process of battery charge and discharge after storage, and causes a larger potential barrier for Li ion de intercalation, which hinders the de intercalation of Li ions, which shows the increase of DC internal resistance and the decrease of capacity.
- This self-discharge phenomenon becomes more and more serious with the increase of the percentage of charge during battery storage. With the increase of the degree of battery charge, the grain refinement rate of the positive active material is accelerated, and the compressive strain increases rapidly, so the capacity decreases rapidly. The internal resistance also increases rapidly, so the performance change decays faster with the increase of the degree of charge, especially in the case of high charge.
- The higher the storage temperature, the more serious the spontaneous discharge. At low temperature , the performance attenuation is linear with a small slope, and at high temperature , it attenuates exponentially.
- Graphite/Li( and graphite/ batteries have the same negative electrode, different positive active materials, and different self-discharge effect during storage. The self-discharge phenomenon of the former battery is smaller than that of the latter battery, so the storage performance of the former battery is better than that of the latter. This is due to the fact that the fine structure of the negative active material does not change much, but there are obvious changes in the fine structure of the positive electrode and the tissue structure of the surface film. The grain refinement rate of in 2H-graphite/LiCoO battery is faster than that of in 2H-graphite/Li(Ni Co Mn ) O , and the compressive strain of in 2H-graphite/LiCoO battery is much larger than that of in 2H-graphite/Li(Ni Co Mn ) O .
Now the chemical/electrochemical interaction between electrolyte and positive and negative electrode surface and diaphragm surface is investigated.
The experimental results show that compared with the two kinds of batteries, the surface morphology of the negative electrode and the diaphragm on one side of the negative electrode do not change much, and there is no significant difference between the two kinds of batteries. However, the surface morphology and composition of the positive electrode are obviously different, the morphology of the diaphragm on one side of the cathode is also different, the content of F on the surface of is also higher, and the damage of the diaphragm on the positive side is also greater, so the graphite/Li battery is superior to the graphite/Li battery in terms of capacity, cycle performance, storage performance and rate performance. This superiority is shown in the effect of storage charge and storage temperature.
In order to understand more clearly the effect of the change of the specific capacity of positive and negative electrodes on the capacity of the battery after storage, the capacity change rate of 0.20C of graphite/Li( ) battery and positive and negative electrodes after storage was calculated. The results are shown in Table 9.
| Capacity change rate /% | |||
| SOC/% | Full battery | Li(Ni1/3Co1/3Mn1/3)O2 | graphite |
| 0 | 98.10 | 98.44 | 99.21 |
| 25 | 96.05 | 96.02 | 98.06 |
| 50 | 91.03 | 91.03 | 94.46 |
| 75 | 89.71 | 89.71 | 91.41 |
| 100 | 84.49 | 84.49. | 87.32 |
It can be seen from Table 15 that the capacity decay rate of battery, positive and negative electrodes after storage increases with the increase of SOC during storage. The capacity decay rate of the negative electrode is slower than that of the positive electrode, and the change of the positive capacity is very close to that of the battery capacity. It can be seen that after storage, the capacity attenuation of positive electrode is larger, which is close to that of the whole battery; at the same time, the impedance increases, the dynamic performance decreases, and the performance attenuation of graphite negative electrode after storage is small. This shows that the performance attenuation of the battery after storage is mainly due to the positive electrode. The reason for the performance degradation of the battery after storage is that the in the electrolyte is decomposed during storage, and the resulting HF erodes , resulting in capacity attenuation, and high impedance deposits such as LiF are formed on the surface of the positive electrode, which increases the impedance and decreases the dynamic performance.
It can be seen that in the lithium-ion secondary battery with graphite as the negative active material, the positive active material is the core and key of the problem in terms of increasing the capacity, improving the cycle performance and improving the storage performance. Therefore, the positive coating is advantageous [9].
IV. STUDY ON THE MECHANISM OF STORAGE PROCESS AND ENERGY DECAY OF GRAPHITE/LiFePO4 BATTERY[1,12,13]
a) 2H-graphite/LiFePO battery storage capacity
Figure 19 shows the change curve of capacity of 2H-graphite/LiFePO battery during storage at . It can be found that the charge state of the battery also has a great influence on the storage performance of the lithium-ion battery with lithium iron phosphate as the cathode. However, it can be found that, different from the other two positive active materials, the capacity of 2H-graphite/LiFePO battery does not decay monotonously with the extension of storage time. As can be seen in figure 19, the capacity of the battery increases at first and then decays during SOC storage, and this phenomenon is most obvious in SOC storage, when the storage time reaches 135d. Its capacity reached the highest value (increased to of the original capacity). The capacity of the battery stored at and SOC decreases with the extension of storage time, but it can be found that the capacity decay rate of the battery with the other two positive active materials is also greatly reduced, and the capacity of the battery stored for 260d only attenuates and of the original capacity.
b) Structural changes of during charge and discharge of 2H-graphite /LiFePO battery before storage
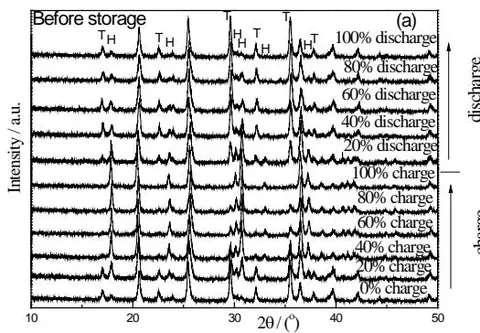
Figure 20 (a) shows the XRD spectrum of the positive active material in several stages of the charge and discharge process before and after battery storage.
The spectrum is indexed by and with orthogonal structure, represented by the letters T and H, respectively. It can be found that in the charging process, with the increase of charging depth, the content of phase gradually decreases, while the content of increases gradually; when the charge reaches , there is still a trace of , and until the charge reaches , the peak of phase in the XRD spectrum completely disappears. During the discharge process, appears at of the discharge, and its content increases with the increase of the discharge depth, up to of the discharge, it is dominated by phase, but. There is still a certain amount of . It can be seen that there is a phase transition of in the positive active material during the charge-discharge process. At the same time, it is found that after the formation of the battery, even the discharge positive active material is not a single phase of , but contains a small amount of phase.
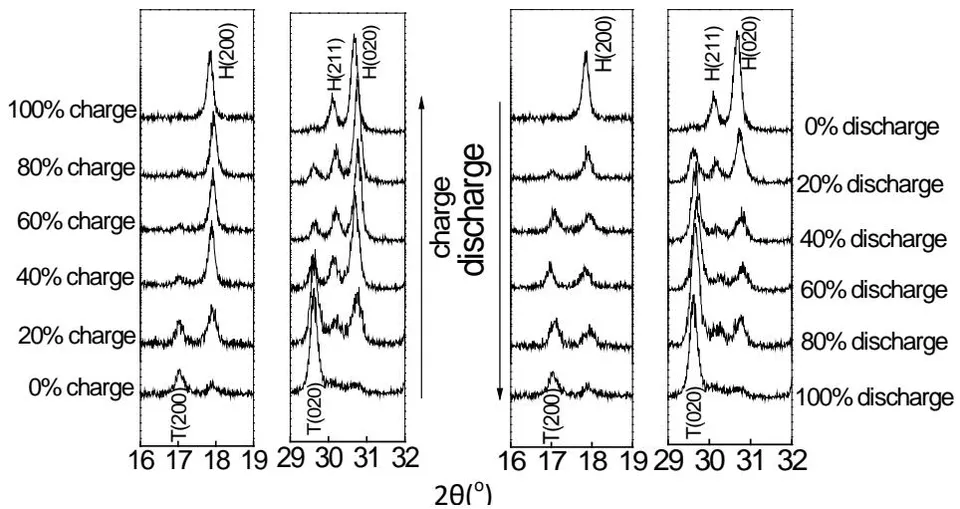
c) Structural changes of during charge and discharge of 2H-graphite/LiFePO battery after storage
The structural change of the positive active material of unstored graphite/LiFePO battery during the charge-discharge process has been studied previously. It is found that the discharge process has an obvious lag compared with the structural change during the charging process, so will the structural change change during the charge-discharge process after storage?
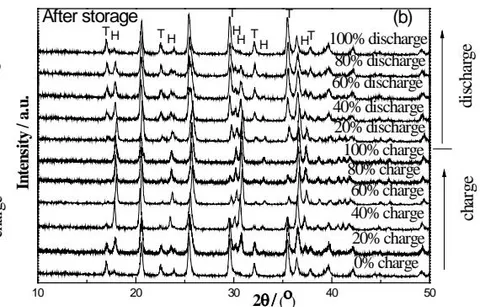
Figure 20(b) shows the XRD pattern of the positive active material at the typical stage of charge and discharge of graphite/LiFePO battery before storage and 135d after SOC storage in . From the diagram, it can be found that, similar to that before storage, the structure of positive LiFePO changes regularly during the whole charge and discharge process. With the increase of charging depth, the intensity of FePO peak increases, the intensity of LiFePO peak decreases, and the discharge process is opposite. From the surface, it is difficult to see the difference in the law of structural change before and after storage. However, by careful comparison, it can be found that the intensity ratios of FePO and LiFePO
peaks in the diffraction patterns with the same chargedischarge state before and after storage are different, which seems to say that.
After bright storage, the hysteresis of the phase change of positive active materials changed during the charge-discharge process.
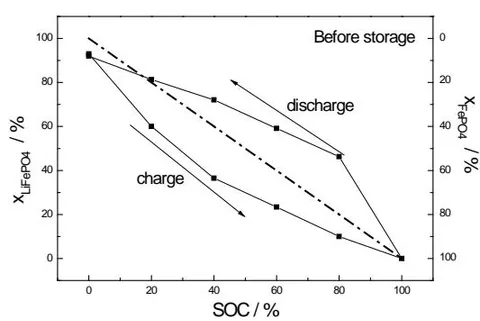
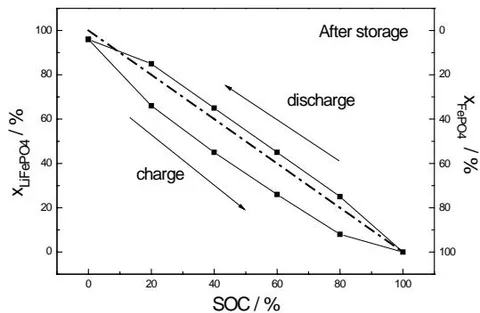
In order to further analyze the difference of hysteresis of phase transformation of positive active materials before and after storage, The relative contents of and LiFePO4 in positive active materials at each stage of charge and discharge were quantitatively calculated by Zevin's non-standard sample method. The following formula has The relative integral intensities of the two phases in the XRD diffraction spectra of each charge-discharge state are obtained by fitting the Jade6.5 software and substituted into the equation group (1). By solving them, the relative contents of and in the positive active materials in each charge-discharge state can be obtained. The results are shown in figure 22. It can be seen from the figure that before storage, even in the discharge state, the positive active material is not entirely phase, in which there is a small amount of phase (calculated to be about ), due to the low ion conduction capacity of LiFePO4 material itself.
The first charge is caused by the formation of an inactive shell. However, it can be found that after 135days of storage in SOC, the content of phase in the positive active material decreased to about when it was in the discharge state, indicating that the inactive shell was reduced after storage. Comparing the curve of the relative content of and phase with the depth of charge and discharge before and after storage (the dotted line in the figure is the ideal curve of the relative content of and phase during charge and discharge (the equation is ), it can be found that before storage, the increase rate of phase content at the beginning of charge is obviously higher than the ideal value, and the disappearance rate of phase at the beginning of discharge is also significantly higher than the ideal value. There is an obvious difference in the content change of the two phases in the charge-discharge process, indicating that there is an obvious lag in the structural change of the cathode material in the charge-discharge process, and the reason for this phenomenon has been explained earlier. However, the change curve of the two phases after storage is close to the ideal curve, which indicates that the lag is reduced after storage. At the same time, in the XRD diagram of the positive electrode in the full state, because the is covered by the peak of , the content of cannot be calculated, so the content of in the fully filled state is , but this does not mean that the cathode is completely FePO4 phase at this time. By calculating the unit cell parameters of FePO4, it can be found that before storage, the unit cell volume of phase is , and after storage, the unit cell volume is and the given by the standard PDF card. It can be understood that when the cell volume of the positive pole is larger than the standard value before storage, it is due to the existence of undetached Li in the positive electrode, while when the fully charged state is stored, the content of undetached Li in the positive electrode decreases, which makes the cell volume decrease, close to the standard value. This shows that the content of unexfoliated Li in the positive electrode after storage decreases when it is in the full state, that is, the content of inactive mentioned above decreases. The above phenomena indicate that there may be some changes in the positive active material during the storage of graphite / battery with SOC, which leads to the decrease of the hysteresis of the phase transition of the positive active material, the inactive phase in the discharge material and the inactive content in the fully charged material.
d) The relationship between the performance change of 2H-Graphite/LiFePO Battery and the Fine structure change of Battery active material
- In order to reveal the law of storage performance decline, it is not difficult to summarize the results of 4.1-4.3:
After storage at high temperature , the storage performance of graphite/LiFePO battery is also higher in the charged state of the battery. Great impact, similar to the above-mentioned lithium cobalt and ternary material batteries.
However, the difference is that the capacity of graphite/LiFePO battery increases at first and then decreases during 25%~75%SOC storage, and this phenomenon is the most obvious during 50%SOC storage; during storage, the highest point of battery capacity appears at 135d, at which time, the power performance and safety of the battery have been improved to some extent. During storage at 0% and 100%SOC, the capacity of the battery decreases with the extension of storage time, but its capacity decay rate is also much lower than that of the other two types of batteries.
After storage, the capacity change rate of the positive electrode and the whole battery is very close. At the same time, the impedance of the positive electrode of the battery decreases and the dynamic performance improves after SOC storage, while after and SOC storage, the impedance of the positive electrode of the battery increases and the dynamic performance decreases, which is consistent with the performance change of the battery, indicating that the positive electrode plays a decisive role in the performance change of graphite / battery after storage.
The surface morphology of electrode after storage was observed, and the composition was determined. It was found that, similar to lithium cobalt oxide and ternary materials, a small amount of fluorine-containing precipitates also appeared on the surface of particles after storage, which was the main reason for the decline of battery performance after storage at and SOC. At the same time, it was found that microcracks appeared in the particles of positive active materials after SOC storage. It is found that this phenomenon has a lot to do with the improvement of battery performance after storage
There is an obvious hysteresis effect in the phase transition of positive active material during charge and discharge before storage, but this hysteresis effect is greatly reduced after storage.
During the charged storage of , the two phases of and coexist in the material particles, and there is a volume difference between the two phases. The internal stress on the interface makes the grains of the two phases split along the interface direction, which leads to cracks. The crack will produce a fresh interface and make the inactive core which originally exists in the active material particles have lithium removal activity again, so the dynamic performance of the positive electrode is improved and the capacity is increased; at the same time, the particle size will be reduced after cracking, which leads to the lag of phase transition of the cathode material during charge and discharge after storage.
e) Discussion on the mechanism of storage performance change of battery
The self-discharge and the chemical/electrochemical interaction between the positive electrode surface, the negative electrode surface, the two surfaces of the diaphragm and the electrolyte also occur during battery storage, which can solve the change of and SOC storage performance. However, the storage performance of to of the charge cannot be explained, which is discussed below.
As mentioned earlier, when the electrode is not transformed into single-phase, after the first charge, the single-phase is transformed into two-phase , and then the residual phase appears in the electrode after discharge. This phase can not be reversibly deintercalated lithium in the subsequent charge-discharge cycle, thus reducing the capacity of the battery. When the battery is stored in the charged state, the two phases of coexist in the positive electrode. It is found from the manual that LiFePO4 belongs to the orthorhombic, Pnma (No.62 space group of lithium iron phosphate, while belongs to the orthorhombic Pmna (No.62) space group of ferromanganese. The lattice parameters are listed in Table 10.It can be seen that the lattice parameters of and are quite different. The an and b values of are larger than those of , but the c values are smaller.
| Lattice Parameters/Å | |||||
| a | b | c | V | (VT-VH)/VT | |
| LiFePO4 | 6.018 | 10.34 | 4.703 | 292.65 | 0.00% |
| FePO4 | 5.824 | 9.821 | 4.786 | 273.75 | -6.46% |
After calculating the cell volume of the two phases, it is found that there is a large volume difference between the two cells, and is larger than . From the lithium removal model of charge and discharge process proposed by Andersson [8], it can be known that the value is greater than , and its c value is less than . After calculating the cell volume of the two phases, it is found that there is a large volume difference between the two cells, and is larger than . From the lithium removal model of charge-discharge process proposed by Andersson [8], it can be known that in the charged particles, and form continuous phases with layered or mosaic distribution, respectively, so that the volume difference between the two cells will be further accumulated, resulting in a larger volume difference between the two phases, when a sharp interface will be formed between the two phases, and there is a strong internal stress on the interface. In the process of storage, the interface stress will split the two-phase grains along the interface direction, resulting in cracks. The crack will produce a fresh interface, so that the inactive core that originally exists in the active material particles will be exposed and come into contact with the electrolyte, thus making it have lithium removal activity again, so that the positive electrode will have a new discharge platform after storage. To increase the capacity of the battery. The appearance of the fresh interface will increase the electrochemical reaction activity of the electrode, reduce the RCT, of the positive electrode as shown in Table 20.3, and improve the kinetic performance of the electrode, thus reducing the polarization of the battery during charge and discharge (especially at high current). At the same time, the cracking of the particles will reduce the particle size and shorten the diffusion path of lithium ions in the material, so that the thickness of the FePO4 (charging) and (discharging) phases preferentially formed in the outer layer of the particles is reduced during the charge and discharge process, so that the blocking effect on the X-ray diffraction of the inner (charging) and (discharge) phases is reduced in the X-ray diffraction experiment, so that the barrier effect on the X-ray diffraction of the inner (charging) and (discharge) phases is reduced. After storage, the hysteresis or asymmetry of the phase change in the charge-discharge process was observed in the XRD pattern of the positive active material.
At the same time, it can also be found that when the battery is , the ratio of to in the positive active material is about 1 , the interface between the two phases in the positive electrode is the largest, the particles of the positive active material have the most microcracks after storage, and the fresh surface area inside the particles is the largest, so the battery performance is improved the most after storage. When the battery is and , the ratio of two-phase content in the positive active material is about 3:1 and 1v3, and the interface area between the two phases in the two-electrode active material is similar, but smaller than that in the positive active material, so the improvement of battery performance is small after storage.
However, when the battery is stored at or , the positive active material is basically single-phase, so the particles will not crack. At this time, the interaction between the electrolyte and the positive active material leads to the deposition of F-containing material on the cathode surface, thus changing the surface characteristics of the positive electrode becomes the main factor affecting the performance of the electrode. therefore, after storage at or , the positive electrode impedance increases and the dynamic performance decreases. This results in a decline in the performance of the battery.
Comparing the storage performance of three different positive active materials, graphite/LiCoO , graphite/Li(Ni Co Mn )O and graphite/LiFePO , it can be found that the capacity decay of graphite/LiFePO battery is the slowest in the process of storage, the performance decline is the smallest after storage, and the storage performance is the best, and the storage performance can be improved when the charge is 25% to 75%, especially when the charge is 50%.
V. THE METHOD AND ACTION MECHANISM OF IMPROVING THE PERFORMANCE OF LITHIUM-ION BATTERY [17]
According to the above understanding of the relationship between the changes of charge-discharge performance, cycle performance, storage performance and the structure of battery positive and negative active materials, also experimentally studied the methods to improve battery performance, and studied the effect and mechanism of these methods. Here is only a brief introduction.
As far as positive active materials are concerned, there are positive additives, coating, doping, nanometer of materials, etc.
As far as the anode materials of lithium-ion batteries are concerned, most of the commercial anode materials for lithium-ion batteries use a variety of lithium-intercalated carbon materials, such as artificial graphite or mesophase carbon microspheres (MCMB). However, there are still some shortcomings when used as anode materials for lithium-ion batteries, such as low first charge and discharge efficiency, and the potential of carbon material is very close to that of lithium metal. Metal lithium may precipitate on the surface of carbon electrode to form lithium dendrite and cause short circuit, obvious voltage lag with electrolyte, complicated preparation method and so on. Compared with carbon negative electrode materials, alloy anode materials have higher specific capacity, but alloy electrodes have large volume effect in the process of repeated intercalation and stripping of lithium, so the cycle performance is poor. Compared with the above anode materials for lithium-ion batteries, spinel lithium titanate shows its unique advantages as anode materials for lithium-ion batteries[14,15].
In the single solvent DMC electrolyte system, the oxidation potential of several lithium salts changes according to the following law: LiPF6 > LiBF4 > LiAsF6 > LiClO4; in EC/DMC electrolyte system, the electrical conductivity decreases in the order of LiAsF6 ≈ LiPF6 > LiClO4 > LiBFO4. In order to further improve the low temperature performance of lithium ion battery, Zhangjiagang Guotai Huarong 5160A electrolysis is used as low temperature co-solvent (PA). Its core is to reduce the content of EC in the electrolyte system and get better results [16].
Although various methods have been mentioned above to improve the performance of color recording battery, there are many researches on positive active materials because they play a leading role in the performance degradation. It plays a leading role, so there are many researches on positive active materials.
a) Summary of research on additives
Based on the research in this area, the following main conclusions are drawn.
- As an additive, can inhibit the decline of capacity and charge-discharge performance during storage; however, it has a certain adverse effect on the initial charge-discharge performance of the battery.
- The amount of has a great influence on the initial performance and storage performance of the battery. With the increase of the amount of , the impedance of electrode increases, the initial charge-discharge performance of the battery decreases, and the improvement effect on the storage performance of the battery increases, but when the addition amount is more than , the improvement effect on the storage performance of the battery is basically unchanged. was determined as the best addition amount of .
- Before and after storage, the surface morphology of electrode containing changes little, while F element is concentrated on the surface of particles, indicating that self-sacrifice reacts with HF in the electrolyte, thus reducing the concentration of HF near the positive electrode and reducing the corrosion of positive active materials, which is the reason for the improvement of battery storage performance.
- The addition of other additives , , , MgO) has a certain effect on the initial performance of graphite/Li battery, but it is not obvious. Similar to , the addition of these additives can also inhibit the decline of the capacity and charge-discharge performance of the battery during storage, improve the cycle performance of the battery after storage, reduce the increase of DC internal resistance of the battery after storage, and restrain the increase of positive impedance. The results show that this method can improve the storage performance of graphite/Li battery.
b) Study on the Mechanism of Surface coating Modification of cathode Materials
The failure mechanisms of various cathode materials are different, but the causes of failure are often similar. It can be attributed to two aspects: 1) the enrichment of surface fluoride hinders the conduction of lithium ions and electrons; 2) the surface structure collapse caused by the surface reaction including dissolution or oxygen evolution.
Taking the layered LiMe (Me=Ni, Co, Mn) O2 materials as an example, the main mechanisms of coating modification are as follows:
- The coating materials reduce the production of HF and consume HF in the electrolyte, and inhibit the change of the surface structure of cathode materials and the deposition of LiF and other substances. Myung et al. [42] studied the changes of surface composition and morphology of before and after cycling by coating, XPS, TOF-SIMS and other means. It is found that coating reduces the production of HF, while coating consumes HF, which is the main reason for coating to improve the cycle performance of cathode materials.
- The physical isolation of the coating reduces the direct contact between the electrolyte and the cathode active material, thus protecting the cathode material. Sun et al. [43] improve the cycle performance and thermal stability of at high potential by coating, and think that , as a physical barrier layer, hinders the direct contact between electrolyte and cathode material is the key to improve performance.
- Due to the Lewis acid characteristics of the coating material, the surface of the positive active material is corroded and the fresh surface is constantly exposed, which reduces the conduction impedance of lithium ion. Bai et al. [44] soaked the particles in the electrolyte and found that the battery assembled with the soaked electrolyte had better cycle stability. Through SEM observation, it was found that the surface of the cathode was smoother after the cycle of the battery assembled with the soaked electrolyte. From this, it was inferred that the key to improving the performance of the cathode material was the acid characteristics of the coating layer, which was caused by the continuous corrosion of the cathode material surface.
To sum up, there is no consistent view on the modification mechanism of positive coating at present. The existing viewpoints have some limitations, and the study of the mechanism of positive coating modification is the key to further guide the related work, so the research on it is still of great significance.
c) Graphite / coated Li battery The comparative study results of graphite/ coated battery are summarized as follows:
There is little difference in specific surface area, vibrating density and diffusion coefficient of before and after coating. The coating of Al2O3 on the surface reduces the basicity of , which is beneficial to the coating of electrode active materials.
There is a difference in discharge capacity attenuation at 1C after 4.5-2.8V, 1C and 100 cycles of 2025 battery before and after coating, but the difference of 0.2C discharge capacity is only . It shows that the key to the cyclic attenuation of the battery lies in the increase of impedance. SEM observed that the surface of the cathode active material of the uncoated battery was rougher than that of the coated one after cycling, indicating that there were more attachments on the surface. The EDS results show that the fluoride content on the surface of the uncoated cathode is higher. The XPS results show that more NiO is formed on the uncoated surface, which is one of the main reasons for the increase of impedance in the process of coating reduction cycle.
After 400 cycles of 4.2-2.75V and 2C current of 18650 battery before and after coating, the capacity of uncoated battery decreased by , but the capacity attenuation of positive and negative electrodes was and respectively, which was much less than of that of batteries. It shows that the attenuation of battery capacity is due to the mismatch between positive and negative charge and discharge capacities. The ICP detection of active lithium shows that the loss of active lithium is the key to its capacity attenuation during the cycle. The ICP test of the negative electrode material showed that the deposition amount of Ni, Co and Mn which promoted the formation of SEI film and the loss of active lithium in the coated anode was significantly lower than that in the uncoated battery, which was the reason for improving the cycle performance of the battery.
The measurement results of the positive and negative electrode impedance of the 18650 battery during the cycle show that the key to the decline of the rate performance lies in the positive electrode, and the coating reduces the impedance of both positive and negative electrodes, thus improving the rate retention ability of the battery.
The results of the 18650 battery stored at for 60 days showed that the positive coating improved the storage performance of the battery, the capacity retention increased from to , and the increase of Ni, Co and Mn in the negative electrode decreased from 3.27 times to 1.27 times.