
INTRODUCTION
The Superpave mix design approach primarily uses performance-based and performance-related features as the selection criteria for the mix design, which is a significant distinction from other design methods like the Marshal and Hveem methods.
Here, we'll take a smooth and accurate look at how to use superpave method to create an asphalt mix and compare it to the minimum criteria using procedures including employing equations, displaying the results, modifying, and comparing.
The objective of this mix design is to obtain a mixture of asphalt and aggregates that has the following characteristics:
Sufficient asphalt binder.
Sufficient voids in the mineral aggregates (VMA) and air voids.
Sufficient workability.
Performance characteristics over the service life of the pavement.
Enter:
Superpave system consists of the following parts:
- Selection of Materials
- Volumetric Trial Mixture Design
- Selection of Final Mixture Design
I. SELECTION OF MATERIALS
a) Selection of Asphalt Binder
The selection can be made in one of three ways:
The designer may select a binder based on the geographic location of the pavement.
The designer may determine the design pavement temperatures.
The designer may determine the design air temperatures which are then converted to design pavement temperatures.
- Superpave system specifies asphalt on the basis of the climate and pavement temperatures is expected to serve.
- Physical properties requirements remain the same, but the temperature of asphalt must attain the properties changes.
Performance grade (PG) binders are graded such as PG 64-22.
The first number 64, is often called the "high temperature grade".
This means that the binder would possess adequate physical properties at least up to 64C.
The second number -22, is often called the "low temperature grade" and means that the binder would possess adequate physical properties in pavements at least down to -22C.
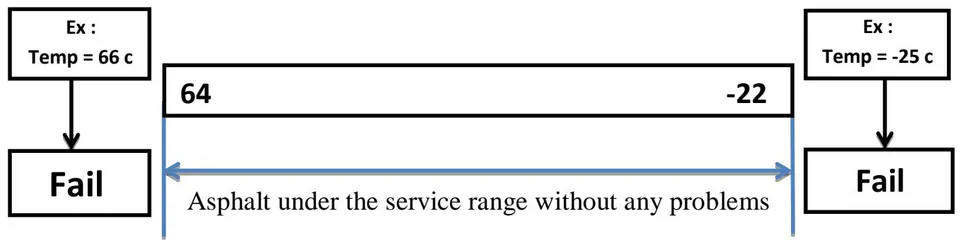
Performance grade (PG) evaluation
The Superpave system didn't consider the air temperature should be used as the design temperature; the system therefore uses this equation to convert the maximum air temperature to the maximum design pavement temperature.
The low-pavement design temperature can be selected using this equation:
Where:
high-pavement design temperature at a depth of
= seven day average high air temperature (C)
Lat= the geographical latitude of the project location (degrees)
The low-pavement design temperature can be selected using this equation:
Where:
low AC-pavement temperature below surface (C)
Lat= latitude of the project location (degrees)
depth of pavement surface mm1
standard deviation of the mean low air temperature (C)
for 98 percent reliability
Ex:
Determining a Suitable Binder Grade Using High and Low Air Temperatures.
The latitude at a location where a high-speed rural road is to be located is . The seven-day average high air temperature is and the low air temperature is . The standard deviation for both the high and low temperatures is .
Determine a suitable binder that could be used for the pavement of this highway if the depth of the pavement surface is and the expected ESAL is .
1. Determine the high-pavement temperature at a depth of 20 mm
2. Determine low-AC-pavement temperature
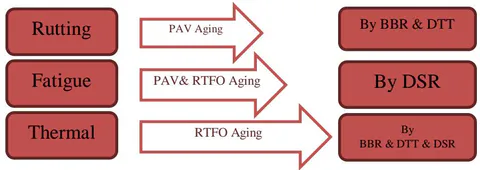
Tests on Binder Asphalt (Physical Properties)
Physical properties are also measured on binders that have been aged in
- Rolling thin film oven (RTFO) (Long Term Aging)
- to simulate oxidative hardening that occurs during hot mixing and placing.
- Pressure aging vessel (PAV) (Short Term Aging)
- to simulate the severe aging that occurs after the binder has served many years in a pavement.
Binder physical properties are measured using four devices
1. Dynamic Shear Rheometer (DSR)
is used to measures the complex shear modulus and phase rotational angle.
- to control asphalt stiffness
- prevent Fatigue cracking
2. The Rotational Viscometer (RV)
to characterize the stiffness of the asphalt at 135 C, where it acts entirely as a viscous fluid.
- To know that asphalt have a viscosity of less than 3 Pa-s. This ensures that the asphalt can be pumped and otherwise handled during HMA manufacturing.
3. The Bending Beam Rheometer (BBR)
to characterize the low temperature stiffness properties of binders.
- To minimize low temperature cracking due to load.
4. Direct Tension Test (DTT)
to Know binders (Asphalt) are sufficiently ductile at low temperatures
Resistance low temperature cracking due to Climate.
These are examples of problems and how they are tested to prevent them from occurring.
b) Selection of Mineral Aggregate
The aggregate characteristics that generally were accepted by the experts for good performance of the hot mix asphalt include:
- Coarse Aggregates Angularity (CAA)
- Fine Aggregates Angularity (FAA)
- A flat and elongated particle
- The clay content
1. Coarse Aggregates Angularity (CAA)
The percent of coarse aggregates larger than with one or more fractured faces.
Table 18.14: Coarse Aggregate Angularity Criteria
Minimum Value
Given
Depth from Surface
Traffic, Million ESALs
<100mm
100mm
<1
<3
<10
<30
<100
100
55/-
65/-
75/-
85/80
95/90
100/100
100/100
-/-
--
50/-
60/-
80/75
95/90
00/100
Note: "85/80" indicates that of the coarse aggregate has one or more fractured faces and two or more fractured faces.
When CAA Increase, Performance Increase
Ex: ESAL = 40*10^6 and depth from surface = 12 cm are 82% acceptable?
SOL: Depth from surface
ESAL
Not Acceptable
2. Fine Aggregates Angularity (FAA)
The percent of air voids in loosely compacted aggregates smaller than .
Table 18.15: Fine Aggregate Angularity Criteria
Minimum Value
Given
Percent Air Voids in Loosely Compacted Fine Aggregates Smaller than 2.36 mm
Traffic, Million ESALs
Depth from Surface
<1
<3
<10
<30
<100
<100mm
40
40
45
45
45
45
一
40
40
40
45
45 When FAA Increase, Performance Increase
Ex: ESAL = 20*10^6 and depth from surface = 7 cm percent of air voids in fine aggregates = 40% the FAA acceptable?
SOL: Depth from surface ESAL
40% < 45%
Not Acceptable
3. The Clay Content
Is the percentage of clayey material in the portion of aggregate passing through the 4.75 mm sieve.

3. The Clay Content
Is the percentage of clayey material in the portion of aggregate passing through the 4.75 mm sieve.
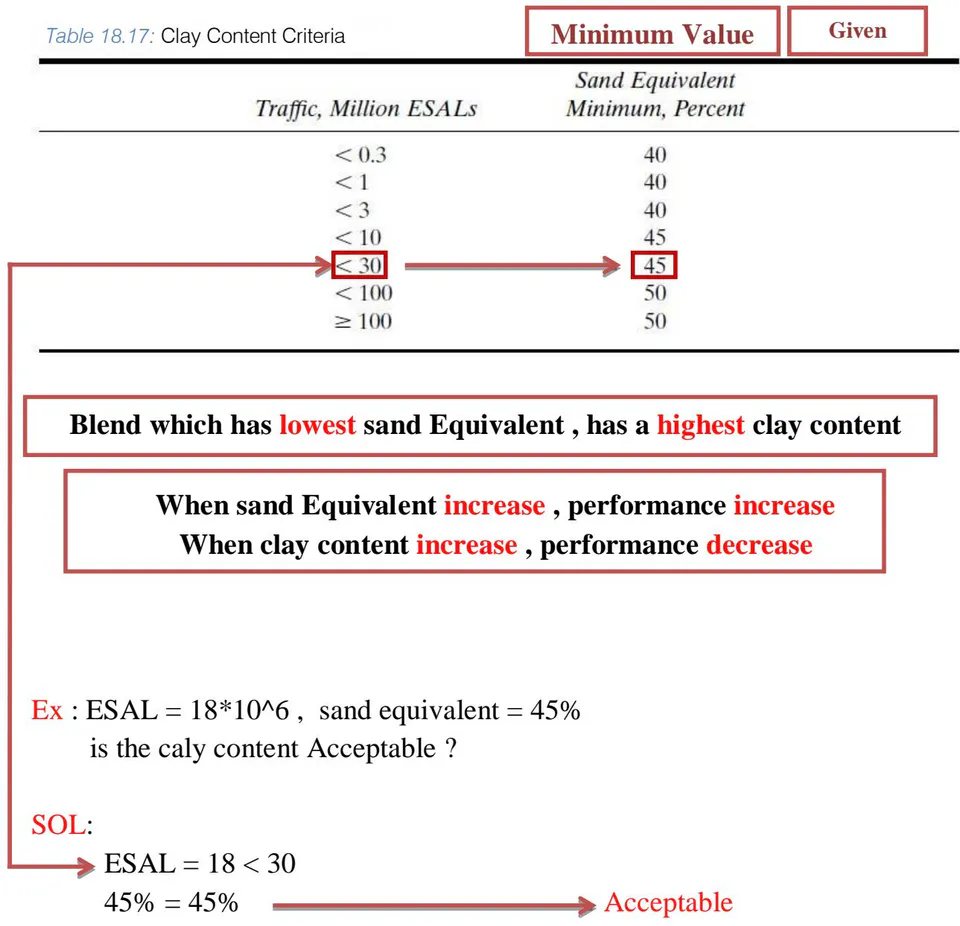
4. A Flat and Elongated Particle
Maximum dimension five times greater than its minimum dimension.
Maximum Value
Given
Traffic, Million ESALs
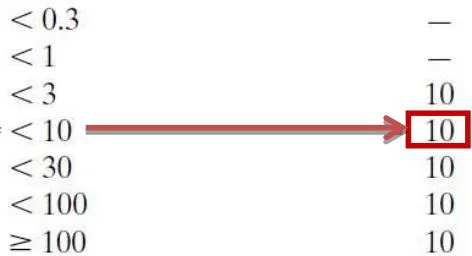
Acceptable or Not?
SOL:
Not Acceptable
Summary
- Seeking to achieve HMA with a high degree of internal friction and thus, high shear strength for rutting resistance.
- Limiting elongated pieces ensures that the HMA will not be as susceptible to aggregate breakage during handling and construction and under traffic.
- Limiting the amount of clay in aggregate, the adhesive bond between asphalt binder and aggregate.
c) Gradation
The distribution particle sizes for a given blend of aggregate mixture is known as the design aggregate structure.
The advantage of granular grading of aggregates is to obtain the highest density of aggregates and the lowest voids
1-The nominal maximum size
Is one sieve larger than the first sieve that retains more than 10 percent of the aggregate.
2- Maximum size
Is defined as one sieve larger than the nominal maximum size.
EX: Find Maximum nominal size & Maximum Size for These Sieve
| Sieve (mm) | Passing (+) | Retain (-) |
| 50 | 100% | 0% |
| 37.5 | 100% | 0% |
| 25 | 95% | 5% |
| 19 | 92% | 8% |
| 12.5 | 89% | 11% |
| 9.5 | 85% | 15% |
| 4.75 | 70% | 30% |
Maximum Nominal Size
Maximum Size
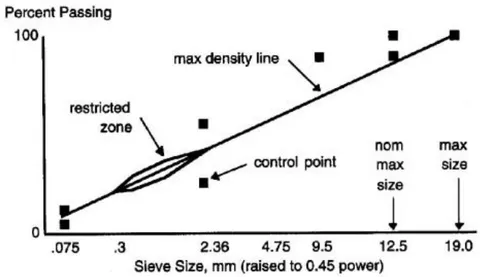
Control point: upper and lower limits where superbave gradation must pass through them
Restricted Zone: Control Fine Minerals
Max density Line:to Know density Of Mix
II. VOLUMETRIC TRIAL MIXTURE DESIGN
a) Determining Trial Percentage of Asphalt Binder
Step 1
Compute the bulk and apparent specific gravities of the total aggregates in the trial aggregate mix using
Step 2
Compute the effective specific gravity of the total aggregate in the trialgradation
Step 3
The amount of asphalt binder absorbed by the aggregates
Where:
Vba: volume of absorbed binder of mix
:percent of binder
Ps: percent of aggregate
Gb:specific gravity of binder
volume of air voids
Step 4
The percent of effective asphalt binder by volume
Where:
Vbe: the volume of effective binder content
Sn: the nominal maximum sieve size (mm)
Step 5
A trial percentage of asphalt binder

Where:
Pbi: initial trial percent of binder by mass of mix
Gb:specific gravity of binder assumed
Ws:mass of aggregate
The table below shows properties of three trial aggregate blends that are to be evaluated so as to determine their suitability for use in a Superpave mix. If the nominal maximum sieve of each aggregate blend is , determine the initial trial asphalt content for each of the blends.
| Property | Trial blend 1 | Trial blend 2 | Trial blend 3 |
| Gsb | 2.698 | 2.696 | 2.711 |
| Gse | 2.765 | 2.766 | 2.764 |
Since and are given, the trial percentage of asphalt binder can be found using Equations 18.17, 18.18, and 18.19 and the assumed values as indicated in the textbook:
For trial blend 1:
Use Equation 18.17,
Use Equation 18.18.
Use Equation 18.20.
For trial blend 2:
Use Equation 18.17,
Use Equation 18.18,
Use Equation 18.20,
Use Equation 18.19,
For trial blend 3:
Use Equation 18.17,
Use Equation 18.18,
Use Equation 18.20,
b) Evaluating Trial Mix Design
To know if the percentage of asphalt that we got is suitable after the compaction
- By Using Superpave Gyratory Compactor (SGC)
- Number of gyrations to compute level of compaction.
The depends on the average design high air temperature and the design ESAL.
Maximum number of gyrations, , is used to compact the test specimens.
Initial number of gyrations, , is used to estimate the compactibility of the mixture.
Ndesign To know compaction level
Nmax To compact the specimen
Ninitial To know specimen's bearing capacity
Superpave Gyratory Compactor
Basis
Texas equipment
French operational characteristics
Up to nominal size
Height recording
Must control pressure (600 KPa), angle (1.25 degrees), and number of gyrations (depends on traffic)
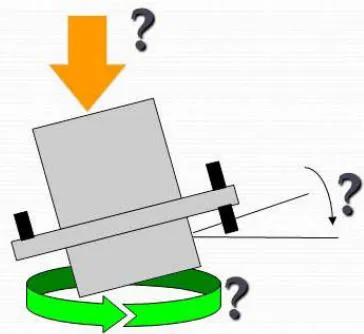
Ex: When Design ESALs (millions) and the Average design high air temperature to given
Find & Compactibility?
or
- Volumetric Calculation at the Ndesigngyration
Know the characteristics of the sampleafter compaction.
1- percent air voids at Ndesign (Pa or Va)
Pa:air voids at Ndes percent of total volume
Gmm: maximum theoretical specific gravity at Ndes
Gmb: bulk specific gravity of the compacted mixture
2- voids in mineral aggregate (VMA)
VMA: voids in mineral aggregate, percent in bulk volume
Gmb: bulk specific gravity of the compacted mixture
Ps: aggregate content cm3/cm3, by total mass of mixture
Gsb: bulk specific gravity of aggregates in the paving mixture
3- Void filled Asphalt (VFA)
4-
7- Dust% = P0.75/Pbe
VMA equation in the past paper
Correction Equation
- Pb,estimated: estimated asphalt content.
- Pbi: initial (trial) asphalt content, percent by mass of mixture.
- Pa: percent air voids at Ndes (trial)
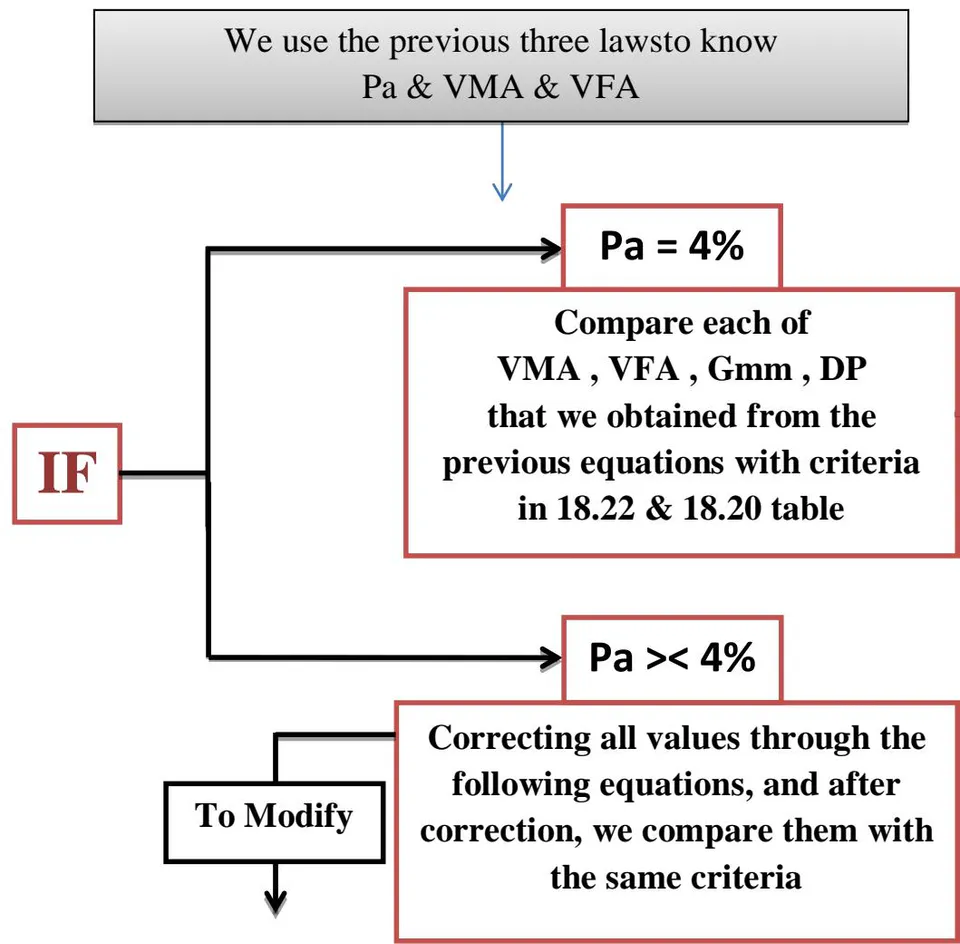
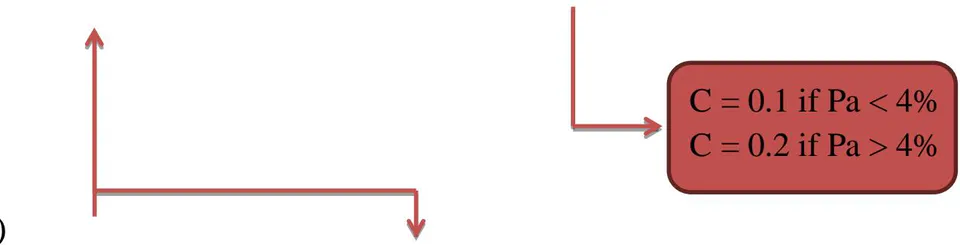
- VMAestimated = VMAinitial + C (4 - Pa)
3)
4) The effective binder content after correction
5) Dust Percentage
Percent of aggregate content passing the 0.075-mm sieve
- Gmm,estimatedat Nmax= Gmm,trialat Nmax-
- Gmm,estimatedat Nini = Gmm,trialat Nini - (4 - Pa)
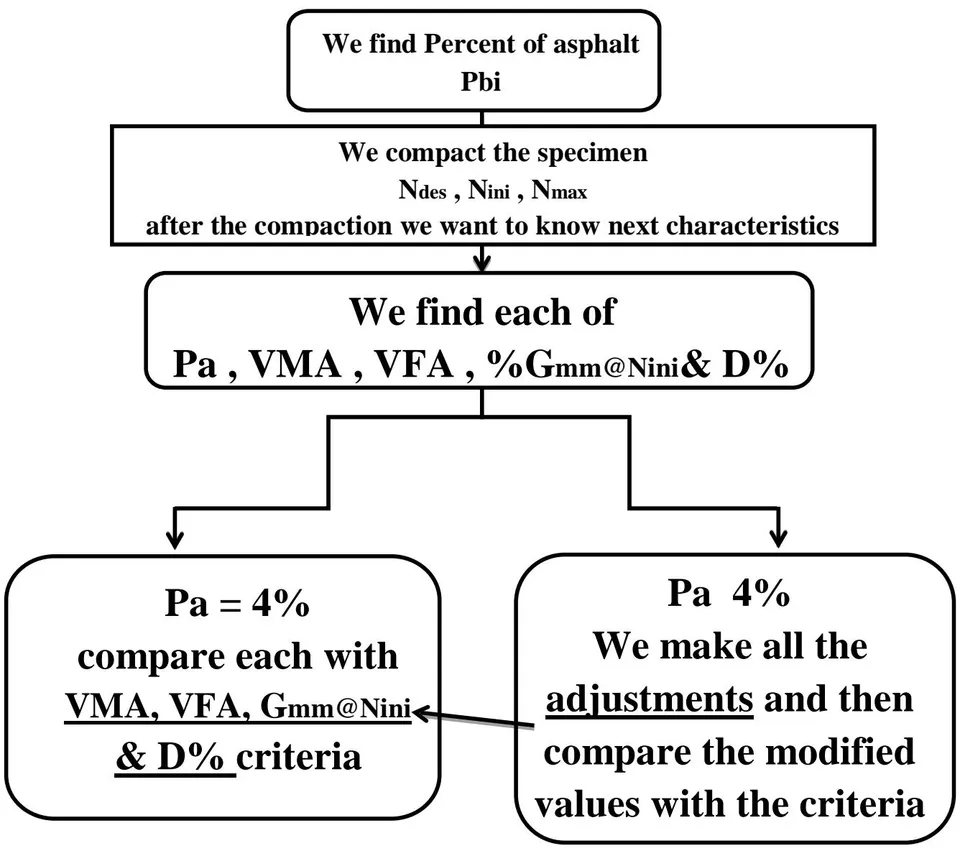
Table 18.20: Voids in Mineral Aggregate Criteria
| Nominal Maximum Size (mm) | Minimum Voids in Mineral Aggregate (%) |
| 9.5 | 15.0 |
| 12.5 | 14.0 |
| 19.0 | 13.0 |
| 25.0 | 12.0 |
| 37.5 | 11.0 |
| 50.0 | 10.5 |
Table 18.22: VFA Criteria
| Traffic, Million ESALs | Design VFA, Percent |
| < 0.3 | 70-80 |
| < 1 | 65-78 |
| < 3 | 65-78 |
| < 10 | 65-75 |
| < 30 | 65-75 |
| < 100 | 65-75 |
Find which blend satisfy to criteria for volumetric properties in trial mix, use result in this table to choose.
| blend | 1 | 2 | 3 |
| Trial binder | 4.4% | 4.4% | 4.4% |
| % Gmm at Ndes | 96.2% | 95.7% | 95.2% |
| % Gmm at Nini | 87.1% | 85.6% | 86.3% |
| % Pa | 3.8% | 4.3% | 4.8% |
| %VMA | 12.7% | 13% | 13.5% |
| %VFA | 68.5% | 69.2% | 70.1% |
| %Dust | 0.9% | 0.8% | 0.9% |
First, we look at the percentage of air voids Pafor each mixture. We note that each mixture needs to adjust the values to obtain percentage of air void , after that we compare the specifications for each ratio.
Blend 1:
- 1-
- Old not modified
- 2- =
- 3- VFA estimated = 100 *
- 4- at
because
Blend 2:
- 1-
- 2- =
- 3- VFA estimated = 100 *
- 4- at
because
Blend 3:
- 1- =
- 2- =
- 3- = 100 *
- 4- at
| Criteria to compare>>Given | ||||
| Gmm at Nini< 89% | Pa=4% | VMA≥13% | 65% <VFA <75% | 0.6%<Dust<1.2% |
1- All Blend
2-
Blend 1 VMA = 12.72% < 13% ×
Blend 2 VMA = 12.94% < 13% ×
Blend 3 VMA = 13.34% > 13% ✓
- 3- All Blend VFA between
- 4- All Blend less than
Footnotes
mm diameter (p.13) ↩