

I. INTRODUCTION
Group III-V nitride are now a widely studied class of semiconductor materials. , with small x, are very efficient light emitters, even in samples with relatively high densities of structural defects are used as component layers in a wide range of optoelectronic devices. Its high light absorption and its Indium–composition–tuned band gap, the Indium Gallium Nitride (InGaN) ternary alloy is a good candidate for high-efficiency–high-reliability solar cells able to operate in harsh environments.
Moreover, the most important advantage of InGaN alloy might be the direct band gap energy which can be adjusted according to the indium composition.
Thus, the InGaN's energy band gap can be tuned from 0.7 eV to 3.42 eV, covering approximately the total solar spectrum[1]. In this paper, we present simulation of InGaN based p-n homo junction solar cell at different Indium composition. The layers of InGaN solar cell can be deposited using the cost-effective techniques, such as Metal Organic Chemical Vapor Deposition (MOCVD), Metal Organic Vapor Phase Epitaxy (MOVPE), and Molecular Beam Epitaxy (MBE) [2]. Whatever the deposition technique used, higher growth rates ( 1.0 Angstrom/second) and lower temperature( 550 C) characterize the InGaN growth [3]
II. MODELLING AND SIMULATION
a) Structure
As the numerical simulation is an important way to explore the possibility of a new solar cell structure the InGaN single p-n junction solar cell has been studied using commercial device simulator Atlas from Dilvaco Inc [4].
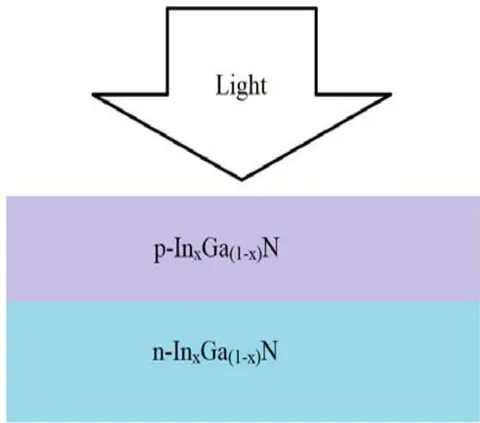
All the simulations were performed under normalized conditions that are 1 sun, a temperature of 300 K, and AMO illumination. The single p-n junction solar cell structure studied consists of p-type emitter and n-type base as shown in Fig. 1.
Fig. 1: In Ga N single p-n junction solar cell structure
| Material | Energy band gap (Eg) |
| GaN | 3.42 |
| 2.6612 | |
| 2.1672 | |
| 1.7375 | |
| 1.4401 | |
| 1.1076 | |
| 0.9063 | |
| InN | 0.77 |
b) Physical & Optical Parameters
The energy band gap of is depended on concentration of Indium (x) and energy band gap of is given by following formula
where the band gap energy of InN denoted as and band gap energy of GaN denoted as is 0.7eV and 3.42eV, respectively, x is the indium content and b is the bowing parameter (b = 1.43) [5-6].
The other modeling parameters of the alloy were calculated using the following equations—Electron Affinity[7-9]: -
Relative permittivity[6]: -
| Material | Electron Affinity(X) | Relative permittivity(E) |
| 4.092 | 8.9 | |
| 4.3955 | 10.18 | |
| 4.5931 | 11.14 | |
| 4.765 | 12.1 | |
| 4.884 | 12.868 | |
| 5.017 | 13.892 | |
| 5.0975 | 14.66 | |
| 5.152 | 15.3 |
Effective density of conduction band[8-9]: -
Effective density of valence band[8-9]: -
| Material | Effective density of Conduction band (Nc) | Effective density of Valance Band(Nv) |
| GaN | 0 | 0 |
| 1.8 | 1.06 | |
| 3.15 | 1.855 | |
| 4.5 | 2.65 | |
| 5.58 | 3.286 | |
| 7.02 | 4.134 | |
| 8.1 | 4.77 | |
| InN | 9 | 5.3 |
Effective mass of hole
| Material | Effective Mass of Electron (Mn) | Effective Mass of Hole (Mh) |
| GaN | 0.2 | 1 |
| 0.184 | 0.834 | |
| 0.172 | 0.7095 | |
| 0.16 | 0.585 | |
| 0.1504 | 0.4854 | |
| 0.1376 | 0.3526 | |
| 0.128 | 0.253 | |
| InN | 0.12 | 0.17 |
Intrinsic carrier concentration: -
Where is Boltzmann constant and T is lattice temperature Efficiency: -
The following equation (11,12) is simplified equation for electron & hole mobility for InGaN alloy.
Where Eph is photon Energy A & B is coefficient dependent on material composition that equation giving by following equation.
Where is short circuit current, is open circuit voltage, is incident optical power and FF is fill factor of the solar cell.
Where C & D are fitting parameter that is given by following equation (17,18)
| Material | Mobility of Electron (MUN or Un) | Mobility of Hole (MUP or Uh) |
| GaN | 1000 | 170 |
| 1104.8 | 171.3 | |
| 1183.4 | 172.275 | |
| 1262 | 173.25 | |
| 1324.9 | 174.03 | |
| 1408.7 | 175.07 | |
| 1471.6 | 175.85 | |
| InN | 1524 | 176.5 |
Mobility[11]: -
(10)
Where the is 1000 & is 170.
For the alloys, Adachi's wavelength-dependent refractive index model is given by the following equation [6, 12]:
......(13)
This real part of refractive index is approximate same 2.32
Its slightly worry for InGaN alloy with different composition of x from 2.30 to 2.34.
The InGaN alloys absorption coefficient is given by equation (16)[13]
Following equation is simplified expression of absorption coefficient (19)
Where is photon wavelength
(17)
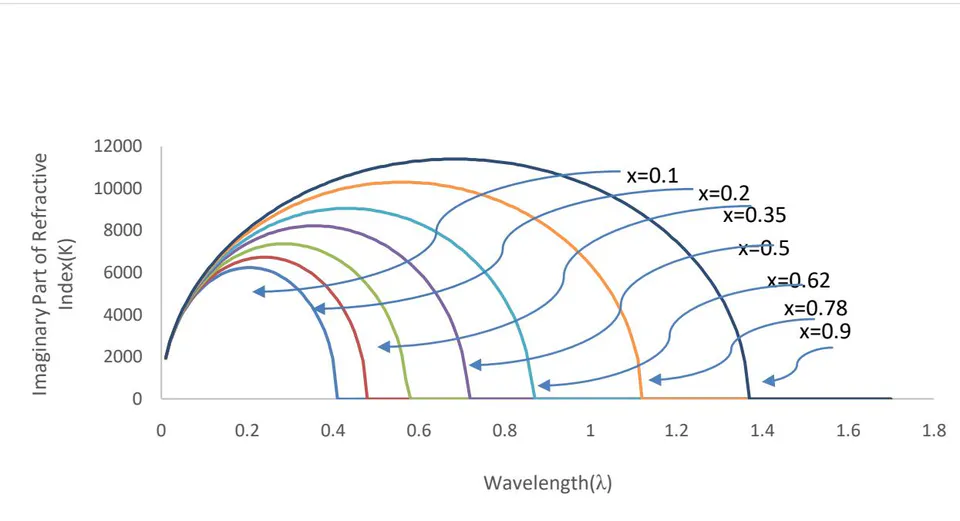
For the alloys, wavelength-dependent imaginary part of refractive index is given by the following equation
Where pie (π) is 3.14.
Following Fig. 2 is graph of wavelength vs imaginary part of refractive index at different value of x
| Parameter Used | Value |
| Thickness of n-InGaN layer | 0.015 micron |
| Thickness of p-InGaN layer | 0.63 micron |
| n-type doping [cm-3] | 2e18 |
| p-type doing [cm-3] | 1×10¹⁷ |
| Velocity of electron & hole (Sn,h) [cm/s] | 103 |
| Recombination time of electron & hole (τn,h)[sec.] | 1ns |
III. RESULT & DISCUSSION
For the case studied, the initial physical and geometrical parameter values used for single p-n junction solar cell are presented in table 6. After modeling & simulation get results with the help of above work following results are tabulates
| Material | Isc(mA/cm^2) | Voc (V) |
| 0.00813315 | 1.9963 | |
| 0.0158621 | 1.51555 | |
| 0.0274789 | 1.08184 | |
| 0.0385468 | 0.781803 | |
| 0.0539032 | 0.446001 | |
| 0.0654447 | 0.242227 |
This above table 7 presents simulation results of short circuit current & open circuit voltage at different composition of x for single p-n junction solar cell.
| Material | Im (mA/cm^2) | Vm (V) |
| 0.00798644 | 1.88 | |
| 0.01556 | 1.41 | |
| 0.0265989 | 0.99 | |
| 0.0372977 | 0.69 | |
| 0.0507992 | 0.369998 | |
| 0.0563837 | 0.19 |
This above table 8 presents simulation results of maximum current and maximum voltage at different composition of x for single p-n junction solar cell.
| Material | Fill Factor | Efficiency |
| 92.4754 | 11.0401 | |
| 91.2636 | 16.1321 | |
| 88.5801 | 19.3624 | |
| 85.3975 | 18.9231 | |
| 78.1818 | 13.8203 | |
| 67.5787 | 7.87713 |
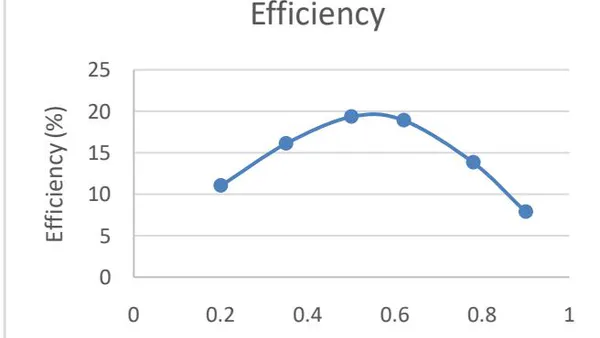
This above table 9 shows simulation results of fill factor and efficiency at different composition of x for single p-n junction solar cell.
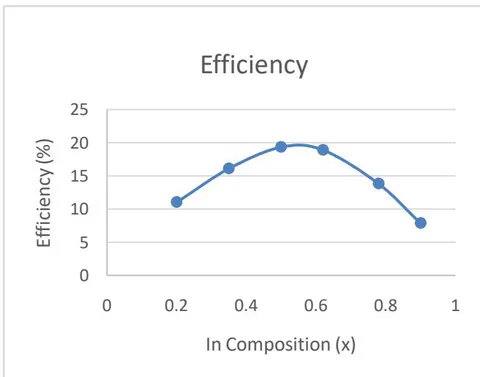
After getting all results we gets maximum efficiency is 19.36% at single p-n junction solar cell.
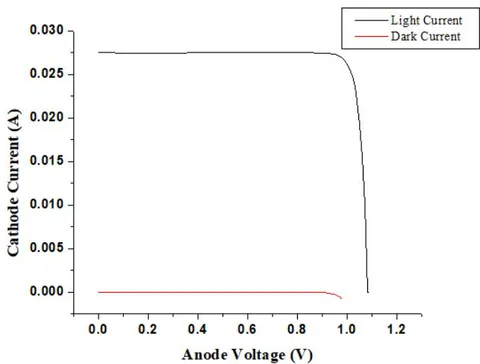
Dark region characteristics and illumination region characteristics have been shown in Fig.4. In this figure the cathode current vs. anode voltage of dark region is shown by red color and of illuminated region is by black color.
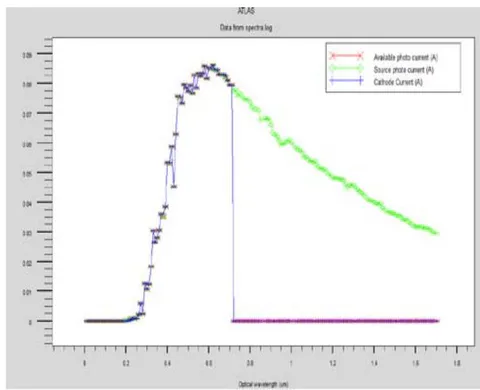
Spectral response with respect to wavelength has been shown above in Fig.5. Source photo current is maximum possible total current due to incident photons, available photo current is current due to total generated electron-hole pair and cathode current is total current collected at terminals. Among these three, source current is always greater than other two. Total photons incident losses due to reflection, transmission, thermalization etc. Further there is loss of some of the generated electron-hole pairs due to recombination and hence collected cathode current is less than or equal available photo current.
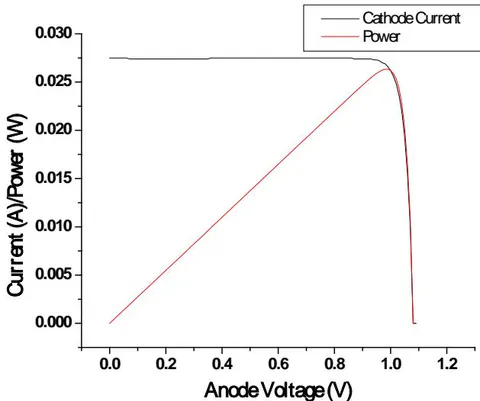
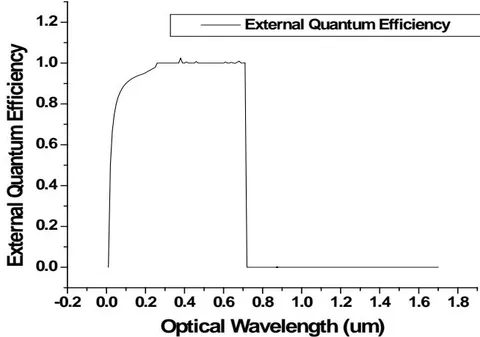
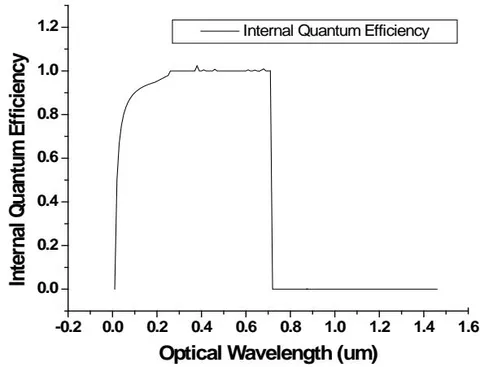
Fig. 7(a) is shown for External Quantum Efficiency (EQE) that is defined as ratio of cathode current to source photo current and Fig.7(b) shows the Internal Quantum Efficiency (IQE) that is defined as ratio of cathode current to available photo current. Theoretically IQE is always greater than EQE hence justify the above graph.
IV. CONCLUSION
In this paper we report the TCAD simulation and performance optimization of based solar cell. Evaluation of the performance of the device has been performed for various values of mole fraction x of In in InGaN. Extracted performance parameters such as current, voltage, power, fill factor and efficiency from the proposed structure are: open circuit voltage ( ) of 1.08 V, Short circuit current ( ) is 0.027A, Fill Factor (FF) is 88.58%, Maximum voltage ( ) is 0.99 V, Maximum current ( ) is 0.26A and overall efficiency is 19.36%.
ACKNOWLEDGEMENT
The authors are thankful to SERB, DST Government of India for the financial support under the grant sanctioned for Project No.ECR/2017/000179.