## I. INTRODUCTION
Alloy is a general term for metal materials composed of binary (multi) metals. There are mainly four important series of alloy hydrogen storage materials [1]: (1) AB type alloys, represented by TiFe and Ti $(\mathrm{Fe}_{1-x}\mathrm{Mn}_x)$; (2) $\mathrm{AB}_2$ Laves phase hydrogen storage alloys with three structures, cubic C15 type, such as $\mathrm{MgZn}_2$; hexagonal C14 type, such as $\mathrm{MgCu}_2$; hexagonal 36 type, such as $\mathrm{MgNi}_2$ series alloys; (3) $\mathrm{AB}_5$ - type rare earth alloys, such as $\mathrm{LaNi}_5$, $\mathrm{M}_{\mathrm{m}}\mathrm{Ni}_{5}$ ( $\mathrm{M}_{\mathrm{m}}$ is mixed rare earth metal), $\mathrm{LaNi}_4\mathrm{Cu}$, etc., and other $\mathrm{AB}_5$ alloys of partial extraction Ni by other elements, etc; (4) Mg-based hydrogen storage alloys, such as $\mathrm{Mg88Y_{12}}$, $\mathrm{Mg}-\mathrm{Cu}$, etc., and alloys that adds a small amount of other elements.
In addition to alloy hydrogen storage materials, there are metal coordination hydride hydrogen storage materials, such as $\mathrm{LiBH}_4$, $\mathrm{NaBH}_4$ and $\mathrm{NaAlH}_4$, carbon fiber carbon nanotubes, non-carbon nanotubes, glass hydrogen storage microspheres, complex hydrogen storage materials and organic liquid hydrides, and so on. This paper focuses on the first four kinds of important alloy hydrogen storage materials.
The hydrogen storage properties of materials are characterized in many aspects [3], but the commonly used criteria for measuring the performance of hydrogen storage materials are: (1) volumetric hydrogen storage density, that is, the mass of hydrogen storage per unit volume of the system $(\mathrm{kg} / \mathrm{m}3)$, and (2) mass hydrogen storage density, that is, the ratio of hydrogen storage mass of the system to the mass of the system (\%). The hydrogen storage density data of the main materials in the previous three important series of the above four hydrogen storage materials are given in tables 1 and 2.
Table 1: Bulk density and mass density of different hydrogen storage materials [1]
<table><tr><td>System name</td><td>gaseous H</td><td>liquid H</td><td>MgH2</td><td>TiH2</td><td>TiFeH1.95</td><td>LaNi5H6.7</td></tr><tr><td>Volume density/cm3</td><td>5.4×1019</td><td>4.2×1022</td><td>6.6×1022</td><td>9.1×1022</td><td>5.7×1022</td><td>7.6×1022</td></tr><tr><td>Mass density /%</td><td>100</td><td>5.4</td><td>7.66</td><td>4.04</td><td>1.84</td><td>1.58</td></tr></table>
<table><tr><td>System name</td><td>gaseous H</td><td>liquid H</td><td>MgH2</td><td>TiH2</td><td>TiFeH1.95</td><td>LaNi5H6.7</td></tr><tr><td>Quality/kg</td><td>0.6</td><td>0.6</td><td>8</td><td>16</td><td>34</td><td>41</td></tr><tr><td>Volume/L</td><td>7000</td><td>9</td><td>5.5</td><td>4.2</td><td>6.6</td><td>4.8</td></tr></table>
<table><tr><td>System name</td><td>gaseous H</td><td>liquid H</td><td>MgH2</td><td>TiH2</td><td>TiFeH1.95</td><td>LaNi5H6.7</td></tr><tr><td>Quality/kg</td><td>0.6</td><td>0.6</td><td>8</td><td>16</td><td>34</td><td>41</td></tr><tr><td>Volume/L</td><td>7000</td><td>9</td><td>5.5</td><td>4.2</td><td>6.6</td><td>4.8</td></tr></table>
It can be seen from tables 1 and 2 that the hydrogen storage density of alloy hydride is 1000 times that of gaseous hydrogen (in standard state), that is, the hydrogen storage capacity of some metal materials (such as TiH2, etc.) is only half of that of liquid hydrogen storage.
From the point of view of application, not only the hydrogen absorption capacity of the material is required, but also the speed of hydrogen absorption, the speed of hydrogen desorption, the stability of hydrogen storage, the cycle performance of hydrogen absorption and desorption, as well as cost and economic benefits should be considered. In terms of basic research on the development and application of new materials, in addition to the indicators required from the application point of view, the kinetic characteristics and thermodynamic analysis of hydrogen absorption and desorption of materials are also very necessary, and it is necessary to further explore the root causes and mechanisms that affect the kinetic properties.
As we all know, "in the field of philosophy, matter determines consciousness; in the field of natural science, structure determines function." The hydrogen storage performance of alloy hydrogen storage materials is determined by the structure of alloy hydrogen storage materials.
In order to explore the hydrogen absorption and desorption mechanism of hydrogen storage materials, it is necessary to observe and study the evolution of crystal structure and microstructure of hydrogen storage materials in the process of hydrogen absorption and desorption by on-line (in situ) or quasi-dynamic real-time observation while measuring hydrogen absorption and desorption kinetic curves. Therefore, this paper summarizes the law of hydrogen absorption and desorption kinetics of four kinds of alloy hydrogen storage materials (Section 2) and the evolution of parent phase structure of hydrogen storage materials in the process of hydrogen absorption and desorption (Section 3). Through the study of the crystal structure characteristics of four kinds of alloy hydrogen storage materials and their relationship with the main body of hydrogen storage (hydride) (Section 4), the diffusion behavior and thermodynamics of hydrogen atoms in the materials are analyzed comparatively, in order to explore the hydrogen absorption and desorption mechanism of alloy hydrogen storage materials.
## II. DYNAMIC CHARACTERISTICS OF HYDROGEN ABSORPTION OF TYPICAL ALLOY HYDROGEN STORAGE MATERIAL
The method to study the kinetic characteristics of hydrogen absorption and desorption is to determine the relative amount and time of non-stop hydrogen absorption of hydrogen storage materials at a given pressure.
System curve, that is, the P-C-T curve of the relative amount of hydrogen absorbed (or released) with time at different temperatures at a given hydrogen pressure, and the curve of the relative amount of hydrogen absorbed (or released) with time at different hydrogen pressures (T-C-T) at a given temperature.
### a) Dynamic characteristics of hydrogen absorption of AB-type Ti hydrogen storage materials
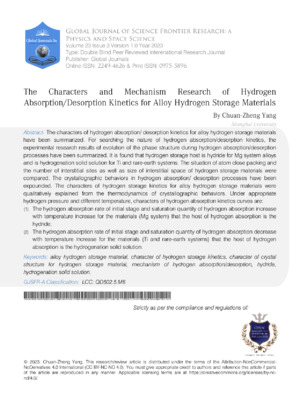
Lee, Byun and Park [4] have studied the hydrogenation kinetics of TiFe and its alloys. Figure 1 shows the plot of the hydrogenation reaction fraction F/T of TiFe at several constant pressures. it can be seen that F varies linearly with time at the beginning, which indicates that the reaction rate is constant. The slope of the straight line, that is, the reaction rate decreases gradually with the reaction process. The above phenomena show that the total reaction rate has multiple cascade control, that is, the rate control cascade varies with the reaction process.
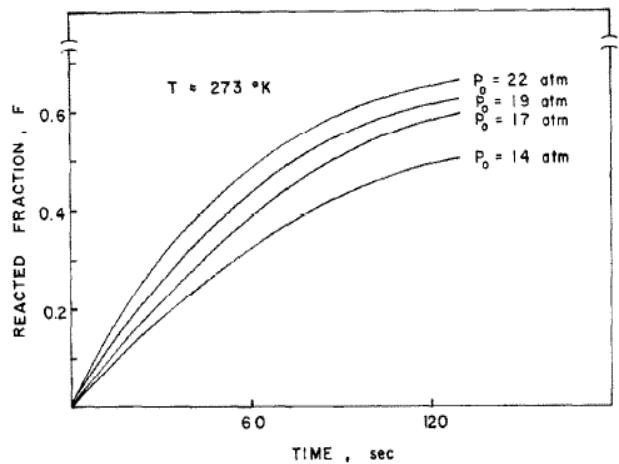
Fig. 1: Hydrogenation kinetics curve of TiFe at 273k and several hydrogen pressures [4]
Fig. 2: TiFe0.8Mn0.2 kinetic curve at 273k and several hydrogen pressures [4]
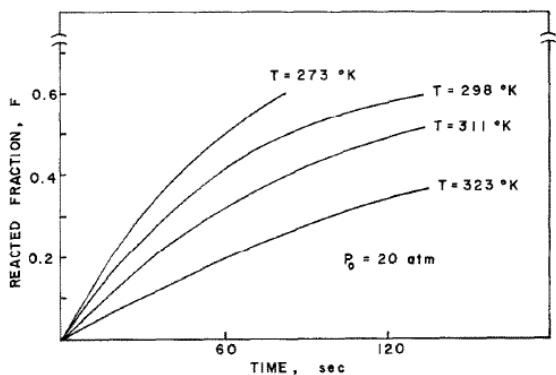 Fig. 3: Hydrogenation kinetics curve of hydrogen absorption of
$\mathrm{TiFe_{0.8}Mn_{0.2}}$ at constant pressure and different temperature [4]
Figure 2 shows the diagram of the hydrogenation reaction fraction of TiFe0.8Mn0.2 at several constant pressures, which shows a behavior similar to that of TiFe. After analysis, the dynamic behavior of TiFe accords with the following two equations:
$$
F = 3. 5 \times 1 0 ^ {- 2} \frac {P _ {0} - P _ {e q}}{T ^ {1 / 2}} \exp \left(- \frac {8 0 0 c a l / m o l}{R T}\right) t \quad F < 0. 2 5 \tag {1}
$$
$$
\left(1 - F ^ {*}\right) ^ {1 / 3} - \left(1 - F\right) ^ {1 / 3} = 5. 6 \times 1 0 ^ {- 3} \exp \left[ - \frac {1 0 0 0 c a l / (m o l H)}{R T} \right] \left(P _ {0} ^ {1 / 2} - P _ {e q} ^ {1 / 2}\right) \left(t - t ^ {*}\right) \tag {2}
$$
The dynamic behavior of TiFe0.8Mn0.2 accords with the following two equations:
$$
F = 5.0 \times 10^{-2} \frac{P_{0} - P_{eq}}{T^{1/2}} \exp\left(- \frac{1000\,\mathrm{cal/mol}}{RT}\right) t \quad F < 0.2 \tag{3}
$$
$$
(1 - F^{*})^{1/3} - (1 - F)^{1/3} = 9.0 \times 10^{-3} \exp\left[ - \frac{1500\,\mathrm{cal}/(mol\,H)}{RT} \right] (P_{0}^{1/2} - P_{eq}^{1/2})(t - t^{*})
$$
When the above four reaction rate equations are carefully evaluated, the time relationship of the reaction rate can be understood. If at constant pressure $P_0$, the temperature increases, including the exponential term of the activation energy term increases, but the equilibrium pressure $P_{\mathrm{eq}}$ or driving force term decreases. As mentioned above, the activation energy is relatively small and varies sharply with temperature at constant pressure $P_{\mathrm{eq}}$, and the reaction rate decreases with the increase of temperature (see figure 3). Because the driving force term is not considered in this system, the activation energy will be negative. In fact, Stakebake [5] has reported the negative activation energy in U hydrogenation.
Wajiad et al. [6] measured the hydrogen absorption kinetics curve (hydrogen concentration time) of hydrogen storage Ti-Fe-Mn alloy partially replaced by Cu and Y under different hydrogen pressure (Fig.4 (a)) and constant pressure 2.7MPa $(10^{\circ}\mathrm{C}, 30^{\circ}\mathrm{C}$ and $45^{\circ}\mathrm{C})$, as shown in figure 4 (b). Figure 4 shows that the initial hydrogen absorption activity of pure samples is fast when exposed to hydrogen atmosphere; the hydrogen absorption capacity increases with the increase of pressure at the same temperature; at the same pressure, the hydrogen absorption capacity decreases with the increase of temperature. The maximum hydrogen absorption capacity was $1.67\mathrm{wt}\%$, $1.41\mathrm{wt}\%$ and $1.32\mathrm{wt}\%$, respectively, for $10^{\circ}\mathrm{C}$
750s, $30^{\circ}\mathrm{C}$ 250s and $45^{\circ}\mathrm{C}350\mathrm{s},$ respectively. The incubation period of hydrogen absorption is obviously short, and the dissolution reaction time reaching the saturation point is less than a few minutes. $10^{\circ}\mathrm{C}$ reached a higher capacity, on the contrary, the hydrogen absorption function was relatively low in $45^{\circ}\mathrm{C},$ while the reaction rate was the fastest in $30^{\circ}\mathrm{C},$ reaching the equilibrium point very quickly.
### b) Kinetic characteristics of hydrogen absorption and desorption of Laves phase TiCr2 hydrogen storage materials
According to the binary phase diagram of Ti-Cr, $\mathrm{TiCr_2}$ has a certain composition range and belongs to hexagonal C14 structure at high temperature, $\mathrm{TiCr_2}$ at low temperature $(< 800^{\circ}\mathrm{C})$, cubic C15 structure, and TiCr2 at middle temperature, which
(a)
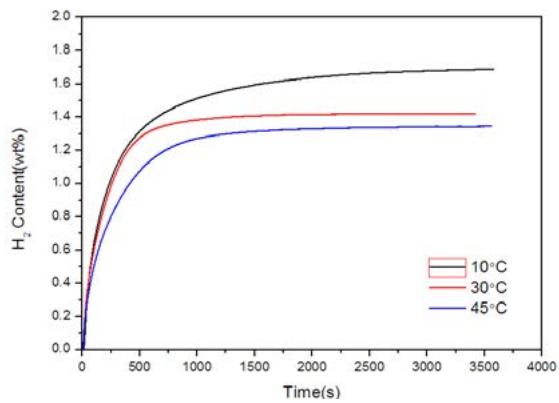
Fig.4 (a): The curve of hydrogen absorption and desorption parameters of Ti-Fe-Mn alloy replaced by Cu and Y in 20oC~60°C range [6] is a mixture of C14 and C15. Figure 5 shows the XRD diagram of the melted alloy at different times of ball milling. It can be seen that the newly cast alloy is a
mixture of C14 and C15. It changes to BCC cubic structure after different time of ball milling, and all of them are meta-BCC after 5 hours of ball milling.
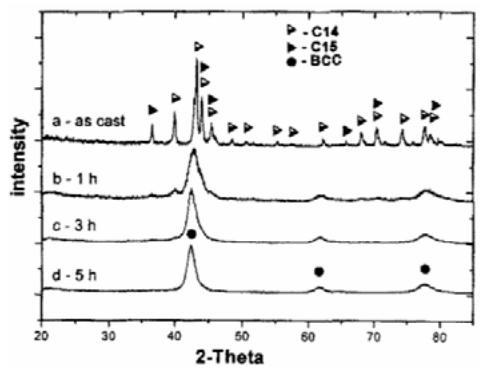 Fig. 5: XRD diagram of smelting alloy at different times of ball milling [8]
Huang Taizhong [8] in order to investigate the effect of different $\mathrm{Cr / Ti}$ ratios on the hydrogen absorption and desorption properties of alloys, alloys with different $\mathrm{Cr / Ti}$ ratios were designed and P-C-T tests were carried out. The P-C-T curves of each alloy at different temperatures show that with the increase of test temperature, the hydrogen absorption capacity of the alloy decreases and the hysteresis between hydrogen absorption and desorption weakens. At $273\mathrm{k}$, the hysteresis effect of the alloy increases with the increase of $\mathrm{Cr / Ti}$, but the hysteresis effect of each alloy is still very low. According to the P-C-T test results of each alloy, the maximum hydrogen absorption capacity and reversible hydrogen absorption capacity of each alloy at different temperatures can be obtained. The results are listed in Table 3. It can be seen from the table that both the reversible hydrogen absorption capacity and the maximum hydrogen absorption capacity of the alloy decrease with the increase of temperature, and the hydrogen absorption capacity of $\mathrm{TiCr}_{1.8}$ is the highest at 273k, but decreases rapidly with the increase of temperature.
Table 3: Maximum and reversible hydrogen absorption capacity of TiCrx alloys with different composition at different temperatures [8]
<table><tr><td rowspan="3">The x value of TiCrx</td><td colspan="4">Maximum hydrogen absorption and hydrogen content of alloy(wt%)</td><td colspan="4">Reversible hydrogen absorption of alloys(wt%)</td></tr><tr><td colspan="4">Test temperature (°C)</td><td colspan="4">Test temperature (°C)</td></tr><tr><td>273</td><td>303</td><td>333</td><td>353</td><td>273</td><td>303</td><td>333</td><td>353</td></tr><tr><td>1.6</td><td>1.415</td><td>1.102</td><td>0.955</td><td>0.857</td><td>0.945</td><td>0.636</td><td>0.548</td><td>0.522</td></tr><tr><td>1.80</td><td>1.449</td><td>1.005</td><td>0.881</td><td>0.811</td><td>0.979</td><td>0.606</td><td>0.534</td><td>0.504</td></tr><tr><td>1.85</td><td>0.341</td><td>1.028</td><td>0.855</td><td>0.811</td><td>0.889</td><td>0.633</td><td>0.524</td><td>0.492</td></tr><tr><td>1.90</td><td>1.295</td><td>0.943</td><td>0.819</td><td>0.755</td><td>0.858</td><td>0.563</td><td>0.493</td><td>0.455</td></tr><tr><td>2.00</td><td>1.281</td><td>0.891</td><td>0.762</td><td>0.721</td><td>0.867</td><td>0.525</td><td>0.466</td><td>0.455</td></tr><tr><td>2.20</td><td>1.180</td><td>0.876</td><td>0.755</td><td>0.690</td><td>0.770</td><td>0.537</td><td>0.464</td><td>0.443</td></tr></table>
The P-C-T test results of $\mathrm{TiCr_{1.8 - x}Mo_x}$ $(x = 0.2,0.4,0.6,0.8,1.0,1.2)$ alloy by Huang Taizhong et al [8] also showed the above rule, that is, the hydrogen absorption capacity of the alloy decreased with the increase of test temperature.
### c) Kinetic characteristics of hydrogen absorption of AB5 rare Earth hydrogen absorption Materials
i. Kinetic characteristics of LaNi5 hydrogen absorption process [9]
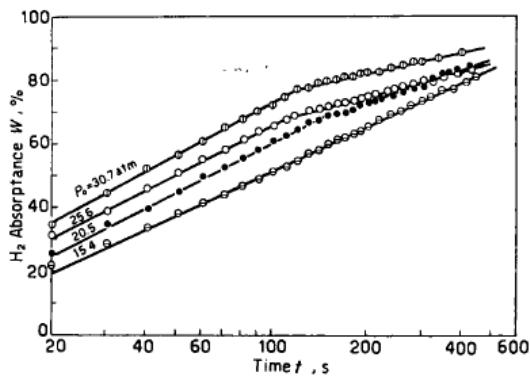
Lu Manqi, Qi Zhenzhong and Wu Pingsen [9] reported the kinetic curve of hydrogen absorption by LaNi5. Figure 6 shows the curve of hydrogen absorption with time when absorbing hydrogen at different temperatures under the same initial pressure. Figure 7 shows the relationship between hydrogen absorption capacity and time at the same hydrogen absorption temperature and different initial pressure. Obviously, on the diagram, each curve consists of two straight lines with different slopes. The straight line corresponding to the part with high hydrogen absorption capacity has a smaller slope. With the increase of temperature or the decrease of initial pressure, the slope difference between the two parts of each curve is so small that it is very close.
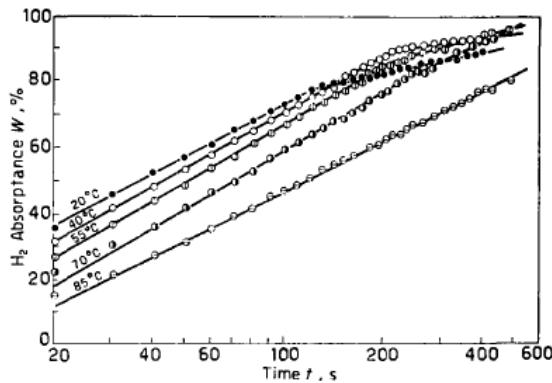
Fig. 6: The initial pressure is 30.7atm and the hydrogen absorption capacity of LaNi5 varies with time at different temperatures [9]
 Fig. 7: Variation of hydrogen uptake of LaNi5 with time at different initial pressure [9]
In addition, the hydrogen absorption rate changes when the initial pressure decreases or the hydrogen absorption temperature changes. First discuss the first part of the line on the diagram, according to the above results, it can be expressed by the following formula:
$$
W = A \left(T, P _ {0}\right) \log t + B: \tag {5}
$$
Among them, A, B has nothing to do with time, T is the hydrogen absorption temperature, $P_0$ is the initial pressure, and the hydrogen absorption rate is obtained by time differential.
$$
d W / d t = A \left(T, P _ {0}\right) / t \tag {6}
$$
That is, there is a linear relationship between the hydrogen absorption rate and the reciprocal of time.
The hydrogen absorption reaction of $\mathrm{LaNi}_5$ is:
$$
\mathrm {L a N i} _ {5} + 3 \mathrm {H} _ {2} \rightarrow \mathrm {L a N i} _ {5} \mathrm {H} _ {6}.
$$
The hydride formation process must include the following steps: the decomposition of hydrogen into hydrogen atoms on the metal surface, that is, the surface reaction; the diffusion of hydrogen atoms into the metal; and the phase transition from intermetallic compounds to their hydrides. In this way, the hydrogen absorption rate should be controlled by the slowest of the three processes, and they are all thermal activation processes. No matter which one controls the hydrogen absorption rate, A(T,P0) can be written:
$$
A = A ^ {\prime} \left(T, P _ {0}\right) e ^ {- U / R T} \tag {7}
$$
In the formula, $U$ is the activation energy of process; $R$ is gas constant. The $T$ is absolute temperature of hydrogen absorption, $A$ should also include factors related to the driving force, because when the initial pressure or temperature changes, the hydrogen absorption rate is also different. It can be seen from the P-C-T diagram, that there is a corresponding equilibrium pressure $P_{\text{Average}}$ at a certain hydrogen absorption temperature. Therefore, for a certain initial pressure $P_0$, the equilibrium pressure corresponding to $T$ and $T_0$ is $P_0$, so $T_0 - T$ can be used as the driving force for hydrogen absorption.
$$
A = A_0 (T_0 - T) e^{-U / R T}
$$
$A_0$ is a constant. So the formula (5) becomes:
$$
W = A _ {0} \left(T _ {0} - T\right) e ^ {- U / R T} \log t + B \tag {9}
$$
Because when $\mathrm{T} = \mathrm{T}_0$ does not actually absorb hydrogen, it deduces $\mathrm{B} = 0$. According to the Van't-Hoff relation, there are
$$
\ln P _ {\text {平}} = \frac {\Delta H}{R T} - \frac {\Delta S}{R} \tag {10}
$$
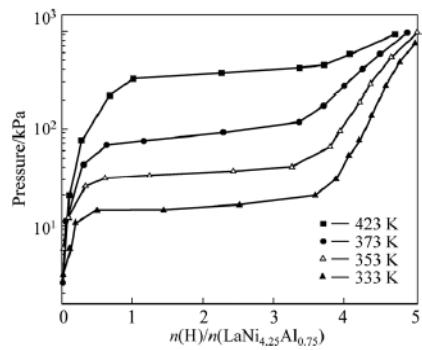 Fig. 8: PC isotherm curve of hydrogen absorption of LaNi4.25Al0.75 alloy at different initial activation temperatures.
$\Delta H$ and $\Delta S$ are the changes of enthalpy and entropy during the formation of $\mathrm{LaNi}_5\mathrm{H}_6$ by $\mathrm{LaNi}_5$, respectively. $P_{Average}$ is the equilibrium pressure corresponding to $T$, which can be obtained by $\ln P_{Average} \sim 1 / T$:
$$
\Delta H = -7.4\,\mathrm{kcals}/\mathrm{mol}\,H_2
$$
$$
\Delta S = - 2 5. 2 c a l / ^ {\circ} C \cdot H
$$
Finally, the expression of hydrogen absorption rate is obtained:
$$
\frac {d W}{d t} = A _ {0} \left(T _ {0} - T\right) e ^ {- U / R T} \cdot \frac {1}{t} \tag {12}
$$
The time $t$ is in seconds, $A_0 = 0.13$, and the activation energy is $2.0 \, \text{kcal/mol} \, H2 = 8.346 \, \text{J} \pm 0.834 \, \text{J/mol} \, H2$. The quantitative relationship between hydrogen absorption rate and initial pressure, temperature and time is established. When $W$ is higher, it can also be approximated by
$$
W = A_0' (T_0 - T) e^{-U' / RT} \cdot \log t
$$
[\mathrm{U} = 3.2\mathrm{kcal/molH_2} = 13.3824\mathrm{J/molH_2}, \quad A_0' = 0.97] ii. Kinetic characteristics of hydrogen storage in LaNi5-xAlx [10d11]
Figure 8 shows the hydrogen absorption P-C isothermal curve (P-C-T) of $\mathrm{LaNi}_{4.25}\mathrm{Al}_{0.75}$ alloy after initial activation at $333\mathrm{k}$, $353\mathrm{K}$, $373\mathrm{K}$ and $423\mathrm{K}$, the hydrogen storage capacity of the alloy decreases systematically, and the hydrogen absorption plateau pressure increases obviously with the increase of temperature. The relation function between platform pressure $(p_{eq})$ and temperature is In $p_{eq} = -4820 / T + 12.46$. At $353\mathrm{k}$ is the molecular formula of saturated hydride $\mathrm{LaNi}_{4.25}\mathrm{Al}_{0.75}\mathrm{H}_{4.2}$. Compared with $\mathrm{LaNi}_5\mathrm{H}_6$, the saturated hydrogen absorption capacity of $\mathrm{LaNi}_{4.25}\mathrm{Al}_{0.75}$ is reduced by nearly $30\%$, and the platform pressure is also significantly reduced.
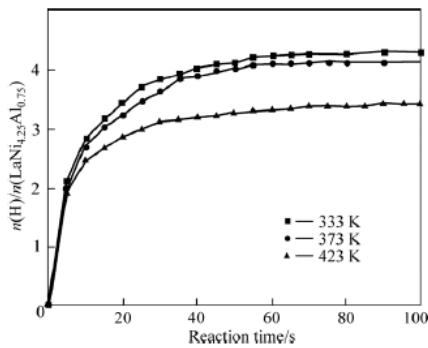 Fig. 9: Hydrogen absorption Kinetic Curve of LaNi4.25Al0.75 Alloy at different temperatures
The kinetic curve of hydrogen absorption of $\mathrm{LaNi_{4.25}Al_{0.75}}$ alloy after 25 cycles of $1020\mathrm{kPa}$ (initial pressure of hydrogen absorption vessel) is shown in figure 9. At 333k and 373K 60 seconds, one mole of $\mathrm{LaNi_{4.25}Al_{0.75}}$ can absorb more than 4 moles of $\mathsf{H}_2$, but only 3 moles of $\mathsf{H}_2$ in 423K100 seconds. The hydrogen absorption rate decreases with the increase of temperature.
Zhang Ruijing, Lu Manqi and Cao Li studied the effect of x on hydrogen storage performance in $\mathrm{LaNi}_{5-x}\mathrm{Al}_x$ [12]. The pressure-composition isotherm (P-C-T) of $\mathrm{LaNi}_{5-x}\mathrm{Al}_x$ alloy at 333, 353, 373K shows that at the same temperature, the equilibrium pressure of the alloy decreases with the increase of Al content, and the platform length, namely hydrogen absorption capacity, decreases.
According to the above results, some people think that "the research results generally show that the saturated hydrogen absorption capacity of metal hydride hydrogen storage materials decreases with the increase of temperature under certain hydrogen pressure". What is the situation? is this the case for all alloy hydrogen storage materials? let's take a look at the experimental results below.
### d) Kinetic characteristics of hydrogen absorption and desorption of Mg hydrogen storage alloys
i. Hydrogen absorption-desorption kinetics of Mg88Y12 alloy [13]
The hydrogen absorption and desorption kinetics curves of $\mathrm{Mg_{88}Y_{12}}$ alloy obtained by Yang Yuan and Bu et al. [13] are shown in Fig. 10 (a) and (b), respectively. As can be seen from figure 10 (a), the sample with temperature $\geq 290^{\circ}\mathrm{C}$ shows a better kinetic curve, which is lower than $290^{\circ}\mathrm{C}$, showing poor kinetic function, but it can still absorb $2.63\mathrm{wt}\%$ and $3.94\mathrm{wt}\%$ hydrogen within 60 minutes under $100^{\circ}\mathrm{C}$ and $150^{\circ}\mathrm{C}$; the alloy shows good kinetics for hydrogen desorption at relatively high temperature, and the hydrogen energy under $380^{\circ}\mathrm{C}$ is completed within 10 minutes. But it is related to temperature and becomes very bad below $320^{\circ}\mathrm{C}$. As shown in figure 10 (b), $290^{\circ}\mathrm{C}$ is completely hydrogenated for about $400\mathrm{min}$.
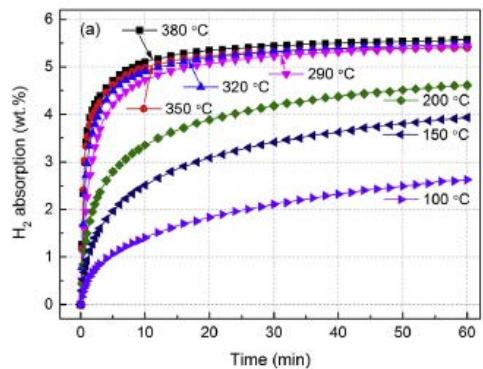
Fig. 4 (b): Kinetic curves of Ti-Fe-Mn alloy replaced by Cu and Y at $10^{\circ}\mathrm{C}$, $30^{\circ}\mathrm{C}$ and $40^{\circ}\mathrm{C}$ respectively under 2.7MPa pressure [6]
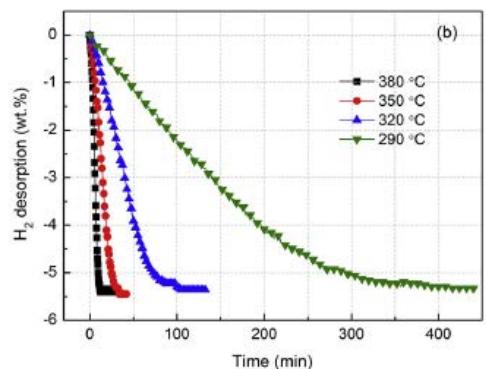 Fig. 10: Isothermal hydrogen absorption/desorption kinetics curve of Mg88Y12 alloy
- (a) Absorbing hydrogen under 3MPa hydrogen pressure.
- (b) Hydrogen desorption below $0.03\mathrm{MPa}$ hydrogen pressure [13]
There are three models to describe the different kinetic stages of hydrogen absorption and desorption: (a) surface reaction model, (b) Johnson-Mehl-Avrami (JMA) model. (c) shrinking volume (CV). Yang gives the best results by fitting the hydrogen evolution curve with JAM model, which is used in the case of nucleation and growth during hydrogen absorption and desorption. The JMA equation is expressed as follows:
$$
[ - \ln (1 - \alpha) ] ^ {1 / n} = k t \tag {14}
$$
Here, $\alpha$ is the reaction fraction, $k$ is the rate constant and $n$ is the reaction order. According to the fitting results, the $n$ value of the hydrogen evolution reaction is taken as 3. Figure 11(a) shows that the hydrogen kinetics $[- \ln (1 - \alpha)]^{1 / 3}$ is plotted to t at different temperatures. It is clear that there is a good linear relationship between $[- \ln (1 - \alpha)]^{1 / 3}$ and reaction time. This shows that $\mathrm{Mg}_{88}\mathrm{Y}_{12}$ dehydrogenation follows a three-dimensional growth process controlled by the interface and nucleation at the same time.
In order to further understand the dehydrogenation kinetics of Mg88Y12 alloy, the activation energy $E_{\mathrm{des}}$ of hydrogen evolution was determined by Arrhenius equation.
$$
\ln k = -\frac{E_{\mathrm{des}}}{RT} + \ln k_{0}
$$
Here, $k$ is the kinetic rate constant of hydrogen evolution derived from the equation, $E_{\mathrm{des}}$ is the activation energy of the hydrogen evolution process, $R$ is the gas constant, $T$ is the absolute temperature, and $k$ is the frequency factor. The Arrhenius of de-hydrogenation kinetics is shown in Fig. 11 (b), and the activation energy of hydrogen desorption is calculated to be
122kJ/mol. In addition, it is worth noting that the hydrogen absorption kinetic curve can not be well fitted by the above three models. As shown in figure 11(a), the hydrogenation rate is fast in the first few minutes, and then the hydrogenation rate is obviously slow, which can be explained as follows: in the initial hydrogen absorption process, the alloy quickly absorbs a lot of $\mathsf{H}_2$ and forms a near-surface hydride layer, after which the hydrogenation rate will be very slow. The reason is that hydrogen diffuses very slowly in the hydride layer, which becomes the rate limiting factor in the subsequent hydrogenation process.
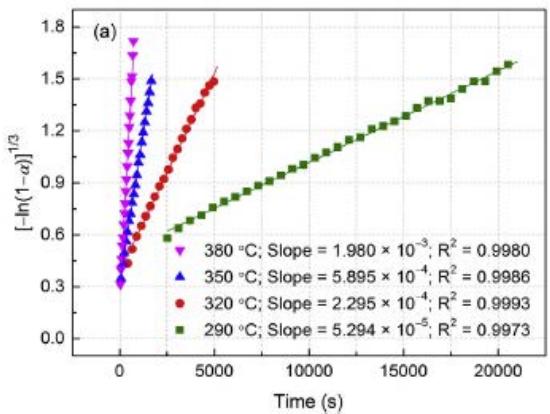
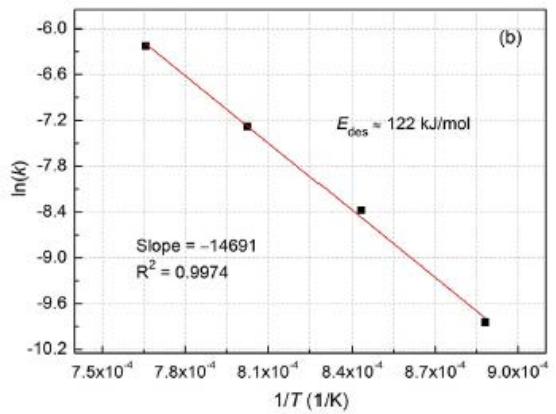 Fig. 11: (a) Drawing of hydrogen desorption kinetics
$\left[-\ln (1 - \alpha)\right]^{1 / 3}$ to t of hydrogenated $\mathrm{Mg_{88}Y_{12}}$ alloy at different temperatures. (b) Arrhenius drawing of de-hydrogenation kinetics [13] ii. Kinetic characteristics of hydrogen absorption and desorption of Mg-Cu alloy [14]
Wu, Li and Zhang[14] reported that the kinetic curve of hydrogen absorption of undoped, Y-doped and Ni-doped $\mathrm{Mg}_2\mathrm{Cu}$ alloy under 4Mpa pressure is shown in figure 12. it can be seen that the hydrogen absorption rate of undoped samples becomes faster when the hydrogenation temperature is increased to $300^{\circ}\mathrm{C}$, and the full hydrogen absorption energy is completed in 5 minutes, as shown in figure 12 (a). For Y-doped and Ni-doped samples, the full hydrogen absorption is completed in 10 minutes and $300^{\circ}\mathrm{C}2$ minutes, as shown in figure 12 (b). This means that both nanostructured $\mathrm{Mg}_{2}\mathrm{Cu}$ alloy and $\mathrm{YH}_{2} / \mathrm{YH}_{3}$ embedded in $\mathrm{Mg}_{2}\mathrm{Cu}$ matrix have good catalytic effect on $\mathrm{Mg}_{2}\mathrm{Cu}$ disequilibrium reaction.
In order to understand the hydrogen evolution characteristics of undoped $\mathrm{Mg}_2\mathrm{Cu}$ and Y-doped and Ni-doped samples, the isothermal dehydrogenation curve is needed, as shown in figure 13. It can be seen that the hydrogen de-absorption is slower than absorption at $300^{\circ}\mathrm{C}$ in kinetics. When the de-hydrogenation temperature increases to $350^{\circ}\mathrm{C}$, $\mathrm{Mg}_2\mathrm{Cu}$ and Y-doped and Ni samples are $0.99\%$
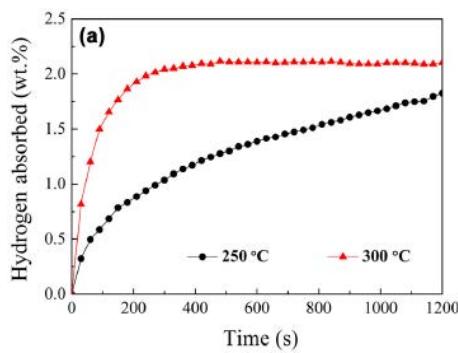
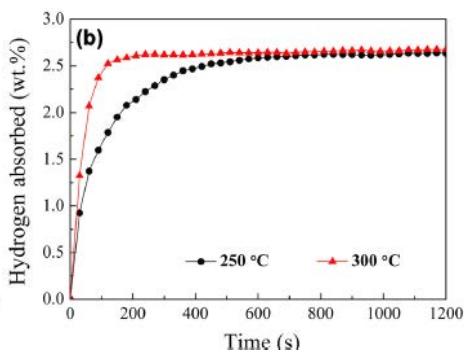 Fig. 12: Hydrogen storage and absorption time curve of Mg alloy [14],
(a) undoped Mg2Cu sample (b) Y, Ni doped sample and $1.93\%$ hydrogen respectively within 3 minutes, indicating that the $\mathrm{Mg}_2\mathrm{Cu}$ samples doped with Y and Ni have better hydrogen desorption kinetics than the undoped samples. As mentioned above, $\mathrm{MgCu}_2$ and $\mathrm{MgH}_2$ exist together with $\mathrm{Mg}_2\mathrm{NiH}_4$, $\mathrm{YH}_2$ and $\mathrm{YH}_3$ in the hydrogenated, Y-doped and Ni-doped $\mathrm{MgCu}_2$ samples, so the nanostructured $\mathrm{Mg}_{2}\mathrm{NiH}_{4}$ and $\mathrm{YH}_{2} / \mathrm{YH}_{3}$ also have catalytic effects on the reverse reaction.
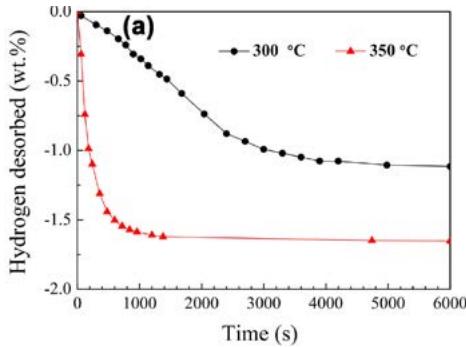
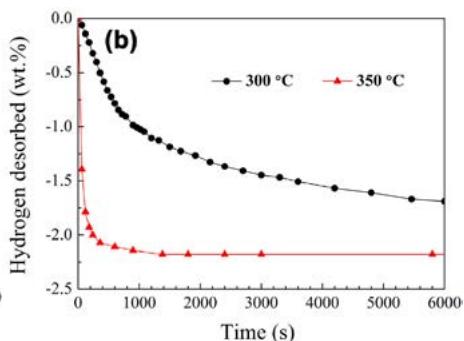 Fig. 13: Isothermal desorption hydrogenation curve of dehydrogenated materials [14],
(a) unmixed $\mathrm{Mg_2Cu}$ samples, (b) $\mathrm{Mg_2Cu}$ samples doped with Y and Ni iii. Kinetic characteristics of hydrogen absorption and desorption of Mg hydrogen storage alloy catalyzed by $1\mathrm{mol}\% \mathrm{Nb}_2\mathrm{O}_5$ [15]
Fig. 14 shows the hydrogen absorption curve of Mg hydrogen storage alloy catalyzed by $1\mathrm{mol}\% \mathrm{Nb}_2\mathrm{O}_5$ [15]. At lower hydrogen pressure (0.2Mpa), the initial hydrogen absorption rate and saturated hydrogen absorption capacity increase with the increase of temperature. However, when the hydrogen pressure is 1.0Mpa, the initial hydrogen absorption rate and hydrogen absorption capacity of $250^{\circ}\mathrm{C}$ are lower than that of $150^{\circ}\mathrm{C}$ (before 30 seconds), and when the hydrogen pressure is 3.0Mpa, there is a cross scenario. The initial hydrogen absorption rate (before 30 seconds) is lower than that of $150^{\circ}\mathrm{C}$. The cross scenario occurs when the hydrogen pressure is in 3.0Mpa.
### e) Summary
The contents of this section are summarized as follows:
1. At constant temperature and different hydrogen pressure, the initial hydrogen absorption rate increases with the increase of hydrogen pressure, and the hydrogen saturation increases with the increase of hydrogen pressure. The four types of alloy hydrogen storage materials all conform to this law, and the "initial hydrogen absorption rate" mentioned here is known from the slope of the initial kinetic curve.
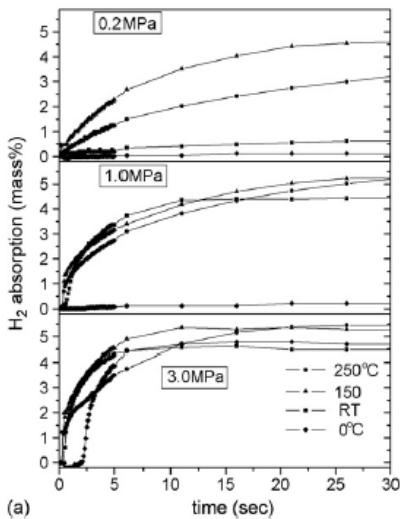
 Fig. 14: Hydrogen absorption curve of Mg alloy catalyzed by
$\mathrm{Nb}_{2} \mathrm{O}_{5}$ [15], at 0, 20, 150, $250^{\circ} \mathrm{C}$ and at 0.2, 1.0, 3.0MPa hydrogen pressure. (a) reaction time to 30 seconds; (b) 0.2 and 1.0Mpa reaction time to 18000 seconds; 3.0Mpa time to 10000 seconds
2. At constant hydrogen pressure and different temperature, there are two opposite situations of initial hydrogen absorption rate and hydrogen saturation with temperature: (i) the initial hydrogen absorption rate and hydrogen saturation decrease with the increase of temperature. AB-type TiFe, $\mathsf{AB}_{2}$ -Laves and $\mathsf{AB}_{5}$ -type rare earth hydrogen storage materials accord with this situation, but Mg hydrogen storage materials do not conform to this law. (ii) the initial hydrogen absorption rate and hydrogen saturation increase with the increase of temperature, Mg series hydrogen storage materials accord with this situation, but AB type TiFe system, AB2 type Laves phase and AB5 type rare earth series hydrogen storage materials do not.
The two opposing laws in point (2) seem to be very contradictory and difficult to understand, but these are experimental facts and cannot be questioned. This may show the characteristics of two kinds of alloy hydrogen storage materials, which is the problem to be studied in this chapter.
## III. STRUCTURAL EVOLUTION OF HYDROGEN STORAGE MATERIALS DURING HYDROGEN ABSORPTION AND DESORPTION
In the books and literature "hydrogen storage materials" [16], "Properties and applications of metal hydrides"[17] and "Hydrogen in Intermetallic Compounds" [18], it is often referred to as "metal hydride" hydrogen storage. Therefore, the products of metals and their alloys after hydrogen absorption are metal/alloy hydrogen compounds. Is it true that all alloy hydrogen absorbing materials are "hydrogen compounds" after absorbing hydrogen? It is worthy of experimental study and analysis. In order to study this problem, we must start with the crystal structure evolution of hydrogen storage materials in the process of hydrogen absorption and desorption.
In order to study the structural evolution of hydrogen storage materials in the process of hydrogen absorption and desorption, the key is to correctly identify and judge the intermediate products and final products in the process of hydrogen absorption and desorption.
For the convenience of the following discussion, two concepts of "metal hydride" and "alloy hydrogenated solid solution" are introduced. The crystal structure of the hydrogenated solid solution of the alloy is the same as that of the parent phase, which is not only the same space group, but also the same crystal structure. Because hydrogen is the first element in the periodic table, and the atomic radius is much smaller than that of the metal atom, the hydrogen atom may only occupy the interstitial position of the parent phase, forming an alloy interstitial solid solution, resulting in only a small change in the lattice parameters of the parent phase. And the change of lattice parameters is related to the concentration of hydrogen absorption and desorption. The structure of the hydride phase is different from that of the parent phase, because the hydrogen atom may not occupy the interstitial position, but occupy a certain crystallographic lattice position, and the diffraction pattern different from the parent phase should be given, so it is easier to determine whether it is a hydride or not.
If during the formation of the hydride phase, the hydrogen atom occupies the interstitial hole position of the original parent phase and forms the hydride, then the crystal structure of the hydride keeps the structure of the parent phase unchanged, which is called interstitial hydride, and its essence is hydrogenated solid solution.
The X-ray diffraction patterns of polycrystalline materials, like human fingerprints, can make a correct judgment of the phase. It is based on the standard data in the powder diffraction file (PDF) databasePCPDFwin of the International Center of diffraction data (ICDD)-[19]. Its method is introduced in detail in the relevant chapters of "Phase diffraction Analysis" [20] and "Ray diffraction and scattering Analysis of material"[21]. According to the methods introduced in Chapter 12 of this book: 1) search/match and judge the diffraction patterns of the analytical samples; 2) when the crystal structure data of each hydride phase (crystal system, space group, lattice parameters and the position and occupation probability of each atom in the cell) are known, the analytical patterns can be fitted by Reitveld full spectrum fitting-refinement. However, the key is the experimental means and methods of observation of alloy hydrogen storage materials in the process of hydrogen absorption and desorption. An online (in situ) diffraction device for laboratory X-ray source and synchrotron radiation X-ray has been developed both at home and abroad, which can make real-time dynamic observation and analysis of hydrogen storage materials in the process of hydrogen absorption and desorption. Another important problem is that it is better to have the participation of diffraction analysis experts.
a) Structural evolution of Ti alloys during hydrogen absorption and desorption [6]
Fig. 15(a) shows the XRD pattern of the newly synthesized Ti-Fe-Mn samples replaced by Cu and Y by Wajid Ali et al. From the diagram, it can be seen that the main diffraction peaks belong to the TiFe phase with CsCl ordered structure, but no other phases are found. The Rietveld analysis results are shown in figure 14(b) and listed in Table 4.
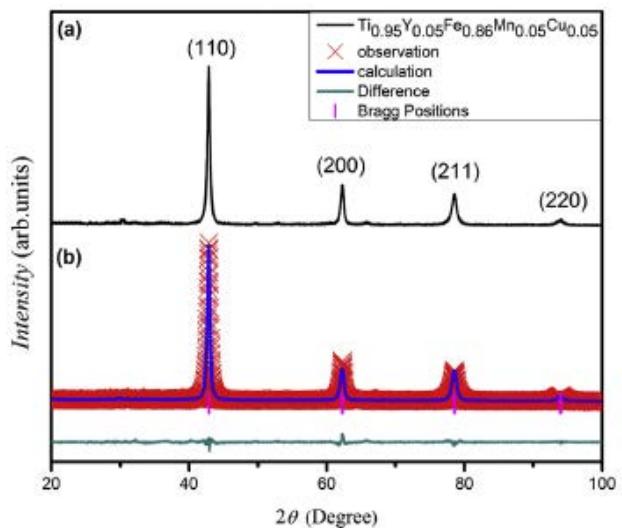 Fig. 15: (a) substituting Cu and Y for XRD patterns of synthetic Ti-Fe-Mn samples, (b) Rietveld refinement results [6]
Table 4: Analytical results of synthetic and hydrogenated Ti-Fe-Mn samples replaced by Cu and Y [6]
<table><tr><th>Samples</th><th>Structure type</th><th>Latticeparameter (nm)</th><th>Density. (g/cm3)</th><th>Volume (10-6pm-3)</th></tr><tr><td>TiFe</td><td>CsCl-type</td><td>0.2976</td><td>6.53</td><td>30.40</td></tr><tr><td>Fresh casting Ti-Fe-Mnalloy</td><td>CsCltype</td><td>0.2983</td><td>6.89</td><td>30.54</td></tr><tr><td>After absorbing hydrogen</td><td>CsCl-type</td><td>0.2990</td><td>6.47</td><td>30.73</td></tr></table>
- It can be seen from Fig. 15 and Table 4 that the crystal structure of the sample does not change, only the lattice parameters and cell volume increase, regardless of hydrogen absorption or desorption. This shows that the hydrogen absorption process is the formation of hydrogenated solid solution TiFe-H $_n$, and the hydrogen desorption process is the decomposition of hydrogenated solid solution TiFe-H $_n$. It is believed that the hydrogenation behavior of TiFe alloy has undergone a process from TiFe $_5$ (cubic crystal) to TiFeH $_{1.04}$ (tetragonal intermediate hydride phase) and then to TiFeH $_{1.95}$ (cubic crystal, saturated hydride phase). However, the diffraction cards of the two phases can not be found in the PCPDFwin database, maybe the TiFeH $_{1.04}$ and TiFeH $_{1.95}$ are hydrogenated solid solutions TiFe-H $_{1.04}$ and TiFe-H $_{1.95}$.
b) Structural evolution of Laves phase $\mathrm{TiCr_2}$ hydrogen storage alloy during hydrogen absorption and desorption In order to further study the hydrogen absorption nature of $\mathrm{TiCr_2}$ Laves phase BCC phase, the XRD patterns of samples before and after hydrogen absorption and desorption are shown in figure 16. From figure 16, it can be seen that the two samples prepared by mechanical alloying (MA) and mechanical grinding (MG) maintain the BCC structure. Because the hydrogen atom enters the interstitial position of BCC, which leads to the increase of lattice parameters, so the spectral lines of both samples shift to low angle. This shows that the hydrogen absorption mode of this BCC structure is mainly alloy interstitial solid solution, and there is no phase transformation. Because the hydrogen absorption capacity of the sample prepared by mechanical alloying is larger than that of the mechanical grinding sample, the maximum hydrogen absorption capacity is $1\mathrm{wt}\%$ and the displacement of the former is larger than that of the latter before and after hydrogen absorption. However, the shift of the diffraction peak to the low angle of the mechanically ground sample is larger in figure 16, which may be due to the large hydrogen release of the mechanically alloyed sample, and the remaining hydrogen content of the mechanically alloyed sample is lower than that of the mechanically ground sample, so the low angle displacement of the latter is larger.
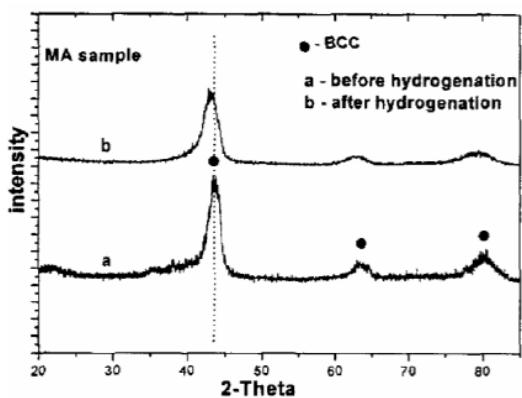
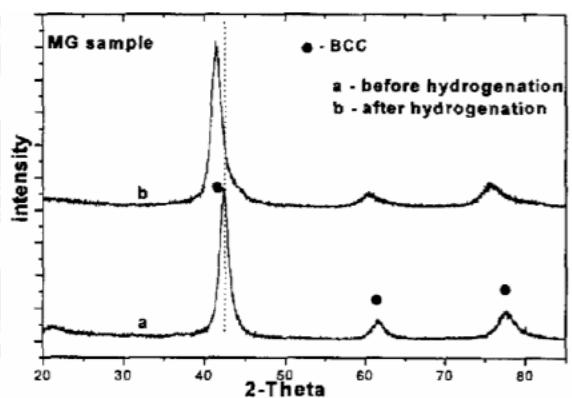 Fig. 16: Diffraction pattern of before and after hydrogen absorption for cubic TiCr2 alloy prepared by mechanical alloying (MA) and mechanical grinding (MG)[28]
In addition, the results of the study of $\mathsf{AB}_2$ Laves phase listed in Table 5[29]. From the above results, it is known that the hydrogen absorption of Laves phase hydrogen storage alloy is larger than that of hydrogen storage alloy. The multi-structure does not change and the parent phase interstitial solid solution is formed.
ZrMn2
<table><tr><td>AB2Intermetallic compound Laves phase</td><td>Available data of hydride</td><td>Reference</td></tr><tr><td>ZrM2(M=V,Cr,Mn,Co,Mo)</td><td>The compound is the solid solution of the parent phase</td><td>[30]</td></tr><tr><td>Zr(CoxM1-x)2,M=V,CrMn, 0<x<1</td><td>There is no evidence of phase transition, so it is a solid solution.</td><td>[31], [32]</td></tr><tr><td>Zr(VxFe1-x)2,Zr(MnxFe1-x)2,Ti(VxFe1-x)2,Ti(MnxFe1-x)2</td><td>No structural study has been carried out</td><td>Brookhaven National Lab., 1977, 1978, 1979</td></tr><tr><td>TiCr2</td><td>the TiCr1.8H2.1~TiCr1.8H3.6composition range is orthogonal structure.</td><td>[33]</td></tr><tr><td>Zr(AlxCr1-x)2Zr(AlxCr1-x)2 0<x<1</td><td>No structural change was observed.</td><td>[34]</td></tr><tr><td>ZrMn2</td><td>Maintain hexagonal (C14) structure, deuterium atom occupies6h(1)、6h(2)、22kand 24/, The occupancy probability is respectively0.052、0.312、0.376and0.179</td><td>[35]</td></tr><tr><td>ZrV2</td><td>Maintain cubic (C14) structure, deuterium atom occupies8b、32e and 96g, occupancy probability is respectively0.002、0.387、0.249</td><td>[36]</td></tr></table>
### c) Structural evolution of AB5 type rare earth alloys during hydrogen absorption and desorption
i. In situ X-ray diffraction study on the hydrogen absorption and desorption process of LaNi $_{4.83}$ Sn $_{0.314}$ [37 ~ 38]
Yuan Zhiqing, Lu Guanglie, Zeng Yuewu et al. In situ X-ray diffraction study on hydrogen absorption and desorption process of over stoichiometric rapid solidification alloy $\mathrm{LaNi_{4.83}Sn_{0.314}}$. The XRD patterns and Rietveld structure refinement results of the main stages in the hydrogen charging and desorption process are shown in figure 17. It can be found from Fig. 17 that there are $\alpha + \beta$ two phases in hydrogen absorption to $x = 2.0$, only one phase in $x = 4.0$, and two phases in hydrogen desorption to $x = 1.5$. Therefore, LaNi $_{4.83}$ Sn0. $_{314}$. The phase transition of the alloy during hydrogen charging and desorption shows a typical $\alpha \rightarrow \alpha + \beta \rightarrow \beta$ process, but the phase transition is pseudo-phase transition, that is, the crystal structure remains unchanged, as shown as shown in figure 17 (a) and (c), but the lines are obviously shifted to a low angle. $\alpha$ and $\beta$ phases exist at the same time, indicating that both hydrogen absorption and hydrogen desorption have a process from the surface of the particles to the interior of the particles. With the deepening of the hydrogen charging process, the $\alpha$ phase content decreases and $\beta$ phase increases, while this change of phase content in the process of hydrogen evolution is the opposite.
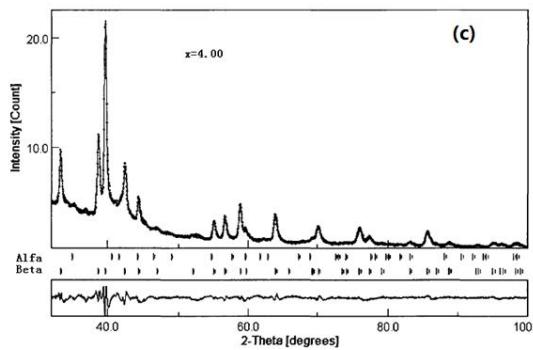
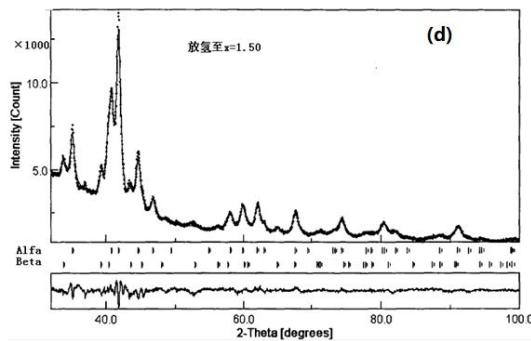 Fig. 17: XRD Pattern and Reiveld finishing results [37, 38] during hydrogen absorption of
$\mathrm{LaNi_{4.83}Sn_{0.314}}$ alloy, (a) in the original sample $(x = 0.0)$; (b) $2.0$; (c) $4.0$ and (d) then desorption to $x = 1.5$
## ii. Quasi-dynamic XRD study on the charge and discharge process of Ni-MH battery
The XRD spectrum of the negative electrode active material $\mathrm{AB}_{5}$ in several stages of charge and discharge of Ni-MH battery is shown in figure 18. On the whole, the structure of $\mathrm{AB}_{5}$ alloy has no obvious change during charging, but the fine structure and microstructure have change. The lattice parameters a and c of $\mathrm{AB}_{5}$ alloy increase with the increase of charging depth, and the micro-strain $\varepsilon$ increases with the increase of charging depth. The discharge situation is just the opposite, but it returns to the original state, which indicates that there are some irreversible factors in the charge-discharge process. The results show that the crystal structure of $\mathrm{LaNi}_5$ remains unchanged during the hydrogen absorption and discharge process of Ni-MH battery, but the microstructure parameters change accordingly. In other words, the process of hydrogen absorption and desorption is the formation and decomposition of interstitial solid solution of $\mathrm{LaNi}_5$ alloy.
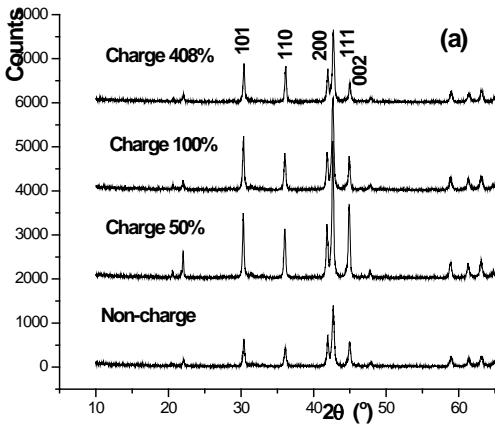
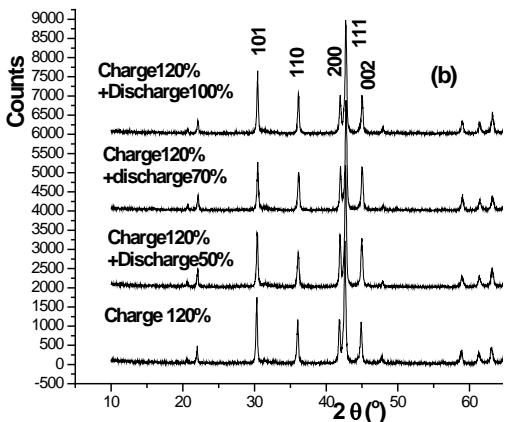 Fig.18: XRD pattern of negative electrode active material
$\mathrm{AB}_{5}$ alloy at several stages of charge (a) discharge (b) [39jue 40] iii. Experimental study on $LaNi_{5}$, $LaNi_{5-x}Al_x$, $LaNi_{5-x}Mn_x$ and their deuteride structures [42]
LaNi5's experimental neutron diffraction pattern is given in figure 19, and the coarse looks very different, but after careful indexing and analysis, it is found that: 1) the position distribution of the diffraction lines is the same, and only the diffraction lines of deuteride are systematically shifted to a low angle, indicating that the crystal structures of the two are the same; 2) the diffraction lines of deuteride are obviously broadened and many lines have seriously overlapped. 3) the relative intensity of the line also changes obviously, which indicates that the deuterium atom participates in the diffraction after entering the gap position, which contributes to the diffraction intensity.
The refinement parameters of the Reitveld method are given to Table 6 and the refinement results are given to Table 7. It can be seen that the simulation results of the five-site model are more complex with the reality, indicating that the crystal structure of deuteride in $\mathrm{LaNi}_5$ is the same as that of the parent phase, only because the deuterium atoms in the interstitial position participate in the diffraction, which makes the diffraction line system shift to the low angle direction and the line broadens, which is attributed to grain refinement and micro-strain. It is also known that Mn replaces 2c and 3g site of Ni, while Al only replaces 3G site of Ni.
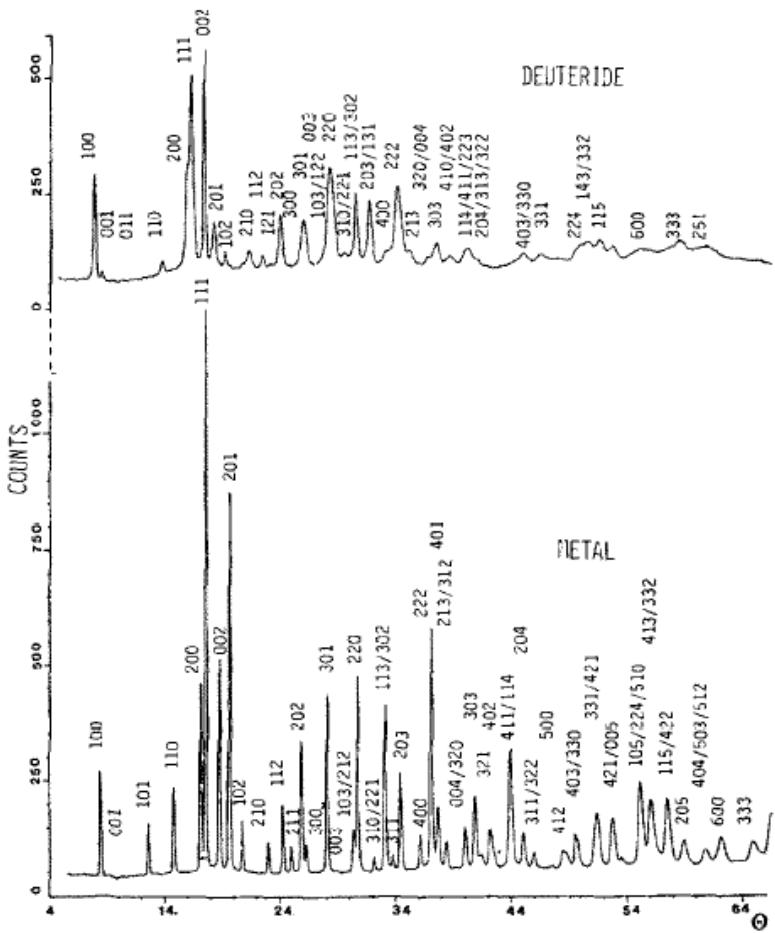 Fig. 19: Experimental neutron diffraction pattern of
$\mathrm{LaNi}_5$ (top) and its deuteride (bottom) [42], $\lambda = 0.128\mathrm{nm}$
Table 6: Refining factor parameters of intermetallic compound LaNi_{5} -xMx (M=Mn,Al) [42]
<table><tr><td>Nominal component</td><td>La1-sNi5+2s</td><td>LaNi4.5Mn0.5</td><td>LaNi4Mn</td><td>LaNi3Mn2</td><td>LaNi4Al</td></tr><tr><td>a (Å)Neutron</td><td>5.017</td><td>5.047</td><td>5.086</td><td>5.174</td><td>5.064</td></tr><tr><td>X-ray</td><td>5.016</td><td>5.045</td><td>5.089</td><td>5.174</td><td>5.069</td></tr><tr><td>C(Å)Neutron</td><td>3.986</td><td>4.019</td><td>4.085</td><td>4.145</td><td>4.070</td></tr><tr><td>X-ray</td><td>3.983</td><td>4.022</td><td>4.082</td><td>4.145</td><td>4.074</td></tr><tr><td>s(La)</td><td>0.017</td><td>0.011</td><td>0.005</td><td>0.017</td><td>0.007</td></tr><tr><td>s1(z=0)</td><td></td><td>0.059</td><td>0.128</td><td>0.155</td><td>0.00</td></tr><tr><td>s2(z=0.50</td><td></td><td>0.256</td><td>0.779</td><td>1.643</td><td>0.938</td></tr><tr><td>x(Ni-III)</td><td>0.287</td><td>0.285</td><td>0.283</td><td>0.278</td><td>0.283</td></tr><tr><td>z(Ni-IV)</td><td>0.313</td><td>0.310</td><td>0.305</td><td>0.301</td><td>0.305</td></tr><tr><td>Refined element La</td><td>0.983(3)</td><td>0.989(3)</td><td>0.995</td><td>0.983</td><td>0.993</td></tr><tr><td>Ni</td><td>5.03(3)</td><td>4.71(4)</td><td>4.10</td><td>3.24</td><td>4.08</td></tr><tr><td>M</td><td></td><td>0.32(3)</td><td>0.91</td><td>1.80</td><td>0.94</td></tr><tr><td>Normalized component</td><td>LaNi5.12</td><td>LaNi4.76Mn0.92</td><td>LaNi4.12Mn0.91</td><td>LaNi3.29Mn1.83</td><td>LaNi4.10Al0.94</td></tr><tr><td>Refined Rfactor (%)</td><td>4.41</td><td>5.0</td><td>6.41</td><td>5.98</td><td>5.84</td></tr></table>
Table 7: Comparison of refinement of LaNi5 deuteride with two-site model and five-site model
<table><tr><td>Atom</td><td>Position</td><td colspan="3">x y z</td><td>B</td><td>N</td></tr><tr><td colspan="7">Two-position model, P31m, No.157, Hexagonal system, R=16.11%</td></tr><tr><td>La</td><td>1a</td><td>0</td><td>0</td><td>0</td><td>2.05</td><td>0.98</td></tr><tr><td>Ni1</td><td>2h</td><td>1/3</td><td>2/3</td><td>0.93</td><td>1.63</td><td>1.90</td></tr><tr><td>Ni2</td><td>3c</td><td>0.74</td><td>0</td><td>0.46</td><td>2.32</td><td>3.0</td></tr><tr><td>Ni3</td><td>6d</td><td>0.27</td><td>0.54</td><td>0.02</td><td>1.63</td><td>0.10</td></tr><tr><td>Ni4</td><td>1a</td><td>0</td><td>0</td><td>0.29</td><td>1.63</td><td>0.04</td></tr><tr><td>D1</td><td>3c</td><td>0.49</td><td>0</td><td>0.06</td><td>1.83</td><td>3.0</td></tr><tr><td>D2</td><td>6d</td><td>0.17</td><td>0.83</td><td>0.50</td><td>1.65</td><td>3.5</td></tr><tr><td colspan="7">Five-position model, P6/mmm No.191, Hexagonal system, R=7.3%</td></tr><tr><td>La</td><td>1a</td><td>0</td><td>0</td><td>0</td><td>3.97</td><td>0.98</td></tr><tr><td>Ni1</td><td>2c</td><td>1/3</td><td>2/3</td><td>0</td><td>1.81</td><td>1.90</td></tr><tr><td>Ni2</td><td>3g</td><td>1/2</td><td>0</td><td>1/2</td><td>0.99</td><td>3</td></tr><tr><td>Ni3</td><td>6l</td><td>0.287</td><td>0.574</td><td>0</td><td>1.81</td><td>0.102</td></tr><tr><td>Ni4</td><td>2e</td><td>0</td><td>0</td><td>0.313</td><td>1.81</td><td>0.034</td></tr><tr><td>D1</td><td>3f</td><td>1/2</td><td>0</td><td>0</td><td>5.75</td><td>0.64</td></tr><tr><td>D2</td><td>4h</td><td>1/3</td><td>2/3</td><td>0.369</td><td>0.72</td><td>0.52</td></tr><tr><td>D3</td><td>6m</td><td>0.136</td><td>0.272</td><td>1/2</td><td>2.31</td><td>1.91</td></tr><tr><td>D4</td><td>12n</td><td>0.455</td><td>0</td><td>0.117</td><td>1.29</td><td>2.14</td></tr><tr><td>D5</td><td>12o</td><td>0.204</td><td>0.408</td><td>0.354</td><td>1.91</td><td>1.29</td></tr></table>
Endo et al. [43] studied the change of crystal structure of $\mathrm{AB}_5$ type alloy by in situ XRD and Rietveld full spectrum fitting method. The phase structure of RTNi4.30Al0.30Mn0.40 is P6/mmm close packed hexagonal lattice before and after hydrogen absorption, while $\mathrm{RTNi}_{3.55}\mathrm{Co}_{0.75}\mathrm{Al}_{0.30}\mathrm{Mn}_{0.40}$ changes from Cmmm (No.65) orthorhombic lattice to P6/mmm close packed hexagonal lattice after hydrogen absorption. Nakanura et al. [44] used neutron diffraction technique to monitor the hydrogen absorption and desorption process of the alloy. The results show that the hydrogen absorption capacity of $\mathrm{LaNi}_{5 - x}\mathrm{Al}_x$ alloy is related to its Al content. With the increase of Al content, the crystal structure of P63mc alloy changes from P63mc to P6mm and then to P6/mmm $(x\geq 0.5)$. For this structural change, it is necessary to further determine the number of H atoms in the hydride phase and the crystallographic location of H.
### d) Structural evolution of hydrogen storage materials during hydrogen absorption and desorption of magnesium system
i. Structural evolution of hydrogen absorption and desorption of $Mg_{88}Y_{12}$ alloy [13]
Wu and Zhang et al. [13] studied the hydrogen absorption and desorption process of $\mathrm{Mg}_{88}\mathrm{Y}_{12}$ alloy. Figure 20 shows the X-ray diffraction pattern of freshly cast $\mathrm{Mg}_{88}\mathrm{Y}_{12}$ alloy. It can be seen that there are main phase $\mathrm{Mg}_{24}\mathrm{Y}_5$ intermetallic phase and a small amount of Mg in the sample, and the relative contents of the two phases are calculated to be 75.9 wt.% ( $\mathrm{Mg}_{24}\mathrm{Y}_5$ ) and 30.1 wt.% (Mg), respectively. $\mathrm{Mg}_{24}\mathrm{Y}_5$ has $\alpha$ -Mn structure, space group I43m nm; Mg 1.1240 is hexagonal, space group P63/mmc, a=0.3228 nm, c=0.5222 nm, c/a=1.6177. The lattice parameters of Mg phase in $\mathrm{Mg}_{88}\mathrm{Y}_{12}$ alloy are larger than those of pure Mg (a=0.3209 nm, c=0.5211 nm), but the lattice parameters of Mg phase are smaller than those of pure Mg (c/a=1.6239). The above results show that Y and Mg atoms are solid soluble in Mg and $\mathrm{Mg}_{24}\mathrm{Y}_5$ phases.
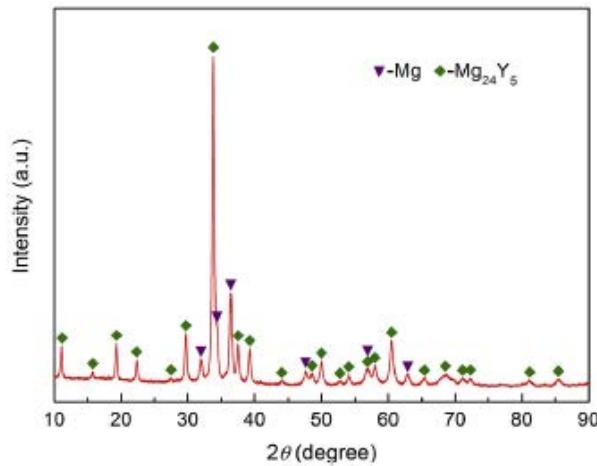 Fig. 20: X-ray diffraction pattern of freshly cast
$\mathrm{Mg}_{88}\mathrm{Y}_{12}$ alloy [13]
The first hydrogenation (activation) curve of $\mathrm{Mg}_{88}\mathrm{Y}_{12}$ alloy at $380^{\circ}\mathrm{C}$, 3MPa pressure is shown in figure 21 (a). It is clear that the first hydrogenation process is very slow. In the first 5 minutes, the hydrogen absorption capacity increases relatively fast, and then slowly increases, reaching the saturated maximum hydrogenation capacity of $6.479\%$ after about 550min. Fig. 21 (b) shows the XRD pattern of $\mathrm{Mg}_{88}\mathrm{Y}_{12}$ alloy at different hydrogenation stages. After about $15\%$ of the saturated hydrogen absorption capacity, the diffraction peak of $\mathrm{Mg}_{24}\mathrm{Y}_5$ phase almost disappears, while the diffraction peak of $\mathrm{YH}_2$ appears, and the diffraction peak of Mg is high. During further hydrogenation, the $\mathrm{MgH}_2$ diffraction peak appears with the decrease of Mg peak and increases slowly. When the saturated $70\%$ $\mathrm{YH}_3$ has a small weak peak, it indicates that a small amount of $\mathrm{YH}_2$ is transformed into $\mathrm{YH}_3$. All hydrogenated alloys contain $\mathrm{MgH}_2$, $\mathrm{YH}_2$ and $\mathrm{YH}_3$ phases. Therefore, the first hydrogenation process consists of the following two reactions:
1) Unbalanced reaction $\mathrm{Mg}_{24}\mathrm{Y}_5 + \mathrm{H}2 \rightarrow \mathrm{Mg} + \mathrm{YH}_2$
2) Initial hydrogenation and $\mathrm{MgH_2}$ formation: $\mathrm{Mg} + \mathrm{H}_2 \rightarrow \mathrm{MgH}_2$;
Partial hydrogenation of $\mathrm{YH_2}$ formed: $\mathrm{YH_2 + H_2\rightarrow YH_3}$
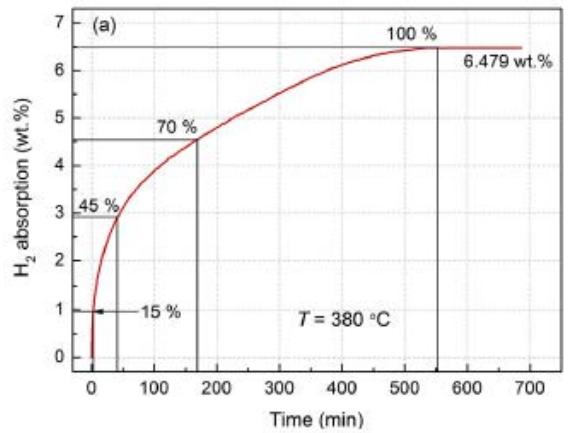
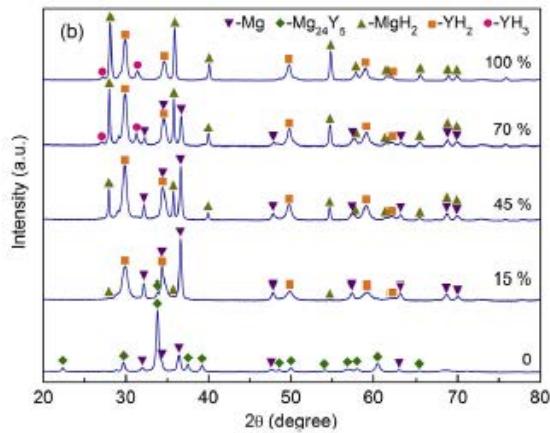 Fig. 21: (a) hydrogen absorption curve of first hydrogenation of
$\mathrm{Mg_{88}Y_{12}}$ alloy,
(b)XRD pattern of alloy at different hydrogen absorption stages [13].
Table 8: Phase structure of ${\mathrm{Mg}}_{88}{\mathrm{Y}}_{12}$ alloy before and after hydrogen absorption and desorption [13]
<table><tr><td rowspan="2"></td><td rowspan="2">Phase%</td><td rowspan="2">Crystal system</td><td rowspan="2">Space group No.</td><td rowspan="2">PDFNo.</td><td rowspan="2">Z</td><td colspan="2">Lattice parameter (nm)</td></tr><tr><td>a</td><td>c</td></tr><tr><td rowspan="2">before absorption</td><td>Mg$_{24}$Y$_{57}$5.9</td><td>Cubic</td><td>I43mNo. 217</td><td>31-0817</td><td>2</td><td>1.1204</td><td></td></tr><tr><td>Mg 30.1</td><td>Hexagonal</td><td>P63/mmc No.194</td><td>35-0821</td><td>2</td><td>0.32093</td><td>0.52112</td></tr><tr><td rowspan="3">After absorption</td><td>YH$_{2}$70%</td><td>Cubic</td><td>Fm-3mNo.225</td><td>12-0388</td><td>4</td><td>0.52077</td><td></td></tr><tr><td>MgH$_{2}$</td><td>Tetragonal</td><td>P42/mnmNo.136</td><td>12-697</td><td>2</td><td>0.4517</td><td>0.30205</td></tr><tr><td>YH$_{3}$</td><td>Hexagonal</td><td>P-3c1 No.165</td><td>12-0385</td><td>6</td><td>0.6358</td><td>0.662</td></tr></table>
ii. Structural evolution of Mg-Cu series alloys during hydrogen absorption and desorption [14,15]
Fig. 22 (a) (b) shows that the $\mathrm{Mg_2Cu}$ samples without Y and Ni are XRD patterns and Rietveld finishing results before hydrogen absorption, respectively, as shown in Table 9. The $\mathrm{Mg_2Cu}$ sample without Y and Ni is the XRD pattern before hydrogen absorption and desorption and the results of Rietveld finishing are shown in figure 23, which is shown in Table 10. A comprehensive comparison of figure 22 and figure 23 and Table 9 and Table 10 shows the fact that hydrogen absorption produces a variety of hydrides and relies on hydrides for hydrogen storage, while hydrogen desorption is the release of hydrogen by hydride decomposition. The hydride phase of $\mathrm{Mg - Cu}$ alloy doped with Y and Ni after hydrogen absorption needs to be further studied.
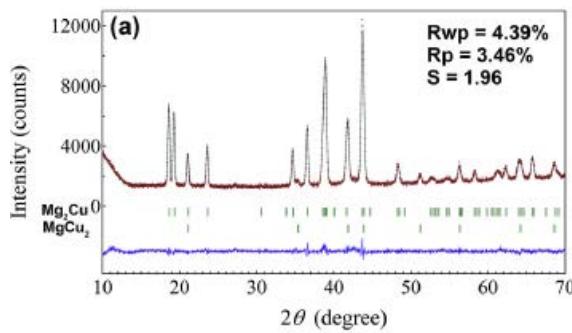
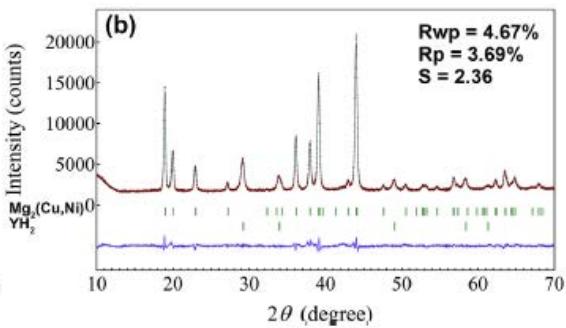 Fig. 22: XRD pattern and Rietveld refinement without hydrogen absorption, (a) undoped
$\mathrm{Mg}_2\mathrm{Cu}$, (b) $\mathrm{Mg}_2\mathrm{Cu}$ doped with Y and Ni
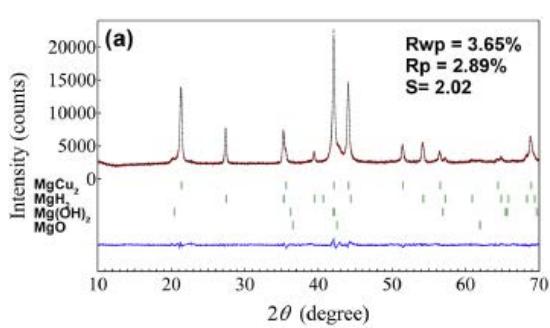
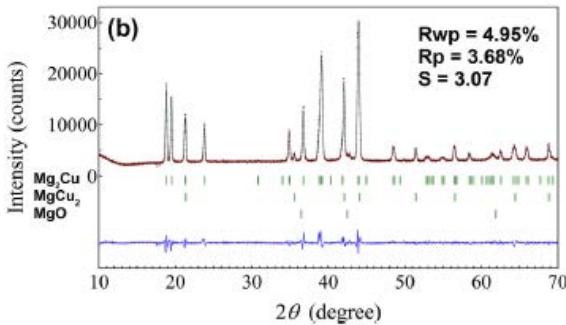 Fig. 23: XRD pattern and Rietveld refinement of undoped
$\mathrm{Mg}_2\mathrm{Cu}$ samples after hydrogen absorption and desorption, (a) hydrogenation of $300^{\circ}\mathrm{C}$ for $1\mathrm{h}$, (b) after hydrogen absorption. Dehydrogenation for $10\mathrm{h}$ at $300^{\circ}\mathrm{C}$
Table 9: XRD pattern and Rietveld refinement results without Mg-Cu hydrogen absorption and desorption
<table><tr><td rowspan="2">Sample</td><td rowspan="2">Phase%</td><td rowspan="2" colspan="4">Space groupNo.PDF Z</td><td colspan="2">(nm)</td></tr><tr><td colspan="2">a b c</td></tr><tr><td rowspan="2">Mg-Cu Alloy</td><td>Mg2Cu 3</td><td>Fddd</td><td>70</td><td>13-0504</td><td>16</td><td>0.52753</td><td>0.90665 1.8332</td></tr><tr><td>MgCu2 47</td><td>Fd-3m</td><td>227</td><td>01-1226</td><td>8</td><td>0.70429</td><td></td></tr><tr><td rowspan="4">Absorption H21hat 300°C</td><td>Mg2Cu 70</td><td>Fddd</td><td>70</td><td>13-0504</td><td>16</td><td>0.79390</td><td></td></tr><tr><td>MgH2 27</td><td>P42/mnm</td><td>136</td><td>12-0697</td><td>2</td><td>0.45116</td><td>0.30186</td></tr><tr><td>MgO 2</td><td>Fm-3m</td><td>225</td><td></td><td></td><td>0.4204</td><td></td></tr><tr><td>Mg(OH)2 1</td><td>P-3m1</td><td>164</td><td></td><td></td><td>0.2852</td><td>0.4254</td></tr><tr><td rowspan="3">desorptionH21hat 300°C</td><td>Mg2Cu 82</td><td>Fddd</td><td>70</td><td>13-0504</td><td>16</td><td>0.52672</td><td>0.90830 1.8330</td></tr><tr><td>MgCu2 13</td><td>Fd-3m</td><td>227</td><td>01-1226</td><td>8</td><td>0.70396</td><td></td></tr><tr><td>MgO 2</td><td>Fm-3m</td><td>225</td><td></td><td></td><td>0.4210</td><td></td></tr></table>
Table 10: XRD patterns and Rietveld refinement results of Mg-Cu samples doped with Y and Ni after hydrogen absorption and desorption
<table><tr><td rowspan="2">Sample</td><td rowspan="2" colspan="2">phase%</td><td rowspan="2" colspan="3">Space group No. PDF Z</td><td colspan="3">点阵参数 (nm)</td></tr><tr><td>a</td><td>b</td><td>c</td></tr><tr><td rowspan="2">Mg-Cualloy</td><td>Mg2(Cu,Ni)</td><td>92</td><td colspan="3">P6222</td><td>0.52474</td><td colspan="2">1.3605</td></tr><tr><td>YH2</td><td>8</td><td colspan="2">Fm3m225</td><td>12-0388 4</td><td>0.51980</td><td></td><td></td></tr><tr><td rowspan="7">absorption H21h at300°C</td><td>MgCu2</td><td>46</td><td colspan="2">Fd3m227</td><td>01-1226 8</td><td>0.7038</td><td></td><td></td></tr><tr><td>MgH2</td><td>23</td><td colspan="2">P42/mnm136</td><td>12-0697 2</td><td>0.4517</td><td>0.3022</td><td></td></tr><tr><td>Mg2NiH4</td><td>20</td><td colspan="2">C2/C</td><td>15</td><td>1.4986</td><td>0.6279</td><td>0.9779 113.6</td></tr><tr><td>YH3</td><td>2</td><td>P-3c1</td><td>165</td><td>12-0385 6</td><td>0.6373</td><td>0.6589</td><td></td></tr><tr><td>YH2</td><td>6</td><td>Fm-3m</td><td>225</td><td>12-0388</td><td>0.5242</td><td></td><td></td></tr><tr><td>MgO</td><td>1</td><td>Fm-3m</td><td>225</td><td></td><td>0.4143</td><td></td><td></td></tr><tr><td>Mg(OH)2</td><td>2</td><td>P-3m1</td><td>164</td><td></td><td>0.2814</td><td>0.4299</td><td></td></tr><tr><td rowspan="4">Desorption H21h at 300°C</td><td>MgCu2</td><td>74</td><td>Fd3m</td><td>227</td><td>01-1226 8</td><td>0.5273</td><td>0.9071</td><td>1.8179</td></tr><tr><td>MgNi</td><td>17</td><td>P6222</td><td>180</td><td>12-0385</td><td>0.5206</td><td>1.3166</td><td></td></tr><tr><td>YH3</td><td>1</td><td>P-3c1</td><td>165</td><td>12-0385</td><td>0.6342</td><td>0.6602</td><td></td></tr><tr><td>YH2</td><td>8</td><td>Fm-3m</td><td>225</td><td>12-0388</td><td>0.5219</td><td></td><td></td></tr></table>
iii. Study on on-line synchrotron radiation X-ray diffraction of $Mg_{90}Ni_{10}$, $Mg_{80}Ni_{10}Y_{10}$ and $Mg_{85}Cu_{5}Ni_{5}Y_{5}$ [44~46]
Fig. 24 shows the crystalline phases of $\mathrm{Mg}_{90}\mathrm{Ni}_{10},\quad \mathrm{Mg}_{80}\mathrm{Ni}_{10}\mathrm{Y}_{10}$ and $\mathrm{Mg}_{85}\mathrm{Cu}_5\mathrm{Ni}_5\mathrm{Y}_5$ samples identified by synchrotron radiation-XRD analysis after activation and hydrogenation-dehydrogenation cycle 11.5 cycles. The results are listed in table 11.
Table 11: Phases of three alloys after 11.5 cycles of activation and hydrogenation-dehydrogenation
<table><tr><td>Alloy</td><td>Mg90Ni10</td><td>Mg80Ni10Y10</td><td>Mg85Cu5Ni5Y5</td></tr><tr><td rowspan="5">Phases of the alloy after 11.5 cycles of activation and hydrogenation-dehydrogenation</td><td>MgH2</td><td>MgH2</td><td>MgH2</td></tr><tr><td>Mg</td><td>YH3</td><td>YH3</td></tr><tr><td>Mg2NiH0.3</td><td>YH2</td><td>LT-Mg2NiH4</td></tr><tr><td>LT-Mg2NiH4</td><td>MgCu2</td><td>HT-Mg2NiH4</td></tr><tr><td>HT-Mg2NiH4</td><td>Mg2NiH0.3</td><td>Mg</td></tr></table>
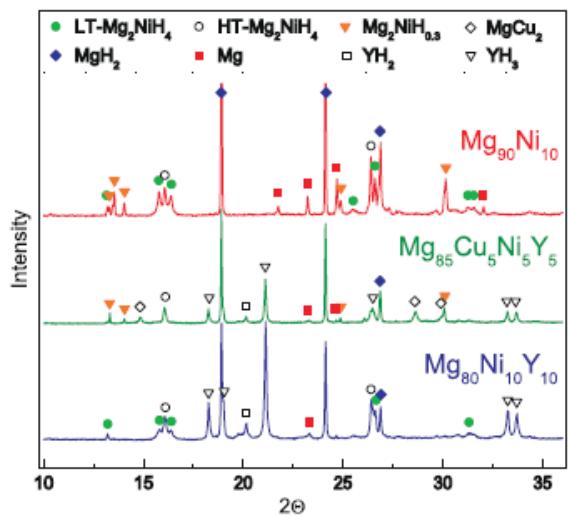 Fig. 24: Synchrotron radiation X-ray diffraction patterns of hydrogenated
$\mathrm{Mg}_{90}\mathrm{Ni}_{10}$, $\mathrm{Mg}_{80}\mathrm{Ni}_{10}\mathrm{Y}_{10}$ and $\mathrm{Mg}_{85}\mathrm{Cu}_{5}\mathrm{Ni}_{5}\mathrm{Y}_{5}$
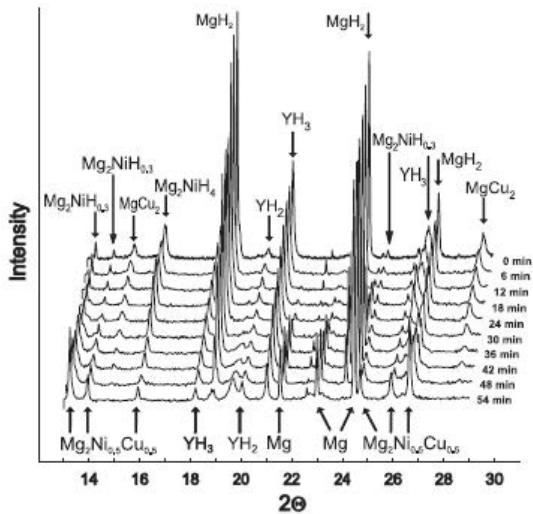 Fig. 25: Evolution of on-line synchrotron radiation XRD spectra of hydrogenated
$\mathrm{Mg}_{85}\mathrm{Cu}_5\mathrm{Ni}_5\mathrm{Y}_5$ alloy under $10^{-2}$ mbar $\mathsf{H}_2$ pressure and $200^{\circ}\mathrm{C}$ isothermal dehydrogenation
This shows that the hydrogen desorption of $\mathrm{Mg}_{90}\mathrm{Ni}_{10}$ is divided into the following three steps:
1) $\mathrm{Mg}_{2} \mathrm{NiH}_{4}$ dehydrogenation, that is, $\mathrm{Mg}_{2} \mathrm{NiH}_{4}$ dehydrogenation $\mathrm{Mg}_{2} \mathrm{NiH}_{0.3}$;
2) in the prese;
3) $\mathrm{Mg}_{2} \mathrm{NiH}_{0.3}$ dehydrogenation, that is, $\mathrm{Mg}_{2} \mathrm{NiH}_{0.3}$ dehydrogenation $\mathrm{Mg}_{2} \mathrm{Ni}$.
Fig. 25 shows the evolution of on-line synchrotron radiation XRD spectra of hydrogenated $\mathrm{Mg}_{85}\mathrm{Cu}_5\mathrm{Ni}_5\mathrm{Y}_5$ alloy under $10^{-2}$ mbarH $_2$ pressure and $200^{\circ}$ C isothermal dehydrogenation process, indicating that $\mathrm{Mg}_{85}\mathrm{Cu}_5\mathrm{Ni}_5\mathrm{Y}_5$ dehydrogenation is also divided into four steps:
1) $\mathrm{MgH}_2\rightarrow \mathrm{Mg} + \mathrm{H}_2$
2) $\mathrm{Mg}_2\mathrm{NiH}_4 \rightarrow \mathrm{Mg}_2\mathrm{NiH}_{0.3} + 1.85\mathrm{H}_2$
3) $\mathrm{Mg}_2\mathrm{NiH}_{0.3}\rightarrow \mathrm{Mg}_2\mathrm{Ni} + 0.15\mathrm{H}_2$
4) $2\mathrm{YH}_{3}\rightarrow 2\mathrm{YH}_{2} + \mathrm{H}_{2}$
Similarly, the hydrogenation of Mg-Ni alloy without Cu and Y adulteration during the hydrogen absorption and desorption cycle of 11.5 periods is also worthy of further study.
### e) Summary
From the research results of 3.1 to 3.4, it can be concluded that in the process of hydrogen absorption of Ti system, Laves phase and LaNi5 rare earth system hydrogen storage materials gradually enter the interstitial position of the alloy to form a solid solution and keep the crystal structure unchanged. Hydrogen storage is realized by this kind of hydrogenated solid solution, that is, the main body of hydrogen absorption is alloy interstitial hydrogenated solid solution. However, the situation of multi-component substituted LaNi5 alloy is more complex, and the structure of the parent phase changes. It can be seen from section 3.4 that in the process of hydrogen absorption, Mg hydrogen storage materials first decompose the alloy parent phase, and then gradually precipitate hydride, and hydrogen storage is realized by hydride, in other words, the main body of hydrogen absorption is metal hydride. However, besides $\mathrm{MgH_2}$, $\mathrm{YH_2}$ and $\mathrm{YH_3}$, the hydride of Mg-Cu alloy doped with Y and Ni and Mg-Ni alloy doped with Y and Cu is an exception, which is worthy of further study.
$\mathrm{Mg}_{2}\mathrm{Ni}$ belongs to hexagonal structure, P6222 $\mathrm{Mg}_{2}\mathrm{NiH}_{0.3}$ No.188 space group, $\mathrm{Mg}_{2}\mathrm{NiH}_{4}$ belongs to monoclinic structure, c/2c (No. 15) space group, then the hydrogenation process of $\mathrm{Mg}_{2}\mathrm{Ni}$ is $\mathrm{Mg}_{2}\mathrm{Ni} \rightarrow \mathrm{Mg}_{2}\mathrm{NiH}_{0.3} \rightarrow \mathrm{Mg}_{2}\mathrm{NiH}_{4}$. Two kinds of intermediate phases, $\mathrm{Mg}_{2}\mathrm{Ni}$ and $\mathrm{MgNi}_{2}$, are found in the $\mathrm{Mg}-\mathrm{Ni}$ binary phase diagram, and the weight percentages of Ni are about $55\%$ and $83\%$, respectively. It is suggested that it is best to configure $\mathrm{Mg}_{2}\mathrm{Ni}$ single-phase alloy samples, carry out hydrogen absorption and desorption tests, and track and determine the phase structure and lattice parameters of the parent phase and intermediate products as well as the final products after full hydrogen absorption, so as to judge whether the above results are correct and whether there is alloy hydride $\mathrm{Mg}_{2}\mathrm{NiH}_{4}$.
## IV. CRYSTAL STRUCTURE CHARACTERISTICS OF PARENT MATERIAL AND HYDRIDE OF TYPICAL HYDROGEN STORAGE ALLOY
a) Space utilization, size and number of gaps in typical dense metal lattices [47]
There are three kinds of stacking structures in metals, the crystals of Mg and Be are dense hexagonal (CPH), Cu, Ag and Au are face-centered cubic (FCC), and the third common packing type is body-centered cubic (BCC). For example K, Na and-Tiet al. The calculation results of some important structural parameters and space utilization $(\%)$ of the three kinds of dense metals are listed in Table 12.
Table 12: Some important structural parameters of three close-packed metals [47]
<table><tr><th>Crystal structure</th><th>CPH</th><th>FCC</th><th>BCC</th></tr><tr><td>The space group and No.</td><td>P63/mmc No.194</td><td>Fm-3m No.225</td><td>Im-3m No.229</td></tr><tr><td>Metal example</td><td>Be, Mg, α-Ti, Y</td><td>Ni, Cu, Al</td><td>β-Ti, K, Na</td></tr><tr><td>Atomic stacking space utilization /%</td><td>74.05</td><td>74.05</td><td>68.02</td></tr><tr><td>Coordination number</td><td>12</td><td>12</td><td>8</td></tr><tr><td>The number of atoms in a unit cell</td><td>2</td><td>4</td><td>2</td></tr><tr><td>Atomic coordinates</td><td>1a0001d 2/3,1/3,1/2</td><td>4a000;1/2,1/2,0;1/2,0,1/2;0,1/2,1/2</td><td>2a000;1/2,1/2,1/2</td></tr><tr><td>The relationship between unit cell parameters and atomic radius R</td><td>a=b=2Rc=4/3√6R</td><td>a=2√2R</td><td>a=4/√3R</td></tr><tr><td>The number of tetrahedral gaps.Can accommodate the maximum atomic radius</td><td>80.225R</td><td>40.225R</td><td>80.291R</td></tr><tr><td>The number of octahedral gapsCan accommodate the maximum atomic radius</td><td>40.414R</td><td>20.414R</td><td>60.154R</td></tr></table>
### b) Characteristics of parent structure and hydride structure of TiFe
The most studied Ti alloy is TiFe, which belongs to CsCl structure. Some people think that the hydrogenation behavior of TiFe alloy goes through the process from TiFe (cubic crystal) to $\mathrm{TiFeH}_{1.04}$ (tetragonal intermediate hydride phase) and then to $\mathrm{TiFeH}_{1.95}$ (cubic crystal, saturated hydride phase).
Enter the keyword "hydride of TiFe hydrogen storage alloy" on the network, and it is also found that there are $\mathrm{TiFeH}_{1.04}$ and $\mathrm{TiFeH}_{1.95}$ statements. What is the credibility of these data? First of all, the hydrides of TiFe with CsCl structure in the process of hydrogen absorption and desorption are $\mathrm{TiFeH}_{1.04}$ and $\mathrm{TiFeH}_{1.95}$, but there is a lack of experimental evidence, and the card of this compound can not be found in PCPDF win database. However, Wajid, Ali et al. [6] retained the ordered BCC structure after hydrogen absorption by Cu and Y-substituted Ti-Fe-Mn alloys. It can be seen from Table 12 that there are 8 tetrahedral gaps and 6 octahedral gaps in the unit cell of BCC structure, The gap dimensions are 0.291R and 0.154R, respectively. The atomic radius of Ti is 0.145 nm, $0.145 \times 0.291 = 0.0423\mathrm{nm}$. Because the atomic radius of Fe is smaller than that of Ti, only 0.135nm, and the actual gap radius is larger than 0.0423nm, the tetrahedral gap can accommodate H atoms with radius 0.045nm.
### c) Crystal structure and interstitial position of Laves phase hydrogen storage alloy
Type C15 is typical of $\mathrm{MgZn_2}$ with cubic structure, the stacking order of atomic plane is ABCABC, space group Fd3m; C14 is typical of $\mathrm{MgCu_2}$ with hexagonal structure, the stacking order of atomic surface is ABABAB and space group is P6/mmc, and type C36 is typical of $\mathrm{MgNi_2}$ with hexagonal structure, stacking order of atomic plane is ABACABAC and space group is P6/mmc. The crystal structure parameters and interstitial positions of three Laves phase hydrogen storage alloys are given in Table 13.
Table 13: Crystal structure parameters and interstitial holes in three ${\mathrm{AB}}_{2}$ Laves phase hydrogen storage alloys [29]
<table><tr><td>Performance</td><td>Cubic Lavesphase (C15)</td><td>Hexagonal Laves phase (C14)</td><td>Hexagonal Lavesphase (C36)</td></tr><tr><td>Structure type</td><td>MgCu type</td><td>MgZn2type</td><td>MgNi2</td></tr><tr><td>Spacegroup</td><td>Fd3m No.227</td><td>P63/mmc (No.194)</td><td>P63/mmc 194</td></tr><tr><td>The number of AB2 in a unit cell</td><td>8</td><td>4</td><td>8</td></tr><tr><td>Ideal stacking condition</td><td>RA=√3a/8RB=√2a/8dAB=√11a/8</td><td colspan="2">c=(2√2a)/√3RA=9√6a/8 RB=a/4dAB=(√22a)/8</td></tr><tr><td>Equivalent position</td><td>(000);(01/21/2); (1/201/2); (1/21/20)+ A 8a 1/8,1/8,1/8; 7/83/83/8 B 16d 1/2,1/2,1/2; 1/43/40; 3/401/4; 01/43/4</td><td>A 4f 1/3,2/3,z; z=1/16 B1 2a 0,0,0; 0,0,1/2 B2 6h z,2x,1/4;</td><td>A1 4e 0 0 z1 A2 4f 1/3 2/3 z2 B1 6g 1/2 0 0 B2 6h x 2x 1/4 B3 6f 1/3 2/3 1/8</td></tr><tr><td rowspan="2">Number of tetrahedral holes in B4 position</td><td>8</td><td colspan="2">4</td></tr><tr><td>8b</td><td colspan="2">4c</td></tr><tr><td>Radius(nm)</td><td>Rs=0.0039780a</td><td colspan="2">0,0,z; 0,0,z+1/2; 0,0,-z; 0,0,-z+1/2 z=5/16 Rs=0.0056186a</td></tr><tr><td rowspan="2">AB3 tetrahedral hole Number Position</td><td>32</td><td colspan="2">I-type</td></tr><tr><td>32e x,x,x x=0.84891</td><td colspan="2">4</td></tr><tr><td>Number Position Radius(nm)</td><td>Rs=0.004866a</td><td colspan="2">12k x,2x,z x=0.1292, z=0.1390 Rs=0.00688a</td></tr><tr><td rowspan="2">Number of A2B2 tetrahedral holes position</td><td>96</td><td colspan="2">Total48</td></tr><tr><td rowspan="2">96g x,x,z x=0.19029 z=-0.005579</td><td rowspan="2" colspan="2">6h16 x,2x,1/2 x=0.4639 6h26 x,2x,1/2 x=0.2027 12k12 x,2x,z x=0.4565, z=0.6306 24/24 x,y,z x=0.04353, y=0.3259, z=0.5653 All A2B2 holes have the same radius Rs=0.0074475a</td></tr><tr><td>Radius (nm)</td></tr><tr><td>The total number of tetrahedral holes</td><td>There are 17 holes in each AB2 unit, and there are 8 AB2 molecules in the unit cell, so there are a total of 136 holes.</td><td colspan="2">There are 17 holes in each AB2 unit, and there are 4 molecules in the unit cell, so there are a total of 68 holes.</td></tr></table>
The schematic diagram of the phase structure of cubic and hexagonal Laves is shown in figure 26. According to the hard sphere packing model, the ideal atomic radius ratio (rA/rB) of Laves phase is1.225. However, in many binary or quasi-binary Laves phase alloys, the atomic radius ratio of rA and rB deviates from 1.225, and the radius ratio can vary in the range of 1.05 ~ 1.68. In addition to the atomic size, the phase structure of Laves also depends on the electron density. The statistical results show that the electron concentration (valence electron/atom) of Laves phase structure is 2.0 for C14 type, 1.7 for C15 type and 1.90 for C36 type.
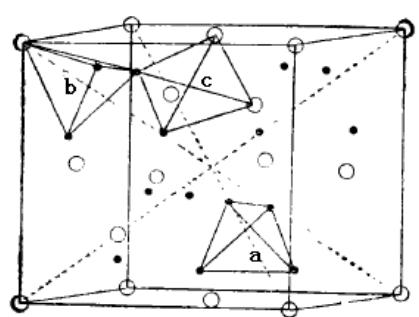
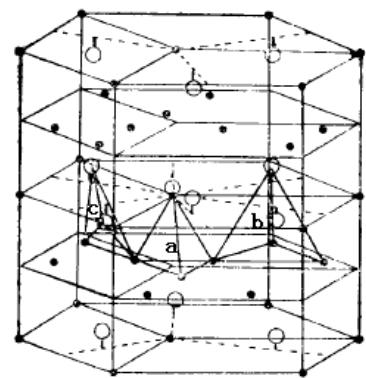 Fig. 26: Schematic diagram of Laves phase structure of cubic and hexagonal structure and three types of gaps in crystal cell
O is A atom ● is B atom, a is B4 closed gap, b is AB3 gap, c is AB2 gap.
All the cell gaps of Laves phase alloys are tetrahedral gaps. There are three types of tetrahedral gaps, namely, AB2, AB3 and B4 (see figure 26). The total number of tetrahedral gaps per unit cell is 17, in which A2B2 is 12, AB3 is 4, B4 is 1. When the Laves phase alloy absorbs hydrogen, the hydrogen occupies the tetrahedral gap, which makes the cell volume expand, but the crystal form does not change. In the hydrogenated solid solution of Laves phase alloy, not all tetrahedral gaps are occupied by hydrogen atoms, but some of the gaps can be occupied by hydrogen atoms, which is mainly due to electrostatic restrictions.
d) Characteristics of parent structure and hydride structure of LaNi<sub>5</sub> alloy [48,51] i. The research results of Magee and Liu on LaNi $^5$ phase hydrogen storage alloy [48]
$\mathrm{LaNi}_5$ crystal belongs to $\mathrm{CaCu}_5$ type structure and belongs to hexagonal system with space group
P6/mmm (No.191). Its crystal structure model is shown in Fig. 27. As early as 1981, Magee and Liu [48] published the research results on the number, size, location and symmetry of tetrahedral interstitial holes in four families of intermetallic compounds under the topic of "the relationship between the structure of intermetallic compounds and hydride formation". Table 14 shows the LaNi $_5$ gap position and related parameters.
Table 14: Interstitial holes in the structure of \mathrm{AB}_5 intermetallic compounds [58]
<table><tr><td>AB5intermetallic compound</td><td>Ideal stacking condition</td><td>Equivalent position</td><td>Number of tetrahedral holes in B4</td><td>AB3tetrahedral hole</td><td>A2B2tetrahedral hole</td><td>The total number of AB5hedron holes</td></tr><tr><td>CaCu5type P6/mmm No.191</td><td>c=(\sqrt{2}/\sqrt{3})aR_B=a/4R_A=(1/\sqrt{3})a-a/4</td><td>A 1a0 0 0B1 2c1/3,2/3,0;2/3,1/3 0B2 3g1/2,0,1/2;0,1/2,1/2;1/2,1/2,1/2</td><td>4h 41/3,2/3,z;2/3,1/3.z;2/3,1/3,-z;1/3,2/3,-zz=5/8Rs=0.05619a</td><td>I-type12o 12x,2x,zx=0.1949;z=0.2712Rs=0.07636aII-type12n12x,0,zx=0.3896,z=1/6Rs=0.07546a</td><td>6m 6x,2x,1/2x=0.0971Rs=0.1142a</td><td>There are 34 holes per AB5 unit.</td></tr></table>
## ii. LaNi5H x < 6.0interstitial hole
After $\mathrm{LaNi}_5$ hydrogen absorption, the crystal system and space group remain unchanged, the crystal cell expands, and the lattice constant changes greatly. The voids in the lattice can be composed of the same metal atoms or a mixture of different metal atoms, so there are many types, the most important of which are tetrahedral voids and octahedral voids. In a LaNi $_5$ cell, there are 37 voids of five types, namely, 6 voids of 6m type, 12 voids of 12n type, 12 voids of 12o type, 4 voids of 4h type and 3 voids of 3f type. Fig. 28 shows a three-dimensional diagram of the five voids in the LaNi5
cell. Figure 29 shows the interstitial positions in the five-site model of the hydride phase.
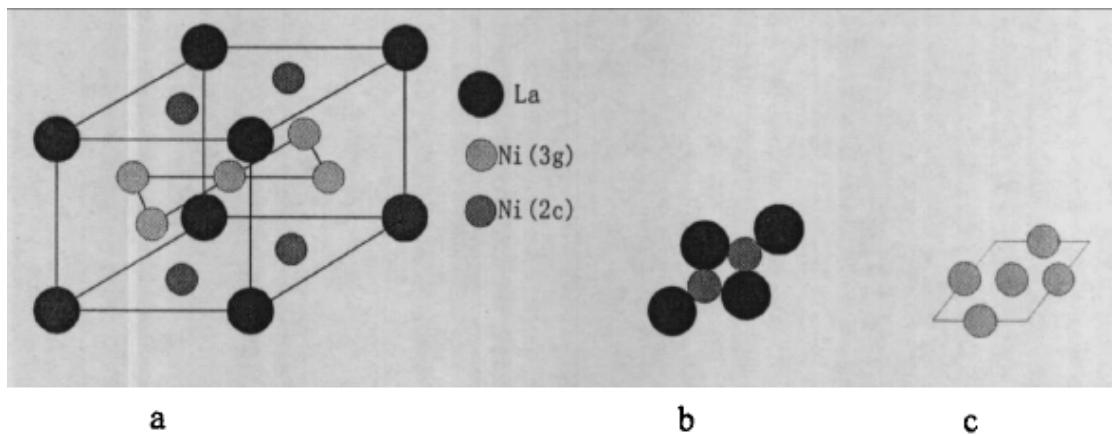 Fig. 27: A schematic diagram of the crystal structure of
$\mathrm{LaNi}_5$ alloy
a) LaNi5 structure model; b) the arrangement of atoms on the bottom surface; c) the arrangement of atoms on the c-axis of 1pm
LaNi$_5$
<table><tr><td></td><td>a/nm</td><td>b/nm</td><td>c/nm</td><td>V/nm3(each cell)</td><td>ΔV/nm3(each H atom)</td><td></td></tr><tr><td>LaNi5</td><td>0.5014</td><td></td><td>0.3892</td><td>84.7×10-3</td><td></td><td></td></tr><tr><td>LaNi5H6.5</td><td>0.5399</td><td></td><td>0.4290</td><td>108.30×10-3</td><td>2.36×10-3</td><td>27.86%</td></tr></table>
Cao and Chen et al. [49] think that there are mainly four kinds of interstitial positions: tetrahedron, hexahedron, octahedron and dodecahedron. The important parameters are shown in Table 16, and the interstitial positions in the five positions of hydride phase are also listed in Table 16 (see figure 29).
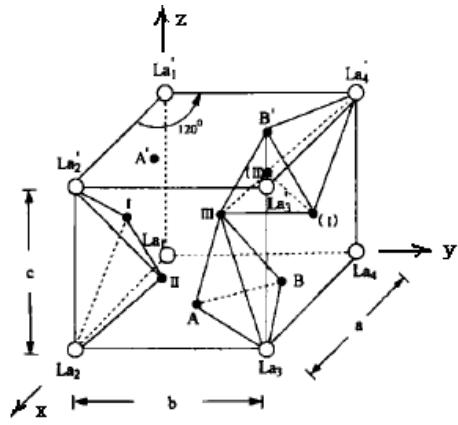
Fig. 28: Stereoscopic diagram of five gap positions of LaNi5 species
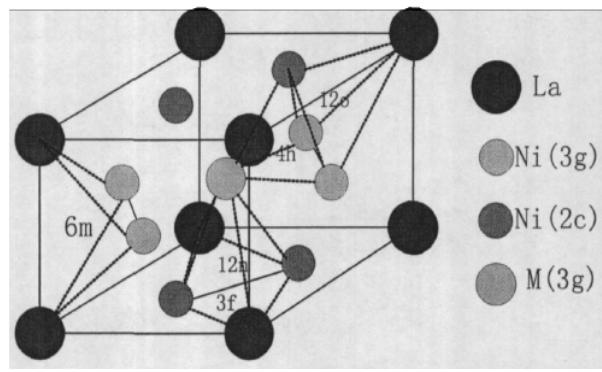 Fig. 29: The interstitial position in the five-site model of hydride phase Table 16: Gap position in LaNi
${}_{5}$ structure [51]
<table><tr><td rowspan="2">Gap location name</td><td rowspan="2">Gap space radius (nm)</td><td rowspan="2">Number</td><td colspan="3">Five-sites model of β-hydride</td></tr><tr><td>Gap position</td><td>Gap structure</td><td>Gap space radius</td></tr><tr><td>Tetrahedron</td><td>0.043</td><td>36</td><td>12o</td><td>AB3</td><td>0.5548</td></tr><tr><td>Hexahedron</td><td>0.068</td><td>6</td><td>12n</td><td>AB3</td><td>0.4482</td></tr><tr><td>Octahedron</td><td>0.106</td><td>9</td><td>6m</td><td>A2B</td><td>0.4333</td></tr><tr><td>Dodecahedron</td><td>0.146</td><td>3</td><td>4h</td><td>B4</td><td>0.3927</td></tr><tr><td></td><td></td><td></td><td>3f</td><td>A2B4</td><td>0.3126</td></tr></table>
Wang Hong and Liu Zuyan [51] in the paper "crystallographic Analysis of the maximum hydrogen Storage capacity of $\mathrm{LaNi}_5$," according to the atomic radius of hydrogen is 0.045nm (or 0.078nm), theoretically, a $\mathrm{LaNi}_5$ cell can hold 18 hydrogen atoms, and one La atom and 5 Ni atoms in one cell, the mass fraction of maximum hydrogen storage can be calculated. This is basically consistent with the measured hydrogen storage mass fraction of 1.35-1.38% [50-51]
### e) Crystal structure and microstructure of $\mathrm{LaNi}_5$ type hydrogen storage materials for hydrogen absorption and desorption
There are mainly three viewpoints in the literature, namely: phase two-phase model and phase five-bit model.
## i. $\beta$ Phase two-positions model
Bowmna et al. [52] believe that during the hydrogen charging process, the spatial symmetry of the compound changes from P6/mmm (No.191) to P3lm (No.162), and the 3c $(z = 1)$ position is completely occupied by hydrogen, and hydrogen occupies part of the 6d position $(z = 0.5)$. However, in the P31m (No.162) space group, although La occupies 1a (000) site, Ni (1) occupies 2c (1/2, 2/3, 0), and Ni (2) occupies 3G (1/2,0,1/2) (1/2,0,1/2), there are no 3c and 6d bits. Therefore, it is worth discussing.
Yartis et al. [53] think that hydrogen occupies the positions of $6g1(x, y, z = 0.1)$ and $6g2(x, y, z = 0.5)$, so there are 6 subordinate gaps of $6g$, 12n-type12voids, 12 12o-type 12 voids, 4h-type4 voids and 3f-type 3 voids in the space group. Figure 28 shows a three-dimensional diagram of the five voids in the LaNi5 cell. Figure 29 shows the interstitial position in the five-site model of the hydride phase. In the transition from P6/mmm (No.191) to P321 (No.150), La atom occupies 1a (000) position and Ni (1) occupies 2d(1/3, 2/3, $z = 0$ ) in P321 space group. Ni (2) occupies 3f ( $x = 1/2$, 0, 1/2) position.
## ii. $\beta$ Phase five-positions model
Perchron-Guigan [54] et al used different space groups to calculate the crystal structure of hydride. After comparing the results, it was found that the space group of the compound did not change before and after desorption and it was still P6/mmm. Based on this, they proposed a five-bit model, that is, hydrogen atoms occupy at 3f, 4h (z=0.5), 6m, 12n and 12o sites, respectively.
The studies of Latroche [55] and Chartouni et al. [56] have confirmed that for some alloys with specific composition, there is another hydride phase $\mathsf{AB}_5\mathsf{H}_{x = 3}$ in the platform stage, which also belongs to hexagonal system, but the formation mechanism is not clear and the crystal structure is questionable. However, The existence of this phase can greatly reduce the discontinuous lattice expansion from $\alpha$ phase to $\beta$ phase.
For $\gamma$ phase hydride ( $LaNi_{5}D_{x=6.0-7.0}$ ), the consistent view is that the order of the compound changes in the super lattice in the c-axis direction. The hydrogen absorption positions in P6/mmm are 4h (1/3,2/3,z=0.37), 6m(1/3,2/3,1/2), 2o(x,2x,z=0.35), and 12n (0.46,0,z=0.2) in P63mc (No.186), 2b(l/3,2/3, =0.8), 6cl(x,2x,z=1/4), 6c2(x,2x, z=0.3) as well as 12d(x,0,z=0.06)0.06 in the No.186 space group, respectively. No La occupies 1a (000) and Ni (1) occupies 2c(1/3,2/3,0) and Ni (2) occupies 3g (1/2,0,1/2). Therefore, the latter statement is worthy of negotiation.
### f) Parent structure and hydride structure of Mg-based hydrogen storage alloy
The parent phases of $\mathrm{Mg_{88}Y_{12}}$ are $\mathrm{Mg_{24}Y_5}$ and Mg, and the hydrides are $\mathrm{MgH_2}$, $\mathrm{YH_2}$ and $\mathrm{YH_3}$, which are obviously formed by the decomposition of $\mathrm{Mg_{24}Y_5}$. The parent phases of $\mathrm{Mg_2Cu}$ without Y and Ni are $\mathrm{Mg_2Cu}$ and $\mathrm{MgCu_2}$, the products after hydrogen absorption are $\mathrm{MgCu_2}$ and $\mathrm{MgH_2}$, and only $\mathrm{MgH_2}$ is hydride, indicating that $\mathrm{Mg_2Cu}$ is decomposed into $\mathrm{MgCu_2}$ and Mg, Mg to form hydrides with H, while the parent phases of alloys doped with Y and Ni are $\mathrm{Mg_2}$ (Cu, Ni) and YH, and the hydrides formed after hydrogen absorption are $\mathrm{MgH_2}$, $\mathrm{Mg_2NiH_4}$, $\mathrm{YH_3}$ and $\mathrm{YH_2}$, indicating that $\mathrm{Mg_2(Cu,Ni)}$ has been decomposed.
### g) Microstructure study on the process of hydrogen absorption and desorption
Except for the microstructure (lattice parameters, micro-strain) mentioned in the charge and discharge process of Ni-MH battery, few of the above discussions do not involve the mother in the process of hydrogen absorption and desorption.
Phase harmony and microstructure of hydride. In fact, in the process of hydrogen absorption and desorption, whether it is the formation of alloy interstitial solid solution or the formation of hydride phase, the microstructure of the phase involved (grain refinement, micro-stress, lattice parameters and defects) may change with the process of hydrogen absorption and desorption. There are few reports except for some studies carried out by Professor Lu Guanglie's research group of Zhejiang University[37,38]. The changes of microstructure parameters (strain) of $\mathrm{LaNi}_{3.75}\mathrm{Co}_{0.75}\mathrm{Mn}_{0.3}\mathrm{Al}_{0.2}$ alloy in each stage of hydrogen absorption and desorption process are described below.
Fig. 30 shows the lattice strain of $\alpha$ phase (a) and $\beta$ phase (b) along (001) and (110) crystal plane direction of $\mathrm{LaNi}_{3.75}\mathrm{Co}_{0.75}\mathrm{Mn}_{0.3}\mathrm{A}1_{0.2}$ alloy during hydrogen charging and desorption, respectively. A considerable number of lattice defects will be formed in the hydride phase in the hydrogen charging stage, mainly dislocations. These dislocations form small-angle grain boundaries, which are equivalent to grain refinement. In the hydrogen desorption stage, due to the gradual decrease of hydrogen content in the hydride phase, the direction of lattice elastic distortion is opposite to that of hydrogen charging, so dislocation reaction and dislocation aggregation occur, and the total number of dislocations decreases gradually. the small grains blocked by small angle grain boundaries re-aggregate into large grains.
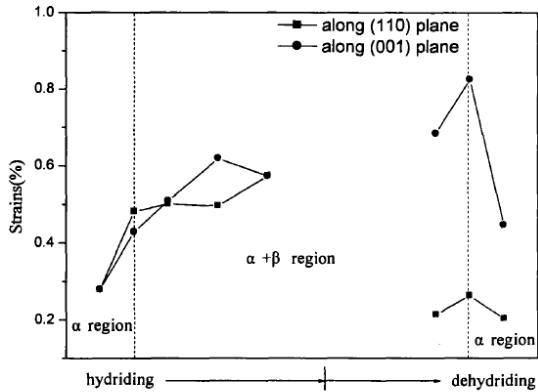
(a)
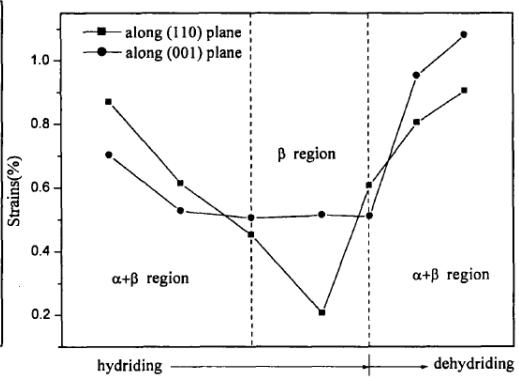
(b) Fig. 30: During each stage of hydrogen absorption and desorption process, each phase of $\mathrm{LaNi}_{3.75}\mathrm{Co}_{0.75}\mathrm{Mn}_{0.3}\mathrm{Al}_{0.2}$ alloy follows (001). Lattice strain in the direction of the crystal (100) and (110) plane [37,38]. (a) $\alpha$ phase; (b) $\beta$ phase.
## V. DYNAMIC MECHANISM OF HYDROGEN ABSORPTION AND DESORPTION OF ALLOY HYDROGEN STORAGE MATERIALS
Based on the comprehensive analysis of the contents described in Section 2-4, this section discusses the mechanisms of hydrogen absorption, hydrogen desorption and hydrogen storage of hydrogen storage materials. Because the alloy hydrogen storage material is crystalline, its hydrogen absorption and desorption process and hydrogen storage capacity are closely related to the crystal structure change and stability of the crystalline hydrogen storage material. Let's discuss the kinetic mechanism of hydrogen storage.
### a) Surface reaction-adsorption and desorption [3P 57] and H diffusion in hydrogen storage materials
Hydrogen molecules and dissociated hydrogen atoms will react with the surface of hydrogen storage materials, including physical adsorption, chemical adsorption, and then permeate to the surface of the materials. In addition, there is also desorption phenomenon. The adsorption and desorption are related to the hydrogen pressure and temperature when absorbing hydrogen, and to the kinds of hydrogen absorbing materials.
At the initial stage, the hydrogen atoms that reach the surface of the material spread inward through various paths. Generally speaking, there is diffusion along the grain boundary and within the grain. From the introduction to Section 4.
The space utilization of different dense stack structures is different, the number of gap positions and the size of gap space are different, which seriously affects the intragranular diffusion of H in hydrogen storage alloys. In addition, the number and distribution of crystal defects in hydrogen storage materials will also affect the intragranular diffusion of H in hydrogen storage alloys. If the grains are fine, there are many grain boundaries, and the diffusion rate is relatively fast, so the nanocrystalline materials have better diffusion properties.
If the surface concentration is constant, the function of the weight change caused by the diffusion of hydrogen to the spherical particles with radius $a$ is as follows:
$$
\frac {M _ {t}}{M _ {\infty}} = 1 - \frac {6}{\pi^ {2}} \sum_ {n = 1} ^ {\infty} \frac {1}{n ^ {2}} \exp \left(\frac {D n ^ {2} \pi^ {2} t}{a ^ {2}}\right) \tag {16}
$$
In the formula, $M_{t}$ is the amount of hydrogen entering the sphere in time $t$; $M_{\infty}$ is the amount of hydrogen after an infinitely long time; and $D$ is the diffusion coefficient. The formula is suitable for the case of equal hydrogen pressure.
### b) Hydrogen storage mechanism of alloy hydrogen storage materials
## i. General description
It is generally believed that metal or alloy (represented by M) reacts with hydrogen to form metal (alloy) hydride (MHn). The reaction equation is as follows:
$$
\mathbf {M} + \mathbf {n H} = \mathbf {M H} _ {\mathrm {n}} + \triangle \mathbf {H}
$$
$\triangle H$ is heat of formation.
The reaction is a reversible process. In the forward reaction, the metal material absorbs hydrogen and gives off heat; in the reverse reaction, the metal hydride releases hydrogen and absorbs heat. In this way, the reaction can be repeated in the positive or reverse direction only by changing the temperature and pressure. To achieve the purpose of hydrogen storage or release of metal (alloy).
The energy change of hydrogen storage process can be divided into three parts: 1) Hydrogen dissociates from gaseous molecules to atomic state requires energy $\triangle H_{1}$, that is, hydrogen dissociation energy $-4.75\mathrm{eV}$; 2) after hydrogen enters the metal crystal, it interacts with the metal, that is, the energy change $\triangle H_{2}$ produced by bonding.
$$
H_{2} \rightarrow 2H \quad (\Delta H_{1} = -4.75\mathrm{eV})
$$
$$
6.5H + M \rightarrow MH_{6.5} \quad (\Delta H_{2})
$$
So there is
$$
\frac {6 . 5}{2} \mathrm {H} _ {2} + \mathrm {M} \rightarrow \mathrm {M H} _ {6. 5} (\triangle \mathrm {H} = \triangle \mathrm {H} _ {1} + \triangle \mathrm {H} _ {2})
$$
The step of $\mathsf{H}_2\rightarrow 2\mathsf{H}$ can be considered to be the same for any hydrogen storage material at the same temperature and hydrogen pressure. The problem is that the $6.5\mathsf{H} + \mathsf{M}\rightarrow \mathsf{MH}_{6.5}$ step, due to the wide variety of M, varies greatly for different alloy hydrogen storage materials, and may even be divided into many different small steps. What is M? What is $\mathsf{MH}_{6.5}$? All of them need to be tested and studied.
ii. The interstitial position of hydrogen atom entering the parent phase-the formation of hydrogenated solid solution From the discussion of the number, size and position of interstitial holes in the parent phase structure of TiFe alloy, $\mathrm{LaNi}_5$ and Laves phase, when the interstitial hole radius is greater than or equal to the radius of hydrogen atom, the interstitial position of hydrogen atom entering the main lattice of alloy hydrogen storage material changes from less to more, until saturated, but the crystal structure of the main body of alloy hydrogen storage material remains unchanged, but its microstructure and fine structure will change. This is the formation process of hydrogenated solid solution.
In this way, it is obviously inappropriate to regard LaNi5H6.5 as an alloy hydride, but a hydrogenated solid solution, and it is more scientific and reasonable to write the general formula as $\mathrm{LaNi}_{5}-\mathrm{Hn}$.
The value of $n$ is different in different stages of hydrogen absorption. As we know from Section4.2, the maximum theory of $n$ can reach 18. Hydrogen evolution is a reversible process, that is, the hydrogenated solid solution decomposes step by step and releases hydrogen.
iii. Decomposition of parent phase and precipitation and formation of hydride in hydrogen storage materials
There are also a variety of alloy hydrogen storage materials, and their crystal structure, composition and composition are different. From the introduction of sections 2 and 3, it can be seen that the alloy hydrogen storage materials may be single-phase or multiphase, and their crystal structures will be different. For example, $\mathrm{Mg}_{88}\mathrm{Y}_{12}$ is composed of $\mathrm{Mg}_{24}\mathrm{Y}_5$ with $\alpha$ -Mn structure, space group I43m,a=1.1240nm and hexagonal Mg. The structural evolution of Mg series hydrogen storage materials during hydrogen absorption and desorption is introduced from sections 3.4 and 4.4. The results of XRD analysis show that $\mathrm{Mg}_{88}\mathrm{Y}_{12}$ alloy is first hydrogenated (activated) at $380^{\circ}\mathrm{C} \sim 3\mathrm{MPa}$ pressure, and the hydrogen absorption capacity increases relatively fast in the first 5 minutes, and then increases slowly. The maximum hydrogenation capacity of $6.479\%$ was reached after about 550 minutes. Fig. 21 (b) shows the XRD pattern of $\mathrm{Mg}_{88}\mathrm{Y}_{12}$ alloy at different hydrogenation stages. After about $15\%$ of the saturated hydrogen absorption capacity, the diffraction peak of $\mathrm{Mg}_{24}\mathrm{Y}_5$ phase almost disappears, while the diffraction peak of $\mathrm{YH}_2$ appears, and the diffraction peak of Mg is high. During further hydrogenation, the $\mathrm{MgH}_2$ diffraction peak appears with the decrease of Mg peak and increases slowly. When the saturated $70\%$ $\mathrm{YH}_3$ has a small weak peak, it indicates that a small amount of $\mathrm{YH}_2$ is transformed into $\mathrm{YH}_3$. All hydrogenated alloys contain the formation of $\mathrm{MgH}_2$, $\mathrm{YH}_2$ and $\mathrm{YH}_3$ phases. Now write: $45\%$ hydrogen absorption
$$
M g _ {8 8} Y _ {1 2} \left(M g _ {2 4} Y _ {5} + M g\right)\rightarrow M g + Y H _ {2} + Y H _ {3}
$$
It is obvious that the parent phase $\mathrm{Mg}_{24}\mathrm{Y}_5$ of hydrogen storage materials disappears, and hydrogen storage phases $\mathrm{YH}_2$ and $\mathrm{YH}_3$ are precipitated, but Mg phase still exists. And after $100\%$ hydrogen absorption,
$$
Mg_{88}Y_{12}(Mg_{24}Y_5+Mg)\rightarrow MgH_2+YH_2+YH_3
$$
All the parent phase disappears and the hydrogen absorption phase is all formed, so the hydrogen absorption of hydrogen storage materials is accompanied by the decomposition of the parent phase and the precipitation/formation of the hydride phase, which includes the nucleation and growth of the new phase. The hydrogen evolution process is the gradual decomposition of the hydride hydrogen storage phase and the release of hydrogen. This obviously shows that the hydride of alloy $\mathrm{Mg_{88}Y_{12}}$ can not be written as $\mathrm{Mg_{88}Y_{12}H_n}$, because Mg88Y12 alloy includes two phases of $\mathrm{Mg_{24}Y_5 + Mg}$ and the hydride can not be written as $(\mathrm{Mg_{24}Y_5 + Mg})\mathrm{H_n}$ or $(\mathrm{Mg_{24}Y_5H_n + MgH_n})$, but there is a process, namely $\mathrm{Mg_{24}Y_5 + Mg \rightarrow YH_2 + MgH_2 \rightarrow MgH_2 + YH_2 + YH_3}$.
Similarly, for the Mg-Cu system
Parent phase%Main phase after The main phase after hydrogen absorption%hydrogen desorption%
<table><tr><td>Mg2Cu</td><td>83</td><td>MgCu276</td><td>Mg2Cu</td><td>82</td></tr><tr><td>MgCu2</td><td>17</td><td>MgH227</td><td>MgCu216</td><td></td></tr></table>
It can be seen that the parent phase $\mathrm{Mg_2Cu}$ is decomposed and $\mathrm{MgH_2}$ is formed. As for the $\mathrm{MgCu2}$ in the parent phase, which is the Laves phase with Fd3m structure, whether the hydrogenated solid solution $\mathrm{MgCu_2 - H_n}$ is formed in the process of hydrogen absorption and desorption remains to be further studied. The method is to configure the sample of single-phase $\mathrm{MgCu_2}$, carry out the hydrogen absorption and desorption test, and at the same time track the process of hydrogen absorption and desorption to determine the crystal structure of the parent phase, the intermediate phase and the final phase and accurately determine the lattice parameters.
For Mg-Cu alloy doped with Y and Ni and Mg-Ni alloy doped with Y and Cu, except for $\mathrm{MgH}_2$, $\mathrm{YH}_2$ and $\mathrm{YH}_3$, $\mathrm{Mg}_2\mathrm{NiH}_4$ alloy hydride appears to be an exception.
$\mathrm{Mg}_{2}\mathrm{Ni}$ belongs to hexagonal structure, P6222 $\mathrm{Mg}_{2}\mathrm{NiH}_{0.3}$ No. 188 space group, $\mathrm{Mg}_{2}\mathrm{NiH}_{4}$ belongs to monoclinic structure, c2/c (No.15) space group, then the hydrogenation process of $\mathrm{Mg}_{2}\mathrm{Ni}$ is $\mathrm{Mg}_{2}\mathrm{Ni} \rightarrow \mathrm{Mg}_{2}\mathrm{NiH}_{0.3} \rightarrow \mathrm{Mg}_{2}\mathrm{NiH}_{4}$. Two kinds of intermediate phases, $\mathrm{Mg}_{2}\mathrm{Ni}$ and $\mathrm{MgNi}_{2}$, are found in the Mg-Ni binary phase diagram, and the weight percentages of Ni are about $55\%$ and $83\%$, respectively. It is suggested that it is best to configure $\mathrm{Mg}_{2}\mathrm{Ni}$ single-phase alloy samples, carry out hydrogen absorption and desorption tests, and track and determine the phase structure and lattice parameters of the parent phase and intermediate products as well as the final products after full hydrogen absorption, so as to judge whether the above results are correct and whether there is alloy hydride $\mathrm{Mg}_2\mathrm{NiH}_4$.
## VI. COMPREHENSIVE ANALYSIS AND CONCLUSIONS AND PROSPECTS [59]
### a) Comprehensive analysis
According to the introduction of section 2 to section 34.5 of this article, a comprehensive analysis of the related problems is as follows.
## i. Thermo-dynamic analysis of the mechanism of hydrogen absorption and desorption
Zhang Xiulan, Huang Zhuan, Chen Bo et al. [58] have made a thermodynamic analysis of the hydrogen storage process of $\mathrm{LiNi}_5$. According to the thermodynamic function in the equilibrium state, the ability to finish is derived. The equilibrium formula of P-C-T relation in the whole experimental range is described. The variation curves of equilibrium pressure and hydrogen storage capacity at different temperatures are fitted and analyzed by using P-C-T equilibrium formula, and the thermodynamic function of equilibrium reaction in hydrogen storage process is calculated and discussed. The following is only a qualitative discussion.
Considering the crystal structure characteristics of alloy hydrogen storage materials, it can be divided into two types: 1) The crystal structure is dense or close to ideal dense stacking, and it is easy to form Hydride compound with H. For example, pure Mg is closest to ideal dense stack (c/a=1.633); 2) The second kind is that the utilization of atoms in lattice space is low, there are many interstitial positions, and the radius of interstitial space is larger than radius of H atom, so it is easy to form hydrogenated solid solution.
From the point of view of the real hydrogen storage body of alloy hydrogen storage materials, it can also be divided into two categories:
1) one is hydride, in other words, the hydrogen absorption process is the parent phase decomposition and subsequent formation of hydride; and hydrogen desorption is the decomposition process of hydride;
2) The process of hydrogen absorption is the diffusion of H atom into the interstitial hole in the crystal of hydrogen storage material, and the dilute solid solution containing hydrogen is gradually formed. until the saturated/ supersaturated solid solution is formed, hydrogen desorption is the decomposition of hydrogenated solid solution and hydrogen release.
Compared with hydrogenated solid solution, the main body of hydrogen storage belongs to hydride, which is very different in the diffusion mechanism and the formation process of hydrogen storage body. For former, hydrogen atom mainly diffuses along the grain boundary, and the decomposition of the parent phase and the formation of the new phase first occur at the grain boundary, and then expand into the grain, while for latter, hydrogen atom mainly diffuses into the interstitial position of the parent phase of the hydrogen storage material, and the formation of hydrogenated solid solution also begins inside the grain.
The formation processes of the two types of hydrogen storage bodies are different, and their thermodynamic processes should also be obviously different. For example, the energy required for diffusion along the grain boundary is lower, and the embedding into interstitial position in the grain needs to overcome a higher potential barrier; relatively speaking, the energy of hydride nucleation and flower growth is relatively small, while the formation of hydrogenated solid solution takes more energy.
At a certain hydrogen pressure, when the temperature increases, the parent phase is easier to decompose and the hydride is easier to form, so the hydrogen absorption and desorption kinetics of this kind of hydrogen storage material is characteristic.
The results show that the hydrogen absorption rate and hydrogen absorption capacity increase with the increase of temperature; on the contrary, the increase of temperature has little effect on the diffusion of hydrogen atoms into the matrix of the alloy. therefore, the hydrogen absorption kinetics of hydrogen storage materials whose hydrogen storage body is hydrogenated solid solution shows that the hydrogen absorption rate and hydrogen absorption capacity decrease with the increase of temperature.
When the hydride and the hydrogenated solid solution are formed, it needs to be restored to the equilibrium state, and the energy released by the material whose hydrogen storage body is hydride when it returns to the equilibrium state.
The quantity (heat) is much lower, and the material whose main body of hydrogen absorption is hydrogenated solid solution releases a large amount of energy (heat) when the equilibrium is restored. Therefore, it is not comprehensive to say that hydrogen absorption is an exothermic process and hydrogen desorption is an endothermic process. In fact, hydrogen desorption is achieved through the decomposition of hydride or hydrogenated solid solution of hydrogen storage, which of course needs to absorb heat, but after hydrogen desorption, the system needs to release heat to restore to equilibrium state. On the whole, whether it is the hydrogen absorption process or the hydrogen release process, the endothermic and exothermic processes cross each other, that is, some regions are endothermic while others are exothermic.
## ii. On the volume expansion in the process of hydrogen absorption
For the alloy with hydrogenated solid solution as the main body of hydrogen absorption, the lattice parameters and cell volume always increase because the hydrogen atom enters the interstitial position of the parent phase lattice, so the hydrogen absorption process is accompanied by a certain volume expansion. therefore, the hydrogen storage container should have enough space to avoid explosion during hydrogen absorption.
For the alloy with hydride as the main body of hydrogen absorption, the situation is more complicated, which depends on the difference between the total volume of various hydride and non-hydride phases formed after hydrogen absorption of the original hydrogen storage alloy and that of the parent alloy. Therefore, it is difficult to speculate whether there is volume expansion or contraction.
## iii. On the pulverization in the process of hydrogen absorption/desorption
For the alloy with hydrogenated solid solution as the main body of hydrogen absorption, because the hydrogen atom enters the interstitial position of the parent phase lattice, the matrix will introduce microstress (micro-strain) and macroscopic strain. If the sum of the two strains exceeds the yield stress of the original hydrogen storage material, the original grains will be refined and the original particles will be pulverized. This refinement and pulverization become more serious with the increase of hydrogen absorption and desorption cycle.
For the alloy with hydride as the main body of hydrogen absorption, the situation is more complicated. The parent phase of the original alloy is decomposed and the multiphase hydride phase is formed, and their grain size and particle size are closely related to the temperature of hydrogen absorption. Generally speaking, the higher the temperature is, the faster the hydride nucleation is, and the grains and particles are relatively small. Similarly, the refinement and pulverization become more and more serious with the increase of hydrogen absorption and desorption cycle.
### b) Conclusion
Through the introduction of the above section 2-5 and the above comprehensive analysis, the following conclusions are drawn:
However, when the temperature is too high, the hydrogen storage materials that store hydrogen by hydride will still show the above situation, while the hydrogen storage materials that store hydrogen by hydrogenated solid solution may seriously affect the exothermic effect of hydrogenated solid solution because of too high temperature. will not fully show the above.
(2) The kinetic curve of hydrogen absorption at different temperatures at lower hydrogen pressure, the hydrogen storage materials with hydride as the main body show that the initial hydrogen absorption rate and saturated hydrogen absorption capacity increase with the increase of temperature, while the materials with hydrogenated solid solution hydrogen storage show that the initial hydrogen absorption rate and saturated hydrogen absorption capacity decrease with the increase of temperature, which is due to the serious influence of high temperature on the exothermic effect of the system. Similarly, when the hydrogen pressure is too high, the two kinds of hydrogen storage materials may have cross scenarios. Fig. 14 shows the hydrogen absorption curve of Mg hydrogen storage alloy catalyzed by 1 mol% $\mathrm{Nb}_{2}\mathrm{O}_{5}$ [14]. At lower hydrogen pressure (0.2Mpa), the initial hydrogen absorption rate and saturated hydrogen absorption capacity increase with the increase of temperature. However, when the hydrogen pressure is 1.0Mpa, the initial hydrogen absorption rate and hydrogen absorption capacity of $250^{\circ}\mathrm{C}$ are lower than that of $150^{\circ}\mathrm{C}$ (30 seconds ago), and when the hydrogen pressure is 3.0Mpa, there is a cross scenario.
With the emergence of new alloy hydrogen storage materials, the two kinds of alloy materials with hydride as hydrogen storage body and hydrogenated solid solution as hydrogen storage body will have new development, and there may be mixed hydrogen storage materials with both of them, just like the aforementioned Mg-Cu hydrogen storage alloy, in which $\mathrm{Mg}_{2}\mathrm{Cu}$ phase decomposes and then forms $\mathrm{MgH}_{3}$, while $\mathrm{MgCu}_{2}$ phase belongs to Laves phase, which may form hydrogenated solid solution in the process of hydrogen absorption.
In addition, hydrogen storage materials with surface adsorbed hydrogen as the main body, such as microporous/mesoporous hydrogen storage materials, may appear.
It is suggested that attention should be paid to the test and analysis of the newly developed hydrogen storage materials in the following aspects:
special attention should be paid to the structural evolution and microstructure changes of the original phase of hydrogen storage materials in the process of hydrogen absorption and desorption. From the XRD analysis experiment introduced in section 3, it can be seen that the XRD analysis sample did not do any special treatment. It seems that when the contribution of surface adsorption to hydrogen storage can be ignored, it is not necessary to make on-line (in situ) XRD analysis, but can be sampled in each stage of hydrogen absorption and desorption, because the hydride and hydrogenated solid solution are quite stable, and when the experimental results show that there is no phase transition, special attention should be paid to the displacement, broadening and relative strength of the diffraction lines. When carrying out this kind of test and analysis, if there are conditions, it is best to use neutron diffraction technology, because the scattering factor of X-ray of H and metal is very different, and the contribution of H atom to X-ray diffraction intensity is very little. On the other hand, there is a small difference in the scattering factor between H and metal, which can show the contribution of H atom to the diffraction intensity.
(3) The performance of hydrogen absorption-desorption cycle is very important. The 2015 hydrogen storage target of the United States Department of Energy stipulates that it should have the capacity of 1500 cycles of hydrogen absorption and desorption cycle. While studying the cycle performance and cycle performance attenuation, attention should be paid to the test, analysis and study of the changes of crystal structure, fine structure and microstructure parameters of hydrogen storage materials with the cycle cycle according to the methods introduced in chapters 14 and 15 of this book. In order to explore the reasons for the decline of cycle performance and provide ideas for improving the cycle performance of alloy hydrogen storage materials.
The above recommendations also seem to be necessary for developed/applied hydrogen storage materials, especially for typical hydrogen storage materials.
Generating HTML Viewer...
References
58 Cites in Article
Fan Shifeng (2010). Hydrogen Storage in Interstitial Metal Hydrides.
Min Zhu (2015). Ammonia-Based Hydrogen Storage Materials.
Darren Broom (2013). Hydrogen Sorption Properties of Materials.
Jai Young Lee,S Byun,C Park,J Park (1982). A study of the hydriding kinetics of TiFe and its alloys.
J Stakebake (1979). Unknown Title.
Wajid Ali,Mingyang Li,Pengyue Gao,Chengzhang Wu,Qian Li,Xionggang Lu,Chonghe Li (2016). Hydrogenation properties of Ti-Fe-Mn alloy with Cu and Y as additives.
Huang Taizhong,Wu Zhu,Xia Baojia,Xu Naixin (2005). Influence of stoichiometry and alloying elements on the crystallography and hydrogen sorption properties of TiCr based alloys.
Huang Taizhong,Wu Zhu,Xia Baojia,Xu Naixin (2006). Effect of stoichiometry on hydrogen storage performance of Ti–Cr–VFe based alloys.
Lu Manqi,Qi Zhenzhong,Wu Pingsen (1980). study on the kinetics of hydrogen absorption process of LaNi5.
Cao Da-Li,Chen De-Min2,Liu Yi,Ma Lei,Lu Man-Qi,Yang Ke (2011). Structure and hydrogen storage performance of LaNi 4.25 Al 0.75 alloy.
A Percheron-Guégan,C Lartigue,J Achard,P Germi,F Tasset (1980). Neutron and X-ray diffraction profile analyses and structure of LaNi5, LaNi5−xAlx and LaNi5−xMnx intermetallics and their hydrides (deuterides).
Zhang Ruijing,Cao Manqi,Chen Li,Demin (2004). Yang Ke and LaNi5-xAlx alloys on hydrogen absorption capacity and equilibrium hydrogen pressure.
Tai Yang,Zeming Yuan,Wengang Bu,Zhichao Jia,Yan Qi,Yanghuan Zhang (2016). Evolution of the phase structure and hydrogen storage thermodynamics and kinetics of Mg 88 Y 12 binary alloy.
Z Wu,Y Li,Q Zhang,Et (2016). Catalytic effet on nanostructured Mg 2 Ni and YH2/YH3 on hydrogen absorption-desorption kinetics of Mg-Cu-H system.
Nobuko Hanada,Takayuki Ichikawa,Hironobu Fujii (2007). Hydrogen absorption kinetics of the catalyzed MgH2 by niobium oxide.
Zilong Hu (2002). Unknown Title.
; Dajiaotaizhang,Wu Yongkuan (1990). Properties and applications of Metal hydrides.
(1988). Hydrogen in Intermetallic Compounds (I and II).
Diane Sagnella,Emily Foster (2014). Genie: new software for rapid submission of powder diffraction data to the ICDD powder diffraction file™.
Yang Chuanzheng,Chen Xiedacai,Zhong Guizun,Fumin (1989). Phase diffraction Analysis.
Jiang Chuanhai,Yang Chuanzheng (2010). X-ray diffraction and scattering Analysis of Materials.
Pang Huang Xiaoping,Yang Yanrong,Liying (2013). Progress in non-destructive testing of hydrogen storage alloys during hydrogen absorption and desorption.
E Gray,C Webb (2012). In-situ diffraction techniques for studying hydrogen storage materials under high hydrogen pressure.
Cheng Honghui,Li Kang,Han Xingbo (2013). a testing device of in situ synchrotron radiation X-ray diffraction for hydrogen storage alloy during hydrogen absorption and desorption.
Andrey Roman V Denys,Jan Poletaev,Pettermaehlen (2012). Nanostructured rapidly solidified LaMg 11 Ni alloy. II. In situ synchrotron X-ray diffraction studies of hydrogen absorptionedesorption behaviours.
Siarhei Kalinichenka,Lars Röntzsch,Carsten Baehtz,Thomas Weißgärber,Bernd Kieback (2011). Hydrogen desorption properties of melt-spun and hydrogenated Mg-based alloys using in situ synchrotron X-ray diffraction and TGA.
Siarhei Kalinichenka,Lars Röntzsch,Carsten Baehtz,Bernd Kieback (2010). Hydrogen desorption kinetics of melt-spun and hydrogenated Mg90Ni10 and Mg80Ni10Y10 using in situ synchrotron, X-ray diffraction and thermogravimetry.
Yeqi Hu,H Zhang,C Yan,L Ye,B Ding,Z Hu (2004). Preparation and hydrogenation of body-centered-cubic TiCr2 alloy.
C Stan,K Asano,K Sakaki,E Akiba,S Couillaud,J-L Bobet (2009). In situ XRD for pseudo Laves phases hydrides highlighting the remained cubic structure.
A Pebler,E Gulbransen (1967). I'runs.
D Shaltiel,I Jacob,D Davidov (1977). Hydrogen absorption and desorption properties of AB2 laves-phase pseudobinary compounds.
I Jacob,D Shaltiel,D Davidov,I Miloslavski (1977). A phenomenological model for the hydrogen absorption capacity in pseudobinary laves phase compounds.
John Johnson,James Reilly (1978). Reaction of hydrogen with the low-temperature form (C15) of titanium-chromium (TiCr2).
I Jacob,D Shaltiel (1978). Hydrogen absorption in Zr(AlxB1−x)2 (BFe, Co) laves phase compounds.
J-J Didisheim,K Yvon,D Shaltiel,P Fischer,P Bujard,E Walker (1979). The distribution of the deuterium atoms in the deuterated cubic laves-phase ZrV2D4·5.
Yuan Zhiqing (2004). study on the microstructure of AB5 type hydrogen storage alloy and its hydride by X-ray diffraction.
Yuan Zhiqing,Lu Guanglie,Zeng Yuewu (2004). study on crystal structure and microstructure of ternary hydrogen storage alloy La (Ni,Sn) 5hydx (xylene 0.
Li Yuxia,Yang Chuanzheng,Lou Yuwan,Xia Baojia (2009). study on the physical mechanism of conductivity in the charge-discharge process of MH/Ni batteries.
Yang Chuanzheng,Lou Yuwan,Xia Baojia (2009). Chemical and physical phenomena and Mechanism of Ni-MH Battery during charge and discharge.
Yang Chuanzheng,Lou Yuwan,Zhang Jian,Xia Xiexiaohua,Baojia (2015). material characterization and electrode process mechanism of green secondary battery.
A Percheron-Guégan,C Lartigue,J Achard,P Germi,F Tasset (1980). Neutron and X-ray diffraction profile analyses and structure of LaNi5, LaNi5−xAlx and LaNi5−xMnx intermetallics and their hydrides (deuterides).
Daisuke Endo,Kouji Sakaki,Etsuo Akiba (2007). Lattice expansion for MmNi4.30-xMmNi4.30-xCoxCoxAl0.30Mn0.40 (x=0,0.75)(x=0,0.75) studied by in situ X-ray diffraction.
Yumiko Nakamura,Jin Nakamura,Kenji Iwase,Etsuo Akiba (2009). Distribution of hydrogen in metal hydrides studied by in situ powder neutron diffraction.
Siarhei Kalinichenka,Lars Röntzsch,Carsten Baehtz,Bernd Kieback (2010). Hydrogen desorption kinetics of melt-spun and hydrogenated Mg90Ni10 and Mg80Ni10Y10 using in situ synchrotron, X-ray diffraction and thermogravimetry.
Lars Siarheikalinichenkaa,Carsten Rontzschb,Baehtzc (2011). Hydrogen desorption properties of melt-spun and hydrogenated Mg-based alloys using in situ synchrotron X-ray diffraction and TGA.
Zhang Taiping (2003). calculation of the utilization rate of the densest packing space of three types of metal crystals.
Charles Magee,James Liu,Charles Lundin (1981). Relationships between intermetallic compound structure and hydride formation.
Cao Da-Li,Chen De-Min2,Liu Yi,Ma Lei,Lu Man-Qi,Yang Ke (2011). Structure and hydrogen storage performance of LaNi 4.25 Al 0.75 alloy,.
Yuan Manxue,Han Jianwen,Lai Chengming (1998). theoretical study of hydrogen storage state in LaNi5 hydrogen storage materials.
Wang Hong,Liu Zuyan (2004). crystallographic Analysis of maximum hydrogen Storage capacity of LaNi5.
A Bowman,J L Anderson,N Merson (1973). Rare Earth Intermetallics.
V Yartis,V Burnasheva,K Vsemenko (1982). Unknown Title.
A Percheron-Gguegan,C Lartigue,J Achard (1980). Unknown Title.
M Latroche,A Percheron-Guégan,Y Chabre (1999). Influence of cobalt content in MmNi4.3−xMn0.3Al0.4Cox alloy (x=0.36 and 0.69) on its electrochemical behaviour studied by in situ neutron diffraction.
Daniel Chartouni,Nobuhiro Kuriyama,Andreas Otto,Volker Güther,Christoph Nützenadel,Andreas Züttel,Louis Schlapbach (1999). Influence of the alloy morphology on the kinetics of AB5-type metal hydride electrodes.
J Davenport,G Dienes,R Johnson (1982). Surface effects on the kinetics of hydrogen absorption by metals.
Zhang Xiu-Lan,Huang Zheng,Chen Bo,Ma Huan-Feng,Gao Guo-Qiang (2007). Thermodynamic analysis of the hydrogen storage of LaNi5.
No ethics committee approval was required for this article type.
Data Availability
Not applicable for this article.
How to Cite This Article
Chuan-Zheng Yang. 2026. \u201cThe Characters and Mechanism Research of Hydrogen Absorption/Desorption Kinetics for Alloy Hydrogen Storage Materials\u201d. Global Journal of Science Frontier Research - A: Physics & Space Science GJSFR-A Volume 23 (GJSFR Volume 23 Issue A3).
Explore published articles in an immersive Augmented Reality environment. Our platform converts research papers into interactive 3D books, allowing readers to view and interact with content using AR and VR compatible devices.
Your published article is automatically converted into a realistic 3D book. Flip through pages and read research papers in a more engaging and interactive format.
Our website is actively being updated, and changes may occur frequently. Please clear your browser cache if needed. For feedback or error reporting, please email [email protected]
Thank you for connecting with us. We will respond to you shortly.