## I. INTRODUCTION
The senses (taste, smell, sight, hearing and proprioception) contribute to the identification of foods and determine their reward levels or "hedonic" characteristics, for this reason, the responses of the sensory receptors influence both the stimulation and the inhibition of food intake (Hetherington et al., 1989).
Taste is a complex sense that detects a wide range of chemical molecules but translates them into a limited number of distinct perceptions called flavors, such as sour, salty, sweet, bitter, and umami (Shimemura et al., 2016). These perceptions influence the acceptability of food and play a crucial role in human survival. Furthermore, their impact extends to overall health (Feeney et al., 2011). However, some theories suggest that differences in taste perception have a neuronal origin and are influenced by factors (such as sex, age, ethnicity) that are the key to guiding future research on the pathophysiology of taste perception in humans (Leigh et al., 2018).
Despite it is well accepted that all medical conditions associated with pathologies require dietary adjustments, little has been studied in depth regarding the relationship between the physiological, anatomical and sensory changes inherent to diseases and how these influence food choices or alter dietary patterns (Ng et al., 2004).
And although there is indeed no clear neurophysiological mapping of taste alterations associated with medical conditions, there is evidence that this sense is affected in various diseases such as cancer and inflammation (Schalk et al., 2018), hypertension (Fallis et al., 1962), and diabetes mellitus (Fabbi, 1954).
In parallel and for several years, excess body fat (adiposity), reflected in terms of overweight or obesity, has become a medical condition of utmost importance as it is a cause of comorbidity, as well as a risk factor for the development of many chronic non-communicable diseases (NCDs) (Safaei et al., 2021).
Possible differences in sensory response between people of different body weights remain a developing field of research. While recent studies generally confirm previous data showing no significant differences in food appreciation (particularly sweetness) between normal-weight and obese people, some studies suggest differences in certain aspects of appetite. For example, satiety to sweetness may occur more slowly in obese people compared to those of normal weight, possibly stimulating greater intake (Pepino & Mennella, 2012).
Along the same lines, Mexico is the second country in the world with obesity and overweight in adults (Romero-Martínez et al., 2019). It is known that this excessive adiposity can be assessed by different methods, such as anthropometric indices; among the most used to define obesity in the population are the body mass index (BMI), the waist-to-height ratio (WHTR) and the waist-to-hip ratio (WHR) (Shamah Levy et al., 2020).
Considering the above, studies revealing the role of adiposity in primary taste perceptions, as well as in dietary patterns, are limited. Therefore, the present work aimed to evaluate whether excess adiposity is correlated with the alteration in the chemoperception of basic tastes (sweet, salty, sour, umami, bitter and astringent) and in the global taste perceived by young adults, in addition to evaluating the differences in men and women.
## II. METHODOLOGY
A quantitative, descriptive, cross-sectional study was conducted on 22 students (14 women and 8 men) randomly selected and regularly enrolled during the months of February to December 2018. The sample size calculation was done considering a population of 1,500 students of the Biochemical Engineering degree at the National Technological Institute of Mexico, Celaya campus, in an age range of 20 to 30 years, with a confidence level of $95\%$ and a margin of error of $20\%$. The exclusion criteria were being a smoker, consuming alcoholic beverages, having excessive coffee consumption (more than 3 times a week) and/or presenting any NCDs.
During the study, the ethical principles of dignity, protection of rights and well-being of participants were respected, following the regulations of the General Health Law on Health Research and the Declaration of Helsinki. After authorization from the Ethics and Research Committee, participants were recruited. They signed an informed consent before undergoing the assessments, safeguarding their integrity throughout the data collection process.
### a) Training of Participants
Participants received training with basic tastes on 10-point intensity scales (grams of solute/total grams of solution $\times$ 100) (Trachootham et al., 2018). The calibration standards used for taste were sucrose for the sweet taste, caffeine for the bitter taste, citric acid for the sour taste, sodium chloride for the salty taste, monosodium glutamate for the umami taste, and quinine hydrochloride for the astringent sensation. Finally, the sum of each $\%$ was expressed as the overall taste as established by Melgar (2004). The training was carried out during 25 sessions per month distributed in 5 sessions per week, each lasting 1 hour and having a daily frequency (except for the weekend).
Subsequently, they were given discriminative triangular tests, in which the subject was presented with triads of solutions in white glasses coded with three-digit numbers chosen at random, and they were asked to indicate the intensity and taste perception detected in the sample (Frijters et al., 1980)
### b) Anthropometric Measurement
Anthropometric measurements were performed by a nutrition specialist using a SECA brand fiberglass tape. A 2.20 m SECA brand stadiometer was used for height, and a digital scale (body fat analyzer scale model 5736f, Taylor brand) was used for weight. Three anthropometric indices were used to diagnose excess body fat: BMI (excess body fat $>25\mathrm{kg} / \mathrm{m}^2$ ) (Sommer et al., 2020), waist-to-height ratio (WHtR) (cut-off point $>0.5$ ) (Macek et al., 2020a), and the waist-hip ratio (WHR), which considered the cut-off points for the Hispanic population (men $<0.90$ and women $<0.85$ ) (Lear et al., 2010).
### c) Classification of Taste Perception
Traditionally, the level of flavor perception is set on a 10-point scale (Melgar, 2004). However, there is no reference cohort point for classifying the level of flavor perception. In order to be able to make comparisons regarding the elements that make up the mean, a normalization of the taste measurements was carried out using a statistical "standard normalization." This transformation of the scale was carried out by calculating the Z value for a standard normal distribution of a variable, which is obtained by subtracting the observed value from the population mean and dividing the result by the population standard deviation (Bhandari, 2020); using this procedure, they were classified into quartiles (low, poorly, good and excellent) for simple correspondence analysis.
## III. DATA ANALYSIS AND STATISTICAL ANALYSIS
The collected data were expressed as mean $\pm$ standard deviation. Data normality was verified using the Shapiro-Wilk test (results not shown). To analyze the subjects' general parameters, a Student's t test for independent samples was applied; and to evaluate the association between tastes and anthropometric indices, a simple correspondence analysis was performed. Finally, the results were corroborated by a Pearson correlation, using IBM SPSS software version 26.
## IV. RESULTS
Figure 1 shows the prevalence and distribution of adiposity based on anthropometric indices for the present study. Considering the WHtR, it was found that $57.1\%$ of women had adequate adiposity (AA), values $p < 0.05$ that differed when considering the WHR $(78.6\%)$ as well as the BMI $(50\%)$ as criteria. In the case of men, $50\%$ had inadequate adiposity (IA) considering both the WHtR and the WHR, values $p < 0.05$ that were higher compared to the BMI criterion $(37.5\%)$. This reaffirms that the WHR and the WHtR, despite being new cohort points to determine adiposity and obesity, are not comparable metrics with each other, that is, they have different sensitivity by sex, but both are more sensitive than the BMI.
To verify the presence of body differences between the groups, table 1 presents the descriptive characteristics of the population, subdivided by anthropometric parameters (BMI, WHR, WHtR) and segmented by adiposity cohort point. Of the 22 participants, all were classified as young adults with an age range of 20 to 24 years. It was observed that $64\%$ of the study population were women, with an average weight of $64\mathrm{kg}$ and a height of $1.6\mathrm{m}$. In the case of men, the average weight was $78\mathrm{kg}$ and height $1.7\mathrm{m}$; Likewise, the average values for waist circumference in women and men exceeded $80\mathrm{cm}$ and $94\mathrm{cm}$, respectively.
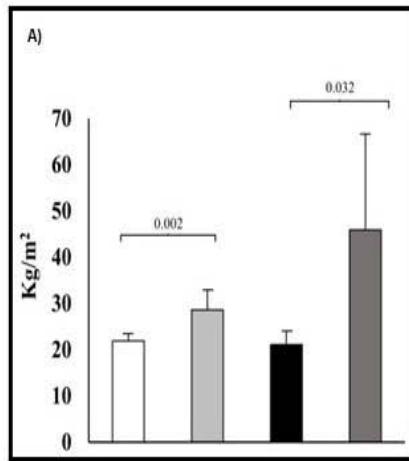
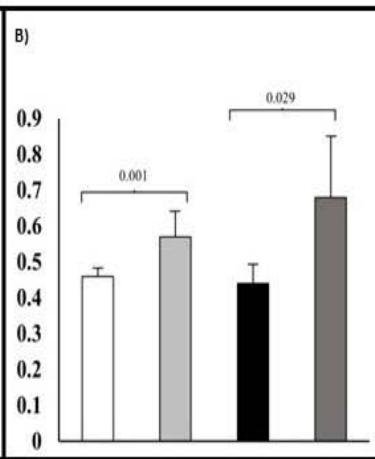
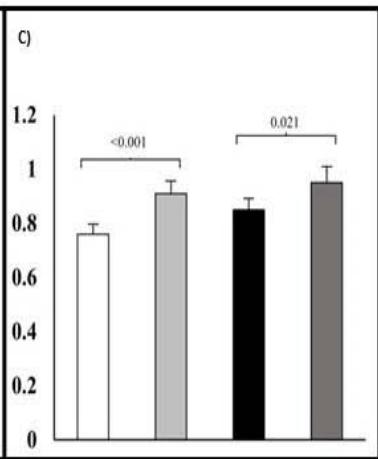
 Fig. 1: Classification of Adiposity by Anthropometric Index
The results are expressed as the mean $\pm$ standard deviation of the subjects constituting each group. Statistically different values $(p < 0.05)$ are indicated using the t-student test. Panel "A" body mass index (BMI), panel "B" waist-to-hip ratio (WHR), panel "C" waist-to-height ratio (WHtR); AA: Adequate adiposity for subjects within the cohort points; IA: Inadequate adiposity for subjects outside the cohort points.
Table 1: Descriptive Characteristics of the Population
<table><tr><td colspan="12">Women</td></tr><tr><td>Anthropometric Index</td><td>n</td><td>Age (years)</td><td>p</td><td>Weight (Kg)</td><td>p</td><td>Height (m)</td><td>p</td><td>Waist circumferenc e (cm)</td><td>p</td><td>Hip circumference (cm)</td><td>p</td></tr><tr><td>BMI AA</td><td>7</td><td>22.3±1.1</td><td>0.484</td><td>56.0±5.2</td><td>0.008</td><td>1.6±0.1</td><td>0.966</td><td>73.3±2.3</td><td>0.006</td><td>96.1±4.4</td><td>0.008</td></tr><tr><td>BMI AI</td><td>7</td><td>22.9±1.8</td><td></td><td>73.5±13.8</td><td></td><td>1.6±0.1</td><td></td><td>88.8±12.2</td><td></td><td>106.9±8.0</td><td></td></tr><tr><td>WHR AA</td><td>11</td><td>22.5±1.5</td><td>0.904</td><td>60.0±7.4</td><td>0.006</td><td>1.6±0.1</td><td>0.410</td><td>76.0±5.2</td><td><0.001</td><td>99.5±6.2</td><td>0.087</td></tr><tr><td>WHR AI</td><td>3</td><td>22.7±1.5</td><td></td><td>82.0±18.6</td><td></td><td>1.6±0.0</td><td></td><td>99.3±10.4</td><td></td><td>108.8±12.8</td><td></td></tr><tr><td>WHtR AA</td><td>8</td><td>22.8±1.7</td><td>0.615</td><td>57.6±6.7</td><td>0.015</td><td>1.6±0.1</td><td>0.608</td><td>74.1±3.1</td><td>0.004</td><td>96.9±4.8</td><td>0.011</td></tr><tr><td>WHtR AI</td><td>6</td><td>22.3±1.2</td><td></td><td>74.2±14.9</td><td></td><td>1.6±0.1</td><td></td><td>90.3±12.6</td><td></td><td>107.6±8.5</td><td></td></tr><tr><td colspan="12">Man</td></tr><tr><td>BMI AA</td><td>5</td><td>21.6±1.5</td><td>0.785</td><td>65.1±8.7</td><td><0.001</td><td>1.8±0.1</td><td>0.716</td><td>79.1±8.8</td><td><0.001</td><td>92.2±6.7</td><td><0.001</td></tr><tr><td>BMI AI</td><td>3</td><td>21.3±0.6</td><td></td><td>99.7±3.4</td><td></td><td>1.5±0.3</td><td></td><td>111.5±6.1</td><td></td><td>115.5±3.3</td><td></td></tr><tr><td>WHR AA</td><td>4</td><td>21.3±1.5</td><td>0.595</td><td>63.8±9.4</td><td>0.017</td><td>1.8±0.1</td><td>0.252</td><td>77.1±8.8</td><td>0.012</td><td>91.0±7.1</td><td>0.016</td></tr><tr><td>WHR AI</td><td>4</td><td>21.8±1.0</td><td></td><td>92.4±14.8</td><td></td><td>1.6±0.3</td><td></td><td>105.4±13.2</td><td></td><td>10.9±9.6</td><td></td></tr><tr><td>WHtR AA</td><td>4</td><td>21.3±1.5</td><td>0.595</td><td>63.8±9.4</td><td>0.017</td><td>1.8±0.1</td><td>0.252</td><td>77.1±8.8</td><td>0.012</td><td>91.0±7.1</td><td>0.016</td></tr><tr><td>WHtR AI</td><td>4</td><td>21.8±1.0</td><td></td><td>92.4±14.8</td><td></td><td>1.6±0.3</td><td></td><td>105.4±13.2</td><td></td><td>110.9±9.6</td><td></td></tr></table>
The results are expressed as the mean $\pm$ standard deviation of the subjects constituting each group. Statistically different values $(p < 0.05)$ are indicated using the t-student test. AA: Adequate adiposity for subjects within the cohort points; Al: Inadequate adiposity for subjects outside the cohort points; BMI: Body mass index; WHtR: Waist-to-height ratio; WHR: Waist-to-hip ratio, and n: number of subjects.
Furthermore, in table 3 was observed that, regardless of sex and as expected, all anthropometric parameters (weight, waist circumference, hip circumference, among others) showed significant differences between subjects with inadequate adiposity (IA) and adequate adiposity (AA).
Figure 2, section A, presents the multiple correspondence analysis for the flavor components and anthropometric indices. For dimension 1 (Table 2), a Cronbach's alpha value of 0.92 was obtained, with an eigenvalue of 9.43 and an inertia of 0.26. The main associated variables in this dimension are salty taste, sweet taste, astringency and overall perception in relation to sex. Regarding dimension 2, the Cronbach's alpha value was 0.91, with an eigenvalue of 8.85 and an inertia of 0.24. In this dimension, it was observed that all anthropometric indices (WHR, WHtR and BMI) showed a remarkable correspondence with the bitter, sour and umami taste variables.
In section B of the figure 2, it is shown that, when grouping the data by the anthropometric indices according to the level of adiposity, as well as the intensity in the perception of the flavor, the distribution in the quadrants was as follows: in quadrant 1, the variables WHR IA are grouped with the male sex, together with the perception of the astringent, bitter and global flavors in the excellent category, as well as the umami and sweet flavors at a good perception level.
Table 2: Correspondence Model Summary
<table><tr><td rowspan="2">Dimension</td><td rowspan="2">Cronbach's alpha</td><td colspan="2">Variance accounted for</td></tr><tr><td>Total (self-value)</td><td>Inertia</td></tr><tr><td>1</td><td>0.92</td><td>9.44</td><td>0.26</td></tr><tr><td>2</td><td>0.91</td><td>8.86</td><td>0.25</td></tr><tr><td>Total</td><td></td><td>18.29</td><td>0.51</td></tr><tr><td>Mean</td><td>0.92</td><td>9.15</td><td>0.25</td></tr></table>
Table 3: Discriminatory Measures Calculating Row and Column scores
<table><tr><td rowspan="2">Variable</td><td colspan="2">Dimension</td><td rowspan="2">mean</td></tr><tr><td>1</td><td>2</td></tr><tr><td>BMI</td><td>0.189</td><td>0.216</td><td>0.202</td></tr><tr><td>Sweet</td><td>0.181</td><td>0.019</td><td>0.100</td></tr><tr><td>Salty</td><td>0.730</td><td>0.129</td><td>0.430</td></tr><tr><td>Sour</td><td>0.003</td><td>0.083</td><td>0.043</td></tr><tr><td>Umami</td><td>0.137</td><td>0.495</td><td>0.316</td></tr><tr><td>Bitter</td><td>0.026</td><td>0.424</td><td>0.225</td></tr><tr><td>Astringency</td><td>0.686</td><td>0.444</td><td>0.565</td></tr><tr><td>Global flavor</td><td>0.411</td><td>0.070</td><td>0.240</td></tr><tr><td>WHR</td><td>0.028</td><td>0.473</td><td>0.250</td></tr><tr><td>WHtR</td><td>0.079</td><td>0.338</td><td>0.209</td></tr><tr><td>Sex</td><td>0.041</td><td>0.065</td><td>0.053</td></tr><tr><td>Total</td><td>9.286</td><td>8.709</td><td>8.998</td></tr></table>
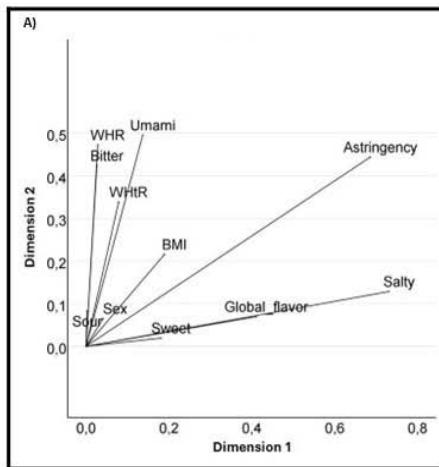
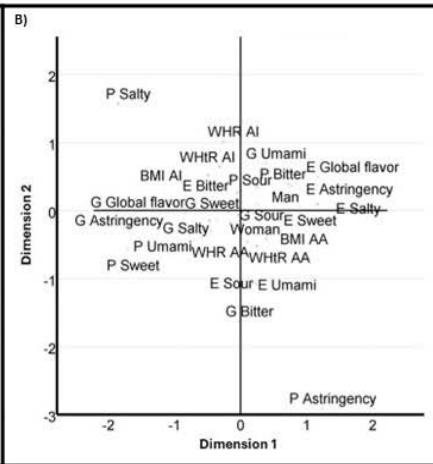
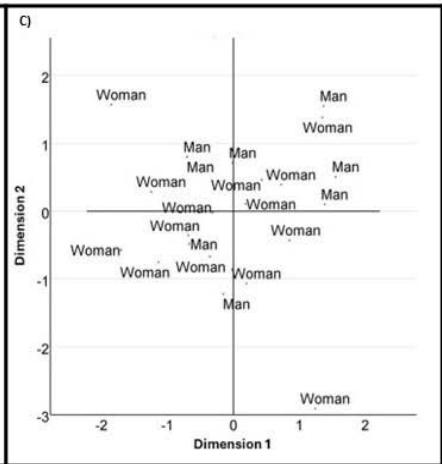 Fig. 2: Correspondence Model between Flavors and Anthropometric Index
Panel A indicates the relationship between primary tastes, gender and anthropometric index. Panel B shows the association between taste perception levels and degree of adiposity. Panel C shows the distribution of subjects associated with each component. P: poor; E: excellent; G: good; AI: Inadequate adiposity for subjects outside the cohort points; AA: Adequate adiposity for subjects within the cohort points; WHR: Waist-to-hip ratio.
In quadrant 2, the WHtR IA and the BMI IA are found, associated with the sweet flavor at a good perception level and the astringent flavor at a regular perception level. Quadrant 3 includes the variables WHR IA with the female sex, and an excellent perception of the acid and umami flavors, as well as a good perception of the bitter flavor.
Finally, in quadrant 4, the variables BMI AA and WHtR AA are grouped, associated with the perception of the salty flavor at an excellent intensity and the astringent flavor at a regular intensity.
Section C of figure 3 shows the distribution of subjects according to sex. In this figure it can be observed that the highest concentration of men is found in quadrant 1, while women predominate in quadrant 3.
Table 4 shows the correlation between anthropometric indices and taste perceptions. In AA women, significant positive correlations were observed between bitter taste and BMI $(p = 0.014)$ as well as with WHtR $(p = 0.047)$. In IA women, overall taste showed a positive correlation with BMI $(p = 0.028)$ and WHtR $(p = 0.043)$. In addition, WHtR showed a positive correlation with salty $(p = 0.001)$, umami $(p = 0.047)$ and astringent $(p = 0.012)$ tastes. Sour taste also showed a significant correlation with WHtR $(p = 0.048)$.
An interesting trend observed in AA women was the negative correlation with sweet taste; however, these were not significant.
In men, only the IA group showed significant negative correlations between bitter taste and all anthropometric indices (BMI, $p = 0.004$; WHR, $p = 0.028$; WHtR, $p = 0.028$ ). Furthermore, sweet taste showed a negative correlation with BMI ( $p = 0.004$ ).
This suggests that excess adiposity correlates significantly with astringent taste perception in both men and women. Furthermore, the distribution of adiposity (central obesity) in women significantly influences taste perception.
## V. DISCUSSION
In Figure 1, young adult college students were identified and categorized as showing differences in adiposity according to three anthropometric criteria (BMI, WHR, WHtR). Although some of these criteria, in addition to indicating excess adiposity, are markers of cardiovascular risk, the present study focuses on highlighting the relationships between excess adiposity (regardless of degree) and alterations in taste perceptions.
It is now known that people may experience alterations in taste perception, or chronic dysgeusia (a persistent taste sensation), as a result of a true stimulus in the mouth (for example, the taste of an oral infection) or when stimuli reach taste receptors through the bloodstream (for example, the persistent bitterness of some medications) (Bartoshuk & Snyder, 2016).
Considering the above, it is unavoidable to assume that visceral adiposity represents a risk factor that can alter the composition of the blood profile in more than half of the subjects evaluated (assumptions that will be corroborated as the discussion progresses). In addition, other authors have indicated that obesity modifies the blood profile, especially in terms of lipids, monosaccharides and ferritin, which could become a cause of dysgeusia (Custodio et al., 2003).
In the current sample (Table 1), the prevalence of women was higher compared to that of men, which coincides with the gender distribution at the national level, where the proportion of women is higher than that of men (Barquera et al., 2020). Regarding body distribution, the anthropometric differences inherent to the anatomical characteristics of each sex were confirmed: the gluteal-femoral adipocytes of women are larger than those of men, while the abdominal adipocytes are comparable between both sexes, and the visceral adipocytes in women are smaller (Karastergiou et al., 2012).
The high values in the waist circumference of the participants agree with what is reported for the Mexican population, whose expected theoretical parameters are 87 cm for women and 100 cm for men (Macek et al., 2020b). Furthermore, the results agree that the WHtR is the index with the highest sensitivity for diagnosing obesity in women (Hernández Rodríguez et al., 2018). Although these results are alarming, they unfortunately align with the prevalence of overweight and obesity reported by ENSANUT 2018-2019 (Instituto Nacional de Salud Pública, 2020), where $54\%$ of young adults are overweight or obese, regardless of gender.
Since the present study was not designed to assess possible mechanisms, the reasons for these differences in detection and explanation thresholds for taste preferences are unknown. However, some speculative hypotheses are proposed below regarding the results obtained based on current information in the literature.
For dimension 1, saltiness was found to be correlated with the variable sex, which is consistent with reports in the literature indicating possible gender differences in optimal levels of salt concentration perception. However, data are contradictory as to whether men or women prefer higher levels of salt (Hayes et al., 2010).
Also, as for the sweet taste, it is known that women tend to show a greater preference for this (Van Langeveld et al., 2018). Regarding the lack of association with anthropometric indices, the literature indicates that some studies have found lower trends of preference for sweet and salty foods in obese people compared to thin people or have not reported differences in taste perception between different BMI categories.
Sweet taste showed a low relationship with anthropometric indices, which was partly expected, since the literature is inconclusive on the association between obesity and reduced sweet taste perception. The findings are varied and contradictory, both in comparisons between individuals with obesity and control subjects with normal weight, and in intra-individual studies before and after bariatric surgery (Ribeiro & Oliveira-Maia, 2021).
Based on Figure 2, component 2 suggests that tastes associated with regulating food intake (bitter and sour) have a significant association with anthropometric parameters. One possible explanation for the association of WHR, WHtR and BMI with bitter taste is that this taste seems designed to warn the body of potential danger, as a "CAUTION, GO SLOW" signal (Klasing & Humphrey, 2009).
In other words, the analysis suggests that bitter taste may function as an indicator of high palatability relative to adiposity. This phenomenon has been termed "taste consequence learning" (Yeomans, 2010), and suggests that although bitter taste is innately unpleasant, this aspect has evolutionary significance as it is present in multiple species. However, innate aversions to bitterness can also be overcome through learning processes involving rewards.
On the other hand, acidity is considered a negative quality of taste (Koone et al., 2014), since its elevated presence increases the probability of food rejection (Chauhan & Hawrysh, 1988). Overall, the statistical result suggests that these two flavors (bitter and acidity), in a physiological way, would be helping to regulate intake to maintain adequate levels of adiposity.
It is also worth mentioning that the umami taste, present in this component and associated with anthropometric indices, has been pointed out by other authors as a target of diet therapy. It has been observed that women with obesity have a lower taste sensitivity to monosodium glutamate and prefer higher concentrations compared to women of normal weight (Pepino et al., 2010).
A possible explanation for the results in Table 3 suggests that obese subjects may present changes in the functionality of chemosensory receptors, suggesting the presence of morphological variations both in the taste bud receptors and along the gastrointestinal tract as part of an adaptive response mechanism that adjusts the body to a sustained positive energy balance in obesity (Steensels & Depoortere, 2018).
In the case of men, it was observed that all groups with inadequate adiposity (IA) presented a negative correlation with bitter taste. This can be explained considering that obese subjects usually have higher levels of ferritin compared to people with normal weight, because ferritin is not only a marker of iron stores in the body, but also an acute phase reactant, which means that its levels can increase in response to inflammation (Mabry et al., 2010).
Furthermore, obesity, especially when there is accumulation of visceral adipose tissue, is associated with a chronic low-grade inflammatory state. This systemic inflammation stimulates the production of ferritin, which explains the elevated levels of this biomarker in people with obesity. Excess adipose tissue also contributes to insulin resistance and an increased release of inflammatory cytokines, which is related to increased ferritin. However, these elevated ferritin levels do not always reflect a greater amount of iron available to the body, but may be more closely linked to inflammation (Mraz & Haluzik, 2014), Therefore, the results suggest that men with IA have a reduced ability to perceive bitter taste, requiring higher concentrations to detect it.
In the case of women, a positive relationship was observed between bitter taste and adiposity. That is, at adequate (healthy) adiposity levels, women have greater sensitivity to detect this taste, unlike what was observed in men. This can be explained because women tend to have lower levels of ferritin compared to men, due to physiological factors such as menstruation and lower muscle mass (Milman, 2011). However, it is known that women with IA have higher levels of ferritin than women with adequate adiposity (AA), mainly due to their high degree of inflammation and insulin resistance (McKenna et al., 1999; Mraz & Haluzik, 2014).
Regarding the finding that women with IA show a positive correlation between BMI and umami taste perception, this is in line with what has been reported in the literature. Obese women have been observed to have a significantly higher MSG detection threshold, preferring higher concentrations than normal weight women (Pepino et al., 2010).
Regarding the correlation between acidic taste and WHtR in obese women, it has been seen that women have a greater perception of this taste compared to men (Haase et al., 2011). However, this differs from what was reported by other authors, who found that adults with a BMI greater than 28 had a poorer ability to detect sour taste compared to those with a lower BMI (Simchen et al., 2006). Furthermore, an improvement in taste acuity for bitter and sour tastes, along with a reduction in salty and sweet detection thresholds, has been described in the literature after gastric bypass surgery in morbidly obese subjects (Scruggs et al., 1994).
Concerning sweet taste and its correlation with BMI in subjects with IA, one study suggests that people with obesity rate higher concentrations of sweet taste as more pleasant (Rodin et al., 1976). Furthermore, it has been seen that the greater perception of sweet taste could be due to a greater central or peripheral sensitivity to sweet stimuli or to learned associations with feedback after the ingestion of sugars in people with obesity, who show greater activity in the regions of the somatosensory cortex responsible for processing sensations in the mouth, lips and tongue for this taste (Wang et al., 2002).
Furthermore, the literature suggests that in murine models with obesity the perception of sweet taste is influenced by peripheral factors, such as leptin and glucagon-like peptide 1 (GLP-1), suggesting that the signals produced by adipocytes may be fundamental to generate a reward response to monosaccharides (Liu et al., 2016).
Previous studies suggest the chemoreception pathway increases with the high concentrations of fatty acids triggering the receptor or ion channel, which activates a complex signaling cascade including increased cytoplasmic calcium level leading to the depolarization of the receptor cell. As this reaction also involves the production of IP3, the transduction system resembles that of the sweet, bitter and umami (Liu et al., 2016); the above could explain another mechanism by which the condition of obesity that increases the de novo lipogenic pathways would have an altered taste perception.
Finally, a positive correlation was observed between astringency, global sensory perception and WHR in women with IA. This finding is relevant, since the level of intensity with which astringency is perceived varies between individuals and can influence the acceptance of foods rich in polyphenols, mainly foods of plant origin, so these authors suggest that this fact could affect eating habits, promoting a lower consumption of foods rich in polyphenols (Louro et al., 2021); in addition to the above, it was observed that the taste function between sexes showed greater sensitivity in women compared to men, which is consistent with some previous studies (Michon et al., 2009; Yoshinaka et al., 2016; Ervina et al., 2020).
## VI. LIMITATIONS
A number of limitations are inherent to the current study and are addressed below. First, since the study is cross-sectional in nature, future longitudinal studies assessing perceptual behavior in each taste according to each anthropometric index are needed to fully elucidate the reported relationships. Furthermore, although diet and physical activity are known confounders of the relationship between anthropometry and chemoperception, due to lack of relevant data, these variables were not accounted for in the analysis. Nonetheless, notable strengths of the current study included rigorous control in participant selection, training, and testing, as well as rigorous and comprehensive statistical analyses.
## VII. CONCLUSION
In conclusion, the results of this study support the hypothesis that obese and non-obese individuals differ in their perception of taste. The results also suggest that in the case of women, central or visceral adiposity has a prominent impact on the perception of all basic tastes, and in the case of men, excess adiposity, regardless of type, affects the perception of bitter taste.
Considering the literature, changes in taste sensitivity are influenced by endocrine and paracrine processes, which directly condition the exposure of taste sensors to an important range of metabolites that in turn can potentially cause dysgeusia.
It should be noted that the taste system does not only depend on external stimulation through food, but is much more susceptible to health status and metabolic risk factors. However, to date, these modulations are only marginally understood. Therefore, further studies on taste sensitivity and hormonal status in obese subjects are required. Over time, this could help develop new obesity prevention and treatment strategies that improve nutritional education considering taste alterations.
Generating HTML Viewer...
Funding
No external funding was declared for this work.
Conflict of Interest
The authors declare no conflict of interest.
Ethical Approval
No ethics committee approval was required for this article type.
Data Availability
Not applicable for this article.
Dulce María Soria-Lara. 2026. \u201cThe Chemoperception of Primary Flavors and Its Relationship With Adiposity in Young Adults\u201d. Global Journal of Medical Research - K: Interdisciplinary GJMR-K Volume 24 (GJMR Volume 24 Issue K4): .
Our website is actively being updated, and changes may occur frequently. Please clear your browser cache if needed. For feedback or error reporting, please email [email protected]
×
This Page is Under Development
We are currently updating this article page for a better experience.
Thank you for connecting with us. We will respond to you shortly.