I. INTRODUCTION
Fish is an essential source of animal protein and food security. As an animal protein, it is one of the cheapest, most available and affordable source of quality protein (Omitoyin & Osakuade, 2021). On average, fish and its products account for over 40 percent of total animal protein intake in Nigeria (Egun & Oboh, 2022). It also supplies vitamins, minerals and oils with low level of cholesterol (Odoh et al., 2019). Aside the indispensable role of fish in nutrition and food security, it is a great source of employment and income for farmers' families and different categories of people in its value chain (Subasinghe et al., 2021). Nigerians consume of their animal protein from fish, which is one of the least expensive sources of animal protein (Omitoyin & Osakuade, 2021).
In Nigeria, fish farming has a major impact on the prospects for employment. It does not only address the demand for fish consumption but also serves as a source of livelihood for individuals seeking employment opportunities in Nigeria. Studies have highlighted the investment and employment potentials in fish farming, emphasizing its role in creating job opportunities and contributing to economic development in Nigeria (Olabanji & Ali, 2009). It provides a range of professional options, such as jobs in fish farms and hatcheries, aquaculture, and roles like fish hatchery technicians. The industry helps to create jobs for Nigerian workers by offering jobs in sectors including feed production, vegetation management, and equipment manufacturing (Ogunji & Wuertz, 2023). The incorporation of job opportunities and a source of revenue for individuals raises the socio-economic status of farmers and their families in the society (Subasinghe et al., 2021).
Studies on the relationship between fish production and Nigeria's GDP have been carried out; the results highlighted the significance of fish production as a driver of the nation's economic output (Uzonwanne et al., 2023). Fish farming is a major contributor to Nigeria's GDP; in 2020, the sector's share of the country's GDP was ; in 2021, it was in the first quarter (Babangonna, 2021; NBS, 2022).
Fish farming plays a vital role in reducing poverty and contributes significantly to the GDP of Ebonyi State. Economic analysis highlights the positive impacts of fish farming on the local economy which shows a significant reduction of poverty in Ebonyi State (Ozoemena et al., 2022). Additionally, it has been determined that the fisheries sub-sector, which includes fish farming, contributes to the agriculture GDP of Ebonyi State, indicating its significance economically on a regional scale (Ogunji & Wuertz, 2023). It's important to note that fish farming's contribution to Ebonyi State's GDP illustrates its significance for both regional poverty alleviation and economic progress.
The main drawbacks to fish farming enterprise in Nigeria are low productivity, high feed costs, poor infrastructure, bad quality hatchlings, and no access to credit facilities (Akpabio & Inyang, 2007; Ogunremi, et al., 2022; Ogunji & Wuertz, 2023). The limitations in the fish farming industry are also caused by a high mortality rate, a lack of technical skills in fish management and feeding, a lack of novel technologies adopted, and inadequate extension services (Ogunremi & Olatunj, 2019; Onyeneke, et al., 2020).
It is imperative that these limitations are recognised and addressed if Nigeria's aquaculture sector is to grow sustainably. Hence, the important to emphasise the goals of this research, which include to determine the contribution of fish farming to the socioeconomic status of fish farmers in Ebonyi state, ascertain the benefits fish farmers derive from their involvement in fish farming, and identify the respondents' constraints to fish farming.
II. MATERIALS AND METHOD
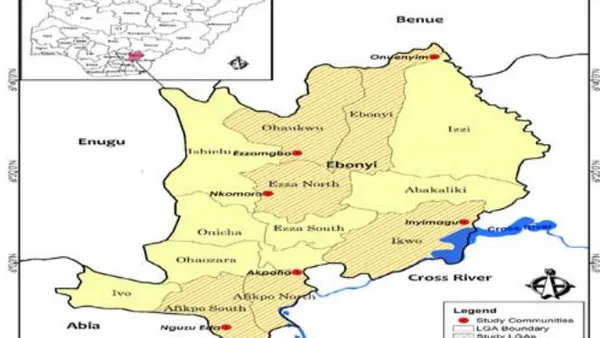
The study was conducted in Ebonyi State, Nigeria. Ebonyi State is in Eastern part of Nigeria which lies between longitudes and and latitudes and with a total landmass of 5,935 square kilometers. The State shares a border with Benue State to the North, Enugu State to the west, Imo and Abia States to the south and Cross River State to the east. Ebonyi is primarily an agricultural region. The state produces large quantity of rice, yam, potatoes, maize, beans, vegetables, and cassava. People of the state also engage in production of fish, poultry and livestock such as goat, sheep, cows among others.
Ebonyi has thirteen local government areas as well as local development centres created by the state government. Ebonyi State has a humid tropical climate, with one rainy season and one dry season lasting for 8 and 4 months, respectively. The temperature typically ranges from 20 to 38 degrees Celsius during the dry season and from 16 to 28 degrees Celsius during the rainy season. Harmattan winds are common between December and January. The average annual temperature is 28 degrees Celsius, and the average annual humidity is . The region receives an average annual precipitation of .
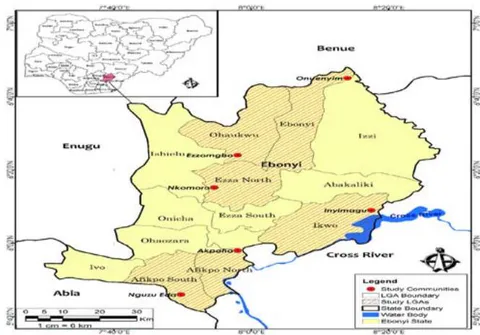
The population for the study comprised of all fish farmers in Ebonyi State, Nigeria. Multistage sampling technique was used to select the sample for the study. In the first stage, all the 3 senatorial zones (Ebonyi North, Ebonyi Central and Ebonyi South) in the State were selected. In the second stage, random sampling was used to select 2 LGAs each from the senatorial zones, making a total of 6 LGAs from the 13 LGAs in the State. These LGAs include; Afikpo North and Afikpo South, Ebonyi, Ohaukwu, Ikwo and Ezza North. In the third stage, two communities each were randomly selected from the 6 LGAs, giving a total of 12 communities. In the fourth stage, a random sampling was used to select 1 village each from the town communities and finally, 8 fish farmers were also randomly selected to give a total of 96 fish farmers for the study.
a) Data Collection, Analysis and Measurement of Variables
Data for the study were obtained through the use a systematic random sampling technique using a well-constructed questionnaire. Descriptive and inferential statistics were used to analyze the data. The independent variables for this study include socioeconomic characteristics, enterprise characteristics, fish farmer's involvement in fish farming, benefits of fish farming, constraints to fish farming while the dependent variable is socio-economic status.
Socio-economic characteristics were ascertained by asking the respondents to indicate their age, sex, marital status, level of education attained, household, religion, major occupation and income. Enterprise characteristics of the respondents were elicited by asking them to indicate their source of labour, source of finance, years of farming experience, training on fish farming, types of ponds used, pond stocking capacity, numbers of pond own, fish varieties, method of land acquisition. Fish farmers' involvement in fish farming activities was measured by asking the respondents to indicate their degree of involvement in fish farming activities such as always involved, occasionally involved and not involved with the assigned numbers of 1, 2, 0 respectively.
The benefits fish farmers derived from fish farming were measured by asking them to indicate the level of benefits from information provided whether it is high, slight and not a benefit with the assigned numbers of 1, 2, 0. With regards to constraints to fish farming, the respondents were asked to indicate their constraints and its degree whether it is major, minor and not a constraint on the basis of information provided. Socio-economic status (dependent variable) was measured by using the scale constructed by Ayeloja et al. (2021). This was measured based on the possession of items and quantity for continuous items as a result of fish farmer involvement in fish farming, however, there is an indication of "YES" for possession of items and "NO" for non-possession of items that are categorical among the respondents.
III. RESULT AND DISCUSSION
a) Respondents' Socio-Economic Characteristics
The result of the respondents' socio-economic characteristics presented in table 1 is as follows;
Age is a key factor in productivity and profitability performance of the farmer (Ngeywo et al., 2015). Age distribution of the respondents shows that of the respondents were between the ages of 31 and 40 years and of them were between the ages of 41 and 50 years. The implication of this finding believes that most of the respondents were in their economically active age and could make decision and enhance productivity with the hope to become better or venture into fish farming to improve their socioeconomic status. This result is consistent with the finding of Adewuyi et al. (2010) and Ayeloja et al. (2021) from their studies on the analysis of profitability and contribution of fish farming to economic status of fish farmers in Ogun and Oyo states respectively.
Also, the majority of the respondents (82.3%) were male while 17.7% of the respondents were female. This means that males were more involved in fish farming than females which is in agreement with the findings of Ayeloja et al. (2021), Adeosun et al. (2019) and Adewuyi et al (2010). This could be due to the nature of fish farming which involved regular supervision and monitoring. This was also supported by Olaoye et al. (2014); Jambo and Bada, (2021) and Deji and Koledoye (2013) which reported that 80 percent of fish farmers in Ondo State, Nigeria were males.
According Abdulaziz et al. (2018), marital responsibility could make farmers make more rational decisions with high accuracy on their own, which could in turn increase their efficiency. Majority of the respondents were married, of them were single, are widowed and of them divorced. This implies that majority of the respondents were married.
On the respondents' religious affiliation, the result also showed that of the respondents were Christians, of the respondents were Muslims while of them practiced traditional religion. This supports the fact that the Christian religion is a popular religion among the respondents in the study area. This is in line with the finding of Adeosun et al. (2019).
Findings also revealed that of the respondents had between 4 and 6 persons in their families and of them had between 7 and 9 persons in their families. From these findings, it could be deduced that most of the respondents had significant household size which is likely to have influenced fish farming activities. The implication was that there could be more support from spouses and children of the farmers with a view to improving and increasing fish production. This also implied that the fish farmers were responsible and had more roles to play in their families and as such they would be eager to improve their agricultural productivity in order to earn more income. This is in agreement with Olawumi et al. (2010) who observed that married household with a reasonable size could provide cheap labor to the family. Also, Nnadi et al. (2014) who found that about of fish farmers in Delta state have an average household size of greater than six.
In this study, it was also observed that of the respondents have tertiary education, of them have secondary education. This implies that most of the respondents attained level of education that qualified them as literate farmers and as such will improve their knowledge and performance in fish farming activities. This finding contradicts the finding of Ayeloja et al. (2021).
On the major occupation of the respondents, practice fish farming as their main occupation while of them are into teaching and civil service respectively. This implies that fish farming in the area is viewed as a profitable venture which makes people to take interest in it despite having other jobs. It is observed that of the farmers earned between 400,000- 500,000 naira, of the respondents earn 100,000-200,000 while earned between 200,000-300,000 naira.
| Variables | Frequency | Percentage | Mean |
| Age | |||
| 21-30 | 16 | 16.7 | |
| 31-40 | 42 | 43.8 | |
| 41-50 | 24 | 25 | |
| 51-60 | 9 | 9.4 | |
| 61-70 | 5 | 5.2 | |
| Total | 96 | 100 | 31-40 |
| Sex | |||
| Male | 79 | 82.3 | |
| Female | 21 | 17.7 | |
| Total | 96 | 100 | Male |
| Religion | |||
| Islam | 4 | 4.1 | |
| Christianity | 83 | 86.5 | |
| Traditional | 9 | 9.4 | |
| Total | 96 | 100 | Christianity |
| Marital Status | |||
| Married | 60 | 62.5 | |
| Divorced | 5 | 5.2 | |
| Single | 23 | 24 | |
| Widowed | 8 | 8.3 | |
| Total | 96 | 100 | Married |
| Household Size | |||
| 1-3 | 10 | 10.4 | |
| 4-6 | 50 | 52.1 | |
| 7-9 | 29 | 30.2 | |
| 10-11 | 7 | 7.3 | |
| Total | 96 | 100 | 4-6 |
| Level of Education | |||
| No formal education | 7 | 7.3 | |
| Tertiary education | 58 | 60.4 | |
| Primary Edu. | 6 | 6.3 | |
| Secondary Edu. | 25 | 26 | |
| Total | 96 | 100 | Tertiary education |
| Major Occupation | |||
| Teaching | 19 | 19.8 | |
| Trading | 18 | 18.8 | |
| Civil service | 19 | 19.8 | |
| Fish farming | 40 | 41.7 | |
| Total | 96 | 100 | Fish farming |
| Income (N)/Cropping Season | |||
| 1,000-100,000 | 13 | 13.5 | |
| 100,001-200,000 | 22 | 23 | |
| 200,001-300,000 | 20 | 20.8 | |
| 300,001-400,000 | 18 | 18.7 | |
| 400,001-500,000 | 23 | 24 | |
| Total | 96 | 100 | 400,001-500,000 |
b) Enterprise Characteristics of the Respondents
On the source of labour by the respondents, of them used paid labour, use family members while of the respondents make use of self labour. This is contradicting to the findings of Onyekuru et al. (2019) and Nnadi et al. (2014) who observed that farmers depended on their family members for labour in Enugu and Delta states respectively.
Majority (61.5%) of the respondents started the business using personal saving while 5.2% got started with bank loan. This is similar to the finding of Ayeloja et al. (2021). On the respondents' years of experience, 43.7% of the respondents had between 1 and 5 years of experience with 56.2% of the respondents having formal training on fish farming. This implies that majority of those in fish farming have not been in the business for a very long time. Oluwasola and Ige (2015) however, posited that fish farming experience was a significant determinant of net income in catfish production.
On the number of ponds of the respondents have 3-4 ponds. On the stocking density, majority of the farmers stock 300-400 fishes.
This implied that fish pond production enterprise in the area was mainly of small-scale type, and this supported the findings of Nunoo et al. (2012). Majority (49%) of the respondents used both concrete, 32.3% of the respondents used tarpaulin pond, 12.6% of the respondents used earthen pond only as holding/rearing structure. This result contradicts the finding of Ajayi (2013) and Ayeloja et al. (2021).
| Variables | Frequency | Percentage | Mean |
| Source of Labour | |||
| Family members | 40 | 41.7 | |
| Paid labour | 43 | 44.8 | |
| Self labour | 13 | 13.5 | |
| Total | 96 | 100 | Paid labour |
| Source of Finance | |||
| Personal savings | 59 | 61.5 | |
| Family members | 25 | 26 | |
| Friends | 2 | 2.1 | |
| Farmers association | 5 | 5.2 | |
| Micro finance bank | 5 | 5.2 | |
| Total | 96 | 100 | Personal savings |
| Years of Experience | |||
| 1-5 years | 42 | 43.7 | |
| 6-10 years | 33 | 34.4 | |
| 11-15 years | 13 | 13.5 | |
| 16-20 years | 8 | 8.3 | |
| Total | 96 | 100 | 1-5 years |
| Types of Ponds Used | |||
| Earthen | 12 | 12.5 | |
| Concrete | 47 | 49 | |
| Plastic tank | 6 | 6.3 | |
| Tarpaulin | 31 | 32.3 | |
| Total | 96 | 100 | Concrete |
| Pond stocking density | |||
| 200-300 | 18 | 18.8 | |
| 301-400 | 14 | 14.6 | |
| 401-500 | 29 | 30.2 | |
| 501-600 | 11 | 11.5 | |
| Above 600 | 24 | 25 | |
| Total | 96 | 100 | 401-500 |
| Number of Pond | |||
| 1-2 | 19 | 19.8 | |
| 3-4 | 39 | 40.6 | |
| 5-6 | 38 | 39.6 | |
| Total | 96 | 100 | 3-4 |
Source and quantity of water available are one of the most important factors to be considered when selecting a site for aquaculture practice. The quantity of water needed for commercial aquaculture varies with the production method employed, type of aquaculture chosen, scale of operation, and species cultured Olaoye et al. (2013). Most of the respondents depend directly on either borehole as their major source of water, 28.1 percent depend on deep well as source of water, while 13.5 percent depend on river/stream. In terms of holding/rearing structure, Fish farmers in the study area preferred monoculture to polyculture system (75%). This may be as a result of poor market price for tilapia and also because of the abundance of catfish in the region. Majority of fish farmers adopt monoculture of African Catfish (Clarias gariepinus). This might be
because it has been observed that fishes grow better when cultured individually under monoculture system and also help the species to grow to its biggest size. Based on the types of species cultured, majority (86.5%) of the fish farmers in the study area culture mainly Clarias spp. under the influence of high market price, greater demand preferences, hardiness of the stock, fast growth, high feed conversion ratio high survival rate under captivity. This may be due to the fact that cat fish appears to be hardy and generally accepted by people. This finding is similar to Ayeloja et al. (2021) and Adeosun et al. (2019) respectively. On land acquisition 46.9% of the respondents inherited the land, 34.4 percent purchased the land they used for fish farming enterprise.
Majority (68.8%) of the respondents get their fish seed from fish hatcheries while (27.1%) of them source their fish seeds from own farms. This is an indication that they are not well trained to operate a personal fish hatchery, while minority (4.2%) depend on governments' farms for fish seeds. The fact is that the fingerlings sourced from fish farms are more likely to be healthier and well breed. This finding disagrees with that of Olaoye et al. (2013) assessment of farming activities in Oyo state. On source of fish feed, majority (77.1%) depend on commercial feed, 20.7% use locally made fish feeds while a small fraction 2.1% produce their feed.
Based on culturing period (production of table size), of the respondent's culture their fish for four months, cultured for six months, cultured for three months, while a very low percentage of them cultured their fish for more than six months. Furthermore, majority of the respondent harvest twice a year, while and do harvest once and thrice respectively. The choice of culture period is usually influenced by factors such as timing towards festive period or due to the lack of feeds as explained by Okoye and Omorinkoba (1994).
Cooperative society is a social participation that helps farmers to pool their resources in order to have access to fisheries inputs and to have insights in their fishing issues. Membership of cooperatives is also a factor that influences the adoption of improved fisheries technologies and poverty alleviation. This shows that majority (54.2%) of the respondents in the study areas were members of cooperative societies while others do not belong to any registered or unregistered society which may be as a result of lack of awareness and interest. Hence, being a member of association /group could create peer pressure for farmers to adopt new technologies. This result is in line with the finding of Olaoye et al. (2013).
On the processing of fish, majority (72.9%) of the farmers process their fish supporting the fact that the farmers are well trained and also the believe in the study area that processed fish product cost more than fresh fish hence increasing the income of farmers. Majority (51%) of the farmers use electricity as source of power while 44.8% use generator. Furthermore, on the price/cost of fish in the region majority of the respondent's sale their fish between 1000-1,500/kg while 15.6% sale between 500-800/kg of fish. This might be attributed to the high cost of fish feed, fish seeds and perceived high cost of processed fish in the study area. Majority of the respondents did not receive specialized training on fish farming which can be reflected on their inability to breed/hatch and produce their own feed which have a significant impact on the price of fish in the area.
| Variables | Frequency | Percentage | Mean |
| Source of water | |||
| Stream/river | 13 | 13.5 | |
| Well | 27 | 28.1 | |
| Borehole | 56 | 58.3 | |
| Total | 96 | 100 | Borehole |
| Types of culture | |||
| Monoculture | 72 | 75 | |
| Polyculture | 17 | 17.7 | |
| Integrated | 7 | 7.3 | |
| Total | 96 | 100 | Monoculture |
| Fish varieties | |||
| Catfish | 83 | 86.5 | |
| Tilapia | 6 | 6.3 | |
| Common carp | 7 | 7.2 | |
| Total | 96 | 100 | Catfish |
| Method of land acquisition | |||
| Inheritance | 45 | 46.9 | |
| Purchase | 33 | 34.4 | |
| Rent or lease | 16 | 16.6 | |
| Gift | 2 | 2.1 | |
| Total | 96 | 100 | Inheritance |
| Source of fingerlings | |||
| Own farm | 26 | 27.1 | |
| Fish hatchery | 66 | 68.8 | |
| Government hatchery | 4 | 4.2 | |
| Total | 96 | 100 | Fish hatchery |
| Source of fish feed | |||
| Commercial feed | 74 | 77.1 | |
| Local feed | 20 | 20.7 | |
| Own feed | 2 | 2.1 | |
| Total | 96 | 100 | Commercial feed |
| Culture period | |||
| Three months | 16 | 16.7 | |
| Four months | 37 | 38.5 | |
| Six months | 36 | 37.5 | |
| Above 6 months | 7 | 7.3 | |
| Total | 96 | 100 | Four months |
| Harvesting/cropping time (per year) | |||
| Once | 4 | 4.2 | |
| Two times | 39 | 55.2 | |
| Three times | 53 | 40.6 | |
| Total | 96 | 100 | Three times |
| Cooperative society | |||
| Yes | 52 | 54.2 | |
| No | 44 | 45.8 | |
| Total | 96 | 100 | Yes |
| Processing of fish | |||
| Yes | 70 | 72.9 | |
| No | 26 | 27.1 | |
| Total | 96 | 100 | Yes |
| Source of power | |||
| Electricity | 49 | 51 | |
| Generator | 43 | 44.8 | |
| Solar power | 4 | 4.1 | |
| Total | 96 | 100 | Electricity |
| Cost of Fish (Kg) | |||
| N 500-800 | 15 | 15.6 | |
| N 800-100 | 14 | 14.6 | |
| N 1000-1500 | 67 | 69.8 | |
| Total | 96 | 100 | 1000-1500 |
| Training on fish farming | |||
| Yes | 54 | 43.8 | |
| No | 42 | 56.2 | |
| Total | 96 | 100 | No |
c) Contribution of Fish Farming to the Socio-Economic Status of the Respondents
The socio-economic status of farmers in this study was measured according to the scale developed by Ovwigho (2000) and adopted by Ayeloja et al. (2021). The socio-economic status of the fish farmers was measured in terms of the number of items possessed for continuous items and categorical items by assigning YES and NO to them respectively. The value of 0 and 1 was assigned for possession of items and non-possession of items that are continuous and categorical. The result of the analysis based on the possession and non-possession of items among the respondents in the study area showed that the socioeconomic status is high among the respondents with and low level of socio-economic status with among the respondents with the mean value of 34.17.
| Frequency | Percentage | Mean | Standard deviation | Min | Max | |
| High | 65 | 67.7 | 34.17 | 9.46 | 0.00 | 42.64 |
| Low | 31 | 32.3 |
Source:Field Survey,2023
d) Fish farmers Involvement in Farming Activities
Table 4 shows the involvement of fish farmers in fish farming activities; majority (70.8%) of the respondents always take part in spawning/breeding of fish while 26% of them are occasionally involved. Majority of the farmers were always involved in the sorting (62.5%), procurement of fish feeds (75%), treatment of water (60.4%), feeding of fish (63.5%) and changing of water. On the other hand, respondents were occasionally involved in harvesting of fish (53.1%), removal of water (58.3%), checking of water temperature (54.2%). This is attributed to the fact that the respondents participated in most of the farming activities and only used paid labour for some of the farm activities. This is in comparison with the finding of Olaoye et al. (2021).
| Variable | Never | Occasionally | Always | Mean |
| Spawning | 3 (3.1) | 25(26) | 68(70.8) | 1.229 |
| Sorting | 3(3.1) | 33(34.4) | 60(62.5) | 1.31 |
| Procurement of Feed | 6(6.3) | 18(18.8) | 72(75) | 1.58 |
| Stocking | - | 48(50) | 48(50) | 1.50 |
| Treatment of water | 5(5.2) | 33(34.4) | 58(60.4) | 1.29 |
| Checking of Temperature | 9(9.4) | 52(54.2) | 35(36.5) | 1.44 |
| Feeding of fish | 2(2.1) | 33(34.4) | 61(63.5) | 1.32 |
| Diseases Control | 6(6.3) | 52(54.2) | 38(39.6) | 1.47 |
| Removal of waste matter | - | 56(58.3) | 40(41.7) | 1.58 |
| Harvesting of Fish | - | 51(53.1) | 45(46.9) | 1.53 |
| Changing of Water | - | 20(20.8) | 76(79.2) | 1.20 |
Source:Field Survey,2023
e) Benefits Fish Farmers Derived from Fish Farming
Table 5 showed that the majority of the respondents with the mean value of 1.04, 1.11, 1.36, 1.18, 1.39, 1.31, 1.11, 1.14 and 1.15, benefitted highly from fish farming in terms of Improve protein intake, provision of income, knowledge of fish farming, source of employment, increased food security, improvement in materials possession, alternative income source, improvement in social life and improvement in health status while the mean value of 1.17 shows that they slightly used fish farming as a collateral for loan. The observation from this supports the fact that fish farming brings an improvement in the socio-economic status of the respondents in the study area. This finding is in line with Ayeloja et al. (2021) and Engle (2008) who reported an improvement in the socioeconomic status of farmers in line with the benefits they derive from fish farming.
| Variables | High | Slight | Not a benefit | Mean |
| Improve protein in-take | 90(93.8) | 5(5.2) | 1(1.0) | 1.04 |
| Provide income | 85(88.5) | 11(11.5) | - | 1.11 |
| Improve Knowledge of fish farming | 61(63.5) | 35(36.5) | - | 1.36 |
| Serves as source of employment | 72(75) | 21(21.9) | 3(3.1) | 1.18 |
| Food Security increase Use as Collateral for credit | 50(52.1) | 42(43.8) | 4(4.2) | 1.39 |
| Improve materials | 29(30.2) | 42(43.8) | 25(26) | 1.17 |
| possession | 56(58.3) | 35(36.5) | 5(5.2) | 1.31 |
| Improve health status | 71(74) | 14(14.6) | 10(10.4) | 1.15 |
| Improves social Life | 37(38.5) | 36(37.5) | 23(24) | 1.14 |
| Alternative income source | 73(76) | 17(17.7) | 6(6.3) | 1.11 |
Source:Field Survey,2023
f) Constraints to Fish Farming
Factors affecting aquaculture production in the region were presented in table 6 in the form of major, minor and not a constraint. Losses at farm also arises from predators such as snakes, monitor lizards, birds and improper harvesting, post-harvest and processing techniques, inefficient marketing due to lack of farmers' investment in marketing activities, which might reduce the revenue generated by farmers along the fish value chain (Agbebi and Fagbenro, 2006).
Nkwocha and Nkwocha(2013)noted that feed type, availability, and high price are major obstacles to intensive aquaculture profitability in Nigeria. Majority
(47.9%) of the respondents perceived that lack of access to credit as a major constraint. Also land acquisition (71.9%), high price of conventional feed (75%) and poor extension services (47.9%) were also a major problem faced by the respondents. In the same vein theft (59.4%), unavailability of fingerlings (52.1%), inadequate water supply (60.4%), disease outbreak (82.3) and mortality of fish (74.0%) were minor problems encountered by farmers. The problems faced by farmers in this study is in accordance with the problems identified by Ajayi (2013), Ume et al. (2016) and Ayeloja et al. (2021) but disagrees with that of Olaoye et al. (2013).
| Variables | Major | minor | Not a constraint | Mean |
| Lack of access to credit facility | 46(47.9) | 35(36.5) | 15(15.6) | 1.20 |
| Poor extension services | 42(47.9) | 40(41.7) | 10(10.4) | 1.32 |
| Theft | 16(16.7) | 57(59.4) | 23(24.0) | 1.35 |
| Pollution of water sources | \24(25.0) | 57(59.4) | 15(15.6) | 1.43 |
| Land acquisition | 69(71.9) | 19(19.8) | 8(8.3) | 1.11 |
| High price of conventional feed | 72(75.0) | 20(20.8) | 4(4.2) | 1.26 |
| Unavailability of fingerlings | 35(36.5) | 50(52.1) | 11(11.5) | 1.40 |
| Inadequate water supply | 33(34.3) | 58(60.4) | 5(5.2) | 1.55 |
| Disease attack | 9(9.4) | 79(82.3) | 8(8.3) | 1.73 |
| Mortality of fish | 18(18.8) | 71(74.0) | 7(7.3) | 1.66 |
g) Result of Correlation Analysis of the Benefits Respondents Derived from Fish Farming and their Socio-Economic Status
The result of the analysis in Table 7 shows that there is a significant relationship between the benefits respondents derived from fish farming and their socioeconomic status ( ; ). It implies that the benefits the respondents gained in ventures into the fish farming business led to an improvement in their socioeconomic status. This finding corroborates the finding of Ayeloja et al. (2021) who opined that the increase in the socio-economic status of the farmers in Oyo state is as a result of the benefit they gained from fish farming.
| Variables | R-value | p-value | Decision |
| Benefit derived | 0.073 | 0.025 | Significant |
h) Result of Correlation Analysis of the Respondents' Constraints to Fish Farming and their Socio-Economic Status
- The result of the analysis in Table 8 shows that there is a significant relationship between the respondents' constraints to fish farming and their socio-
| status Variables | R-value | p-value | Decision |
| Benefit derived | 0.239 | 0.007 | Significant |
Source:Field Survey,2023
IV. CONCLUSION AND RECOMMENDATION
Based on the finding from this study, it can be concluded that fish farming in Ebonyi state is in its developmental stage and is largely on a small scale. The farmers are in their productive age, however, majority of them were male and most of the respondents had 4-6 persons in their family. Farmers attained high level of education giving them edge to understand the strategies involved in the business. The major variety of the fish reared by the farmers was catfish which provides an alternative source of income to them. The contribution of fish farming to the socio-economic status of fish farmers was high, however, the major problem faced by the farmers was lack of access to credit facilities and high price of conventional feeds. There was a significant relationship between the benefit farmers derive from fish farming and socio-economic status. Based on the findings obtained from this study, we recommend;
- The government should establish fish feed production plant and organize seminar/workshop programme for fish farmers to trained them on the formulation of fish feeds so as to reduce cost of procurement and increase their profit.
- Extension officers should be trained more on the economic dimension of fish farming and not only the technical aspects which will be delivered to fish farmers to enable them understand the economic aspect of their farm thereby leading to efficient use of resources/farm inputs.
- The government should establish hatchery to provide fingerlings to the farmers.
- The government should also make available credit facilities to farmers.