The aim of this study is to analyze the determinants of terrorism for a developing country, Tunisia, strongly affected by such dynamics. Our empirical study is based on an estimate using the ARDL model on annual data for the period 1987 to 2019. The results have revealed that there is a short and long term relationship between various social and economic variables and terrorism. These findings have important policy implications for economic agents, politicians as well as for policy makers. Indeed, our work helps to identify the socio-economic determinants of terrorism. In addition, our analysis can serve as a dashboard for policymakers to analyze the short and long term effects of various social and economic variables on terrorism.
## I. INTRODUCTION
The emergence of terrorism is linked to economic and demographic conditions (Clements et al, 2021; Khusrav and Sandler, 2019; Krieger and Meierrieks, 2019; Polyxeni and Theodore, 2019; Aisha and Shehla, 2014) and that there are serious disruptions in social values and morals of society (Aisha & Shehla, 2014; Ismail and Amjad, 2014).
The most threatening factors are poverty and inequality (Raja and Raghu, 2020; Krieger and Meierrieks, 2019; EzCURA and Palacios, 2019; Bandvopadhyay and Younes, 2011; Salvatore, 2007), especially in the least developed countries. Economic factors are more important for terrorism than political factors (Mohamed et al 2019; Aisha and Shehla, 2014; Wade and Reiter, 2007). GDP per capita (Mohamed et al 2019; Estrada et al, 2018; Shahbaz, et al, 2013; Freytag et al., 2010;) unemployment (Aniruddha and Jomon, 2018; Malik and Zaman, 2013; Abadie, 2006) illiteracy rate (Sarwar et al, 2020; Estrada et al, 2015).
Terrorists target everyone (Ali and Haider, 2020; Aisha and Shehla, 2014; Abadie, 2006) which causes enormous victims and economic costs (Ali and Haider, 2020; Aisha and Shehla, 2014; Ali, 2010). In particular, since the turn of the century, many democracies in developed countries have shown high levels of terrorist episodes 9/11 in New York[^1] $(2001)^{1}$, attacks in Madrid
(2004), London (2005), Brussels, Paris and Berlin. (2016), Sweden, Paris, London (2017). France, Australia (2018), France, United States (2019), France, United Kingdom (2020).
Recently, after the Arab Spring, an unprecedented wave of political violence and terrorist events occurred in several countries in the MENA region such as Tunisia. Tunisia is strongly affected by such dynamics, hence terrorist actions intimidate law and public order and human rights by destroying essential infrastructure and economic prospects. (Lanouar and Goaied, 2019).
This paper attempts to analyze the determinants of terrorism in Tunisia. The aim of our study is to analyze the short and long term effects of various social and economic variables on terrorism. More specifically, we seek to fill the gap in the literature concerning the relationship between the Terrorism Index which measures the number of annual attacks and social and economic variables in Tunisia. The Growth Rate, The Political Stability Index, The Unemployment Rate, Vulnerable Jobs, Poverty, Foreign Direct Investments, The Trade Balance, Inflation, The Consumption Level, Military Spending, And the Rate presidential rotation of Tunisia. To our knowledge, our study is the first to integrate all these economic and social variables to identify the determinants of terrorism in developing countries.
The rest of this article is organized as follows. In section 2 we analyze the evolution of terrorist attacks and its main determinants in Tunisia pre, post and during the Arab Spring. In Section 3 we introduce the data to empirically study the determinants of terrorism which is based on annual data for the period from 1987 to 2019. Our main empirical results are presented in Section 4. In Section 5 we describe some policy implications of our results.
## II. DETERMINANT OF TERRORISM
Several research studies have linked terrorism to many socio-economic and political variables, namely low GDP, emergence of poverty, high unemployment rate, inflation, political stability, investment, consumption, vulnerable job, trade, military spending and the turnover rate of governors and presidents. The results found indicate that GDP is a powerful predictor of terrorism (Blomberg et al., 2004; Fearon and Laitin, 2003; Burgoon, 2006; Freytag et al., 2010; Lai, 2007; Li and Schaub, 2004). Regarding poverty, we find that the most popular theory is that poverty causes terrorism. When people are deprived of certain resources and opportunities, poverty can cause some to turn to terrorism to express outrage (Burgoon, 2006; Friedman, 2002a; Fearon and Laitin, 2003). When it comes to unemployment, it can lead to more terrorism following grief (Abadie, 2006; Goldstein, 2006; Berman et al., 2008; Harrison, 2006; Johnston, 2001; Kalyvas, 2006; Hudson et al., 2002; Oppenheim, 2007). In addition, an increase in inflation leads to an increase in the number of terrorist attacks (Auvinen, 1997; Feldmann and Perala, 2004; Caruso and Schneider, 2011; Nicole, 2003; Samaranayake, 1999; Piazza, 2006). Several socioeconomic factors stimulate violence and terrorism. For example, it has been studied that policies trigger terrorist incidents in developing countries. In addition, regional violence makes regions more vulnerable. And that's why we used political stability, military spending, the presidential turnover rate and vulnerable jobs as explanatory variables in the model (Ajide KB, et al., 2020; Kirisci M, 2020; Morris NA, et al., 2020).
Several opinions regarding the effect of a change in GDP growth on terrorism. We find that, Li and Schaub (2004) and Collier and Hoeffler (2004) studied the relationship between GDP per capita and terrorism and found that the link is negative because increasing GDP improves the economic situation of individuals and therefore reduces the cost of opportunity of terrorism.
Several other studies examining the link between growth and terrorism have found similar results (Blomberg and Hess, 2008; Bravo and Dias, 2006; Campos and Gassebner, 2008; Dreher and Fischer, 2010; Lai, 2007; Muller and Weede, 1990).
The model in which poverty is linked to political violence is Gurr (1970). According to (Stern, 2003; Miguel et al., 2004; Aziz, 2009; Krieger and Meierrieks, 2011; Schneider et al., 2010; Bandyopadhyay et al., 2013; Berman et al., 2009), the relationship between poverty and the emergence of terrorism is positive and direct. Krueger and Maleckova (2003) analyzed the link between terrorism and poverty and found that they were not linked in developed countries. In addition Abadie (2006), Kurrild-Klitgaard et al. (2006), Gassebner and Luechinger (2011) and Piazza (2011) found no significant link between poverty and terrorism.
Regarding unemployment, Sayre (2009) has shown that there is a direct relationship between unemployment and terrorism. In addition, Catalano et al. (1997) found that unemployment causes terrorism (Abadie, 2006; Berman et al., 2008; Berman et al., 2009; Harrison, 2006; Honaker, 2010; Kalyvas, 2006; Oppenheim, 2007). The results also revealed that terrorism is unrelated to a city's unemployment rate. According to Thompson (1989), unemployment does not fuel terrorism (Green et al., 1998). Oyefusi (2010) found that a high unemployment rate increases the willingness of unemployed people to join terrorist groups. Thus, the link between unemployment and terrorism is insignificant as long as education is not taken into account (Krueger and Maleckova, 2003).
The relationship between inflation and terrorism has been discovered as significant by several researchers (Auvinen, 1997; Caruso and Schneider, 2011; Feldmann and Perala, 2004; Nicole, 2003; and Samaranayake, 1999). High inflation has destabilizing impacts on the economy and is responsible for terrorism. Terrorism is a political phenomenon (Choi, 2010; Dreher et Gassebner, 2008; Hacker, 1976; Kis-Katos et al., 2011; Krueger and Maleckova, 2003; Savun and Phillips, 2009). Lai (2007) and Basuchoudhary and Shughart (2010) found that higher levels of economic freedom reduce the emergence of terrorism.
So we can see that socio-economic factors have an impact on terrorism. Inflation refers to the country's general prices within the country, which acts as a proxy for the purchasing power of consumers to meet their demands and maximize their utilities. Several researchers have analyzed the price fluctuation of general goods, as well as household consumption to see their impacts on terrorism (Piazza, JA. 2011 and Ross, JI. 1993). Because of inflation and consumer dissatisfaction, people find it difficult to live in these conditions. Based on the existing literature above, the proposed hypotheses are:
H1: Inflation increases number of terrorist attacks in Tunisia
H2: GDP defeating terrorism in Tunisia
This is further proof that poverty has a significant impact on terrorism (Piazza JA. 2013). Political instability, unemployment, poverty and vulnerable jobs also create groups of frustrated people, which gives the opportunity for these terrorist activities (Helfstein S. 2019). So, Based on the study of the above literature proposed the following hypothesis:
H3: The deterioration of the economic and political situation in Tunisia favors terrorism
## III. TERRORISM IN TUNISIA
Tunisia faces threats from terrorism that are breaking down and destroying the economy through various channels (Lanouar and Goaied, 2019). According to a recent study by the Tunisian Center for Research and Studies on Terrorism: CTRET (2019) "the influencing factors and four main elements, namely: People, Mosques, Internet and social networks, books and written literature" Terrorist movements have given people (generally imams and former terrorist leaders) a central role in the dissemination of their terrorist thought and in the recruitment of young people (18 to 34) especially with the weakening of the state in post
revolution: high inflation rates, unemployment, low GDP per capita, poverty, inequalities, etc.
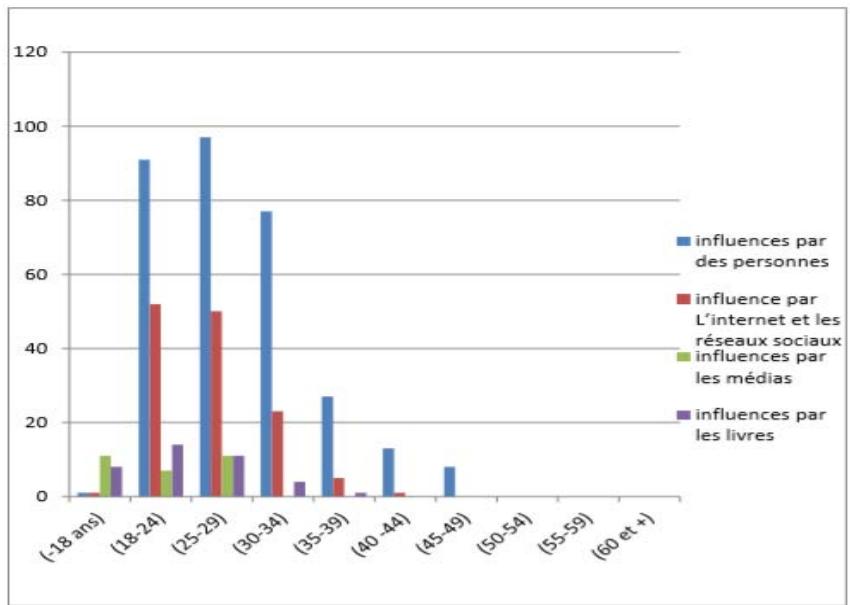 Source: Tunisian Center for Research and Studies on Terrorism (2019) Graph 1: Influencing Factors by Age Group
Terrorism has increased moderately over time (Table 1) causing an economic recession and imposing heavy economic penalties on the economy. However, effective action to fight terrorism by determining socioeconomic factors can generate significant benefits for the Tunisian economy, preventing losses resulting from reduced trade and tourism flows of FDI that generate long-term economic growth.
Table 1: Evolution of Terrorist Attacks and its Main Determinants in Tunisia before, after and during the Revolution
<table><tr><td>Date</td><td>Terrorist Attacks</td><td>Military Spending</td><td>Political Stability</td><td>Presidential Rotation Rate</td><td>Vulnerable Jobs</td><td>Consumption</td><td>Trade Balance</td></tr><tr><td>1987</td><td>4</td><td>6.9</td><td>-0.1</td><td>0.04</td><td>28.7</td><td>60.56</td><td>-738.3</td></tr><tr><td>1991</td><td>2</td><td>6.33</td><td>0.06</td><td>0.04</td><td>27.8</td><td>62.4</td><td>-1371.8</td></tr><tr><td>2011</td><td>3</td><td>5.33</td><td>-0.85</td><td>0.6</td><td>21.62</td><td>65.61</td><td>-8603.5</td></tr><tr><td>2012</td><td>1</td><td>5.08</td><td>0.96</td><td>0.6</td><td>20.74</td><td>66.42</td><td>-11630.3</td></tr><tr><td>2017</td><td>4</td><td>7.07</td><td>-0.82</td><td>0.6</td><td>20.08</td><td>70.37</td><td>-15595</td></tr><tr><td>2018</td><td>19</td><td>6.68</td><td>-0.8</td><td>0.6</td><td>19.96</td><td>70.3</td><td>-19022.9</td></tr><tr><td>2019</td><td>3</td><td>7.89</td><td>-0.8</td><td>0.6</td><td>19.83</td><td></td><td>-19436.2</td></tr></table>
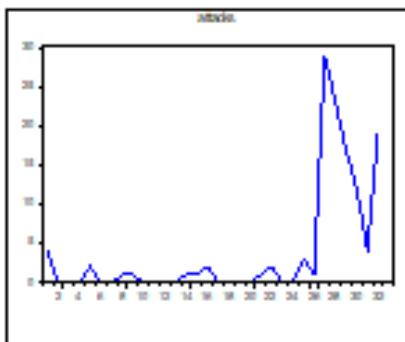
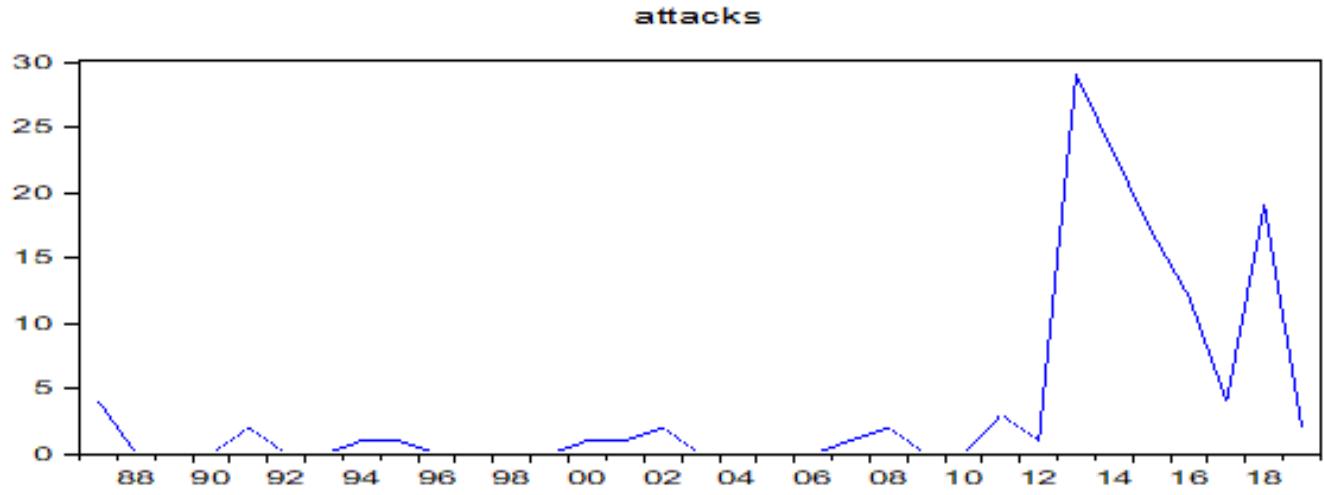 Graph 2: Number of Terrorist Attacks in Tunisia
## IV. DESCRIPTION OF VARIABLES AND ESTIMATION METHOD
### a) Definition of Variables and Data Source
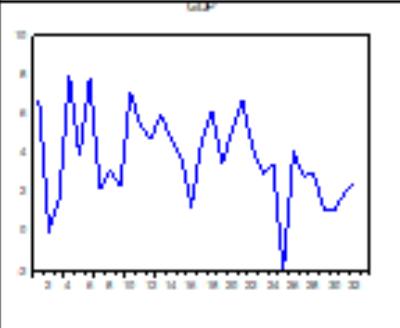
The empirical work is based on annual data for the period from 1987 to 2019. The terrorism index (ATTACKS) is accessible from the Global Terrorism (GTD) database, this index measures the number of annual attacks. The growth rate (GDP) is accessible from the World Development Index (WDI) database, it is used as a proxy for economic growth. The Political Stability Index (SP) is accessible from the Trading Economics database. The unemployment rate (UMPL) is taken from the database of the World Bank and the
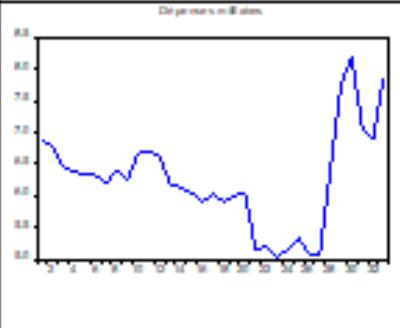
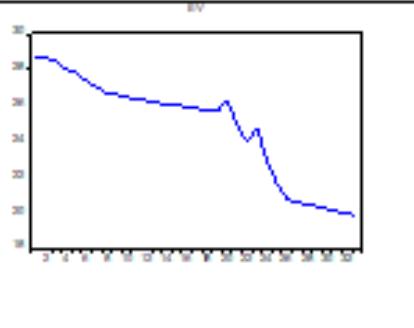
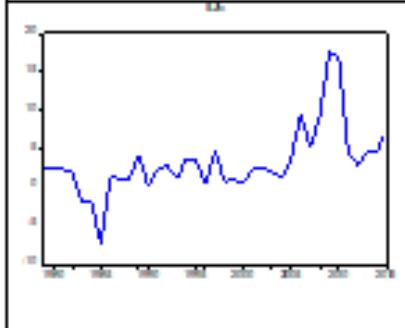
Tunisian National Statistics Institute (INS). Poverty (POV) is accessible from the World Development Index (WDI) database, missing values are calculated by the authors through linear interpolation. Foreign direct investments (FDI), the trade balance (BC), inflation (INFL) and the level of consumption (CONS) are extracted from the database of the Central Bank of Tunisia (BCT). Tunisia's Presidential Rotation Rate (TRP) is calculated by the author. Finally military expenditure (DM) and vulnerable jobs (EV) is extracted from the database of the World Bank (WDI). Table 2 provides a summary of the different variables used.
Table 2: Summary of the Variables used and Data Sources
<table><tr><th>Category</th><th>Variables</th><th>Variables Description</th><th>Sources</th></tr><tr><td>Dependent</td><td>ATTACKS</td><td>All acts of violence committed by an organization or an individual to create a climate of insecurity or to blackmail a government.</td><td>Global Terrorism (GTD)</td></tr><tr><td>Independent</td><td>GDP</td><td>The growth of a country's economy from year to year.</td><td>World Development Indicators, World Bank (WDI).</td></tr><tr><td>Independent</td><td>SP</td><td>Political stability: depends on its ability to avoid crises and to maintain standards without major changes</td><td>Trading Economics</td></tr><tr><td>Independent</td><td>UMPL</td><td>This is the percentage of people in the labor force who are unemployed.</td><td>The Tunisian National Institute of Statistics</td></tr><tr><td>Independent</td><td>POV</td><td>Refers to the situation of a person who is unable to access food.</td><td>World Development Indicators (WDI)</td></tr><tr><td>Independent</td><td>IDE</td><td>International movements of capital carried out to create, develop or maintain a subsidiary abroad or to exercise control or significant influence over the management of a foreign company.</td><td>Central Bank of Tunisia (BCT).</td></tr><tr><td>Independent</td><td>BC</td><td>This is the difference, in terms of monetary value, between exports and imports of goods or goods and services in an economy over a period of time.</td><td>Central Bank of Tunisia (BCT).</td></tr><tr><td>Independent</td><td>INFL</td><td>It is the loss of the purchasing power of money which results in a general and lasting increase in prices.</td><td>Central Bank of Tunisia (BCT).</td></tr><tr><td>Independent</td><td>CONS</td><td>It characterizes the act of an economic agent who uses or transforms goods and services.</td><td>Central Bank of Tunisia (BCT).</td></tr><tr><td>Independent</td><td>TRP</td><td>The turnover rate is equal to the sum of presidents during a period divided by the number of years in that period.</td><td>Calculated by the author.</td></tr><tr><td>Independent</td><td>EV</td><td>workers more likely to be injured on the job.</td><td>World Development Indicators (WDI).</td></tr><tr><td>Independent</td><td>DM</td><td>This is the defense budget in Tunisia</td><td>World Development Indicators, (WDI).</td></tr></table>
### b) Econometric Method
The methodology used in this study is based on an estimate using the ARDL model (Auto Regressive Distributed Lags), which allows to analyze both the short-term and long-term relationship between terrorism and its determinants with variables both order (0) and order (1) integrated. The existence of a cointegrating relationship between the variables of an econometric model is tested via several tests. However, the staged delay cointegration test proposed by Pesaran et al (1999, 2001) is increasingly used in recent studies. This choice is due to the fact that this technique has the advantage of being more efficient for studies with a small sample size and applies to series that are integrated at order 1, at level 0 or mutually integrated, unlike the series. Traditional cointegration tests such as those of Engle Granger (1987), the Johansen test (1988), the Johansen and Juselius test (1990).
In fact, this model only applies when the order of integration of the series does not exceed 1. This method has another advantage that the estimation of long and short term dynamics (Akpan et al, 2012). The ARDL model which shows the relationship between terrorism and socio-economic variables will be represented by equation (1):
$$
\Delta (ATTACKS)_{t} = \alpha_{0} + \sum_{i=0}^{p} \alpha_{1i} \Delta ATTACKS_{t-i} + \sum_{i=0}^{q} \alpha_{2i} \Delta U MPL_{t-i} + \sum_{i=0}^{q} \alpha_{3i} \Delta S P_{t-i} + \sum_{i=0}^{q} \alpha_{4i} \Delta B C_{t-i} + \sum_{i=0}^{q} \alpha_{5i} \Delta I D E_{t-i} + \sum_{i=0}^{q} \alpha_{6i} \Delta P O V_{t-i} + \sum_{i=0}^{q} \alpha_{7i} \Delta G D P_{t-i} + \sum_{i=0}^{q} \alpha_{8i} \Delta T R P_{t-i} + \sum_{i=0}^{q} \alpha_{9i} \Delta I N F L_{t-i} + \sum_{i=0}^{q} \alpha_{10i} \Delta C O N S_{t-i} + \sum_{i=0}^{q} \alpha_{11i} \Delta D M_{t-i} + \sum_{i=0}^{q} \alpha_{12i} \Delta E V_{t-i} + \beta_{1} ATTACKS_{t-1} + \beta_{2} U MPL_{t-1} + \beta_{3} S P_{t-1} + \beta_{4} B C_{t-1} + \beta_{5} I D E_{t-1} + \beta_{6} P O V_{t-1} + \beta_{7} G D P_{t-1} + \beta_{8} T R P_{t-1} + \beta_{9} I N F L_{t-1} + \beta_{10} C O N S_{t-1} + \beta_{11} D M_{t-1} + \beta_{12} E V_{t-1} + \varepsilon_{t}
$$
The use of the variable to be explained in the preceding equation at its long-term equilibrium level may not be immediately after a change in one of its determining fundamentals. Hence, the speed of adjustment between the short and the long term of the dependent variables can be taken by estimating the following error correction model:
$$
\begin{array}{l} \Delta (A T T A C K S) _ {t} = \alpha_ {0} + \sum_ {i = 0} ^ {p} \alpha_ {1 i} \Delta A T T A C K S _ {t - i} + \sum_ {i = 0} ^ {q} \alpha_ {2 i} \Delta U M P L _ {t - i} + \sum_ {i = 0} ^ {q} \alpha_ {3 i} \Delta S P _ {t - i} + \sum_ {i = 0} ^ {q} \alpha_ {4 i} \Delta B C _ {t - i} + \sum_ {i = 0} ^ {q} \alpha_ {5 i} \Delta I D E _ {t - i} \\+ \sum_ {i = 0} ^ {q} \alpha_ {6 i} \Delta P O V _ {t - i} + \sum_ {i = 0} ^ {q} \alpha_ {7 i} \Delta G D P _ {t - i} + \sum_ {i = 0} ^ {q} \alpha_ {8 i} \Delta T R P _ {t - i} + \sum_ {i = 0} ^ {q} \alpha_ {9 i} \Delta I N F L _ {t - i} + \sum_ {i = 0} ^ {q} \alpha_ {1 0 i} \Delta C O N S _ {t - i} + \sum_ {i = 0} ^ {q} \alpha_ {1 1 i} \Delta D M _ {t - i} + \\\sum_ {i = 0} ^ {q} \alpha_ {1 2 i} \Delta E V _ {t - i} + \theta \mu_ {t - 1} + \varepsilon_ {t} \\\end{array}
$$
Where $\Delta$ represents the first difference operator, $\mu_{t-1}$ represents the error correction term (ECT) of our model. The (ECT) in the equation measures the speed of the adjustment of the imbalance between the short and the long term of the dependent variable. We expect that the (ECT) will have a negative and significant sign (Gujarati DN. 2003).
In order to verify that there is a cointegration relationship, we must first establish the order of integration of each variable. Thus, we will use the Dickey Fuller test (ADF), the Phillips-Perron test (PP) and the structural break test (Break point test) which are popular unit root tests generally used to test and verify the order of integration of the series. These tests are carried out with different specifications to verify if the series is stationary at the level or in difference. The latter have a null hypothesis of non-stationarity against an alternative of stationarity. Next, we need to verify the existence of a cointegration relation, however we will use the terminal cointegration test. This test is based primarily on the Wald statistic F whose null hypothesis means the absence of a cointegrating relationship. The Bounds test consists in a first step in estimating the model (1) by the least ordinary squares (OLS). Then to test the joint nullity of the long-term multipliers and using the F-test. So we present the following two considered hypotheses:
$$
HO: \alpha 1 = \alpha 2 = \alpha 3 = \alpha 4 = \alpha 5 = \alpha 6 = \alpha 7 = \alpha 8 = \alpha 9 = \alpha 10 = \alpha 11 = \alpha 12 = 0
$$
Against the alternative hypothesis
$$
\begin{array}{l} H 1: \alpha 1 \neq \alpha 2 \neq \alpha 3 \neq \alpha 4 \neq \alpha 5 \neq \alpha 6 \neq \alpha 7 \neq \alpha 8 \neq \alpha 9 \neq \\\alpha 1 0 \neq \alpha 1 1 \neq \alpha 1 2 \neq 0. \end{array}
$$
Finally, the last step is to compare the calculated F statistic with the critical value. In fact, Pesaran et al. (2001) chose 2 critical values for a given significance level. The first value is calculated when all variables are integrated of order zero, while the second value is calculated when all variables are integrated of order. If the calculated statistical $F$ is greater than the upper critical limits, cointegration is confirmed, indicating the existence of a cointegration relationship. If the calculated $F$ is less than the lower critical values, we can confirm cointegration. And if the calculated $F$ statistic falls between the limits, we need to know the order of integration of the underlying regressors. Cointegration equations are used, once estimated, to calculate long-run elasticity. If the cointegration relationship is not detected, then the short-term causal relationship is measured. After having specified our modeling, the general approach will be followed by a number of specification tests, in particular: (i) the normality of the residue (test of normality of Jarque-Bera); (ii) Series correlation (Breusch-Godfrey LM test); (iii) Heteroscedasticity (ARCH test); and (iv) the specification of the model (specification of the Ramsey test regression error - RESET). These steps are continued by the square CUSUM and CUSUM test to analyze the stability of the model. The results are discussed and presented in the next section.
## V. RESULTS
We will present a descriptive study before analyzing these variables using the ARDL approach, of annual data that covers the period from 1987 to 2019.
Table 3: Descriptive Statistics of the Study Data
<table><tr><td></td><td>S</td><td>BC</td><td>CONS</td><td>DM</td><td>EV</td><td>GDP</td><td>POV</td><td>IDE</td><td>INFL</td><td>SP</td><td>TPR</td><td>UNEM</td></tr><tr><td>Mean</td><td>3.84</td><td>-4972.4</td><td>63.55</td><td>6.21</td><td>24.90</td><td>3.778</td><td>37.67</td><td>2.51</td><td>4.64</td><td>-0.14</td><td>0.21</td><td>14.98</td></tr><tr><td>Median</td><td>1.00</td><td>-3714.75</td><td>62.08</td><td>6.23</td><td>25.97</td><td>3.66</td><td>40.25</td><td>2.18</td><td>4.43</td><td>0.055</td><td>0.04</td><td>15.26</td></tr><tr><td>Maximum</td><td>29.0</td><td>12620.5</td><td>70.53</td><td>8.18</td><td>28.72</td><td>7.95</td><td>43.4</td><td>9.42</td><td>8.23</td><td>0.96</td><td>0.70</td><td>18.33</td></tr><tr><td>Minimum</td><td>0.000</td><td>-19022.9</td><td>60.56</td><td>5.029</td><td>19.96</td><td>-1.92</td><td>4.0350</td><td>0.6</td><td>1.98</td><td>-1.14</td><td>0.04</td><td>12.37</td></tr><tr><td>Std. Dev.</td><td>7.51</td><td>5665.6</td><td>3.25</td><td>0.75</td><td>2.85</td><td>2.30</td><td>6.93</td><td>1.72</td><td>1.77</td><td>0.52</td><td>0.29</td><td>1.34</td></tr><tr><td>Skewness</td><td>2.18</td><td>0.03</td><td>1.27</td><td>0.37</td><td>-0.63</td><td>-0.14</td><td>-3.70</td><td>2.17</td><td>0.57</td><td>-0.45</td><td>1.15</td><td>-0.14</td></tr><tr><td>Kurtosis</td><td>6.54</td><td>5.22</td><td>3.07</td><td>3.33</td><td>2.01</td><td>2.79</td><td>18.64</td><td>9.38</td><td>2.36</td><td>2.35</td><td>2.33</td><td>3.48</td></tr><tr><td>Jarque-Bera</td><td>42.09</td><td>6.56</td><td>8.56</td><td>0.86</td><td>3.39</td><td>0.16</td><td>398.65</td><td>79.45</td><td>2.26</td><td>1.68</td><td>7.70</td><td>0.41</td></tr><tr><td>Probability</td><td>0.000</td><td>0.03</td><td>0.01</td><td>0.64</td><td>0.18</td><td>0.92</td><td>0.000</td><td>0.000</td><td>0.32</td><td>0.43</td><td>0.02</td><td>0.81</td></tr><tr><td>Sum</td><td>123</td><td>-159115</td><td>2033.6</td><td>198.55</td><td>796.61</td><td>121.05</td><td>1205.5</td><td>80.446</td><td>148.46</td><td>-4.57</td><td>6.56</td><td>479.42</td></tr><tr><td>Sum Sq. Dev.</td><td>1750.2</td><td>9.95</td><td>326.89</td><td>17.49</td><td>252.80</td><td>163.78</td><td>1487</td><td>91.61</td><td>97.13</td><td>8.23</td><td>2.61</td><td>56.44</td></tr><tr><td>Observations</td><td>32</td><td>32</td><td>32</td><td>32</td><td>32</td><td>32</td><td>32</td><td>32</td><td>32</td><td>32</td><td>32</td><td>32</td></tr></table>
According to this table we can note that the average level of terrorist attacks was 3.84. This shows that the average values of terrorist incidences and losses are very high. An increasing number of incidents and victims is responsible for the loss not only of human life, but also hinders the process of growth. Likewise, the average values of inflation, poverty, military spending and unemployment are above the minimum desirable level. Likewise, the average value of political stability, GDP, vulnerable jobs and net inflows of foreign direct investment are very low. So overall, Tunisia's conditions are not up to par. Before analyzing these variables using the ARDL approach proposed by Pesaran et al 2001, we used unit root tests to assess the order of integration of the variables. The results presented in Table 4 show that all the variables are integrated of order 1 I (1) with the exception of three variables IDE, GDP and EV which are stationary at level I (0). These results confirm that all the variables have an order of integration less than 2.
Table 4: Stationarity Test
<table><tr><td>Variables</td><td colspan="2">ADF Test</td><td colspan="2">PP Test</td><td colspan="2">Breakpoint Test</td></tr><tr><td></td><td>In level</td><td>First difference</td><td>In level</td><td>First difference</td><td>In level</td><td>First difference</td></tr><tr><td>ATTACK</td><td>-2.080226[0.2535]</td><td>-5.323000**[0.0002]</td><td>-2.080226[0.2535]</td><td>-9.364006**[0.000]</td><td>-20.41911(2012)</td><td>-11.68005** (2012)</td></tr><tr><td>UMPL</td><td>-2.353594[0.1626]</td><td>-5.471741**[0.0001]</td><td>-2.439659[0.1397]</td><td>-5.872020**[0.000]</td><td>-3.344265(2013)</td><td>-10.02893** (2011)</td></tr><tr><td>SP</td><td>-2.920575[0.0540]</td><td>-6.404084**[0.000]</td><td>-2.878396[0.0591]</td><td>-16.67718**[0.0001]</td><td>-6.127244(2008)</td><td>-8.654684** (1997)</td></tr><tr><td>BC</td><td>-1.510119[0.5144]</td><td>-3.467854**[0.0171]</td><td>-3.791022**[0.0073]</td><td>-16.50879**[0.0001]</td><td>-5.564238** (2008)</td><td>-14.00927(2005)</td></tr><tr><td>IDE</td><td>-4.07182**[0.0036]</td><td>-9.449640**[0.000]</td><td>-4.096156**[0.0034]</td><td>-16.55148**[0.0001]</td><td>-4.580455** (1991)</td><td>-9.477037** (1933)</td></tr><tr><td>POV</td><td>-1.394570[0.9985]</td><td>-4.392025**[0.0016]</td><td>1.211274[0.9974]</td><td>-4.392025**[0.0016]</td><td>-0.956485(2008)</td><td>-5.464094** (2015)</td></tr><tr><td>GDP</td><td>-5.09782**[0.0002]</td><td>-9.591610**[0.000]</td><td>-5.111702**[0.0002]</td><td>-21.68017**[0.0001]</td><td>-6.602825** (2011)</td><td>-9.680050** (1996)</td></tr><tr><td>TRP</td><td>0.111962[0.7111]</td><td>-5.477226**[0.000]</td><td>-0.111962[0.7111]</td><td>-5.477226**[0.000]</td><td>-2.80(2010)</td><td>-5.891883** (2010)</td></tr><tr><td>INFL</td><td>-0.728960[0.3923]</td><td>-7.940987**[0.000]</td><td>-0.897691[0.3194]</td><td>-8.011709**[0.000]</td><td>-3.511857(1991)</td><td>-8838506** (1993)</td></tr><tr><td>CONS</td><td>1.572052[0.9687]</td><td>-5.177903**[0.000]</td><td>1.572052[0.9687]</td><td>-5.192801**[0.000]</td><td>-5.255675(2010)</td><td>-6.408153** (2009)</td></tr><tr><td>DM</td><td>0.513812[0.8209]</td><td>-4.942649**[0.000]</td><td>0.241283[0.7498]</td><td>-3.350389**[0.0015]</td><td>-3.965735(2006)</td><td>-6.865465** (2014)</td></tr><tr><td>EV</td><td>-3.07414**[0.0032]</td><td>-4.223482**[0.0001]</td><td>-2.892546**[0.0052]</td><td>-4.425925**[0.0001]</td><td>-3.548696** (2006)</td><td>-6.155067** (2006)</td></tr></table>
SC is used to choose the number of optimal delays for the ADF tests, whereas « Bandwidth » is used for PP tests. The critical values related to ADF and PP tests were provided by MacKinnon (1996). The bracketed figures represent the delay levels based on the information criterion of Schwarz. Figures between square brackets represent Newey-West bandwidth's automatic selection using the Bartlett kernel. Note that
Only the constant is included in tests.$(^{**})$,$(^{*})$and$(^*)$denote statistical significance at the$1\%$,$5\%$and$10\%$levels respectively.
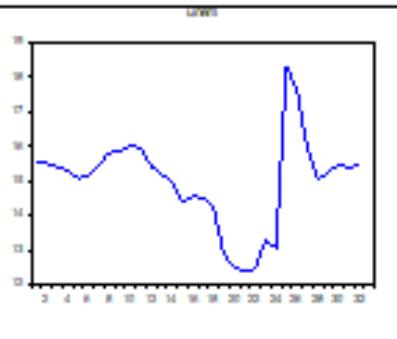
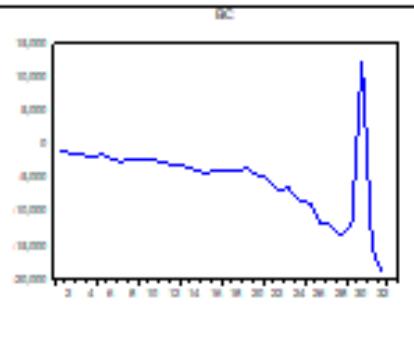
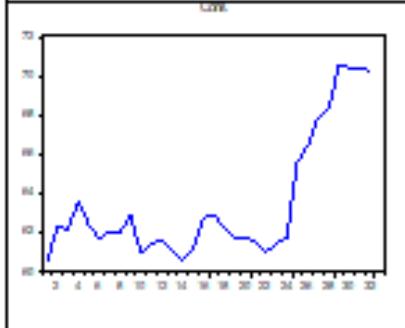
Indeed, the evolution of the variables over time presented in Chart 2 shows the existence of peaks, this led us to wonder about the existence of a regime change.
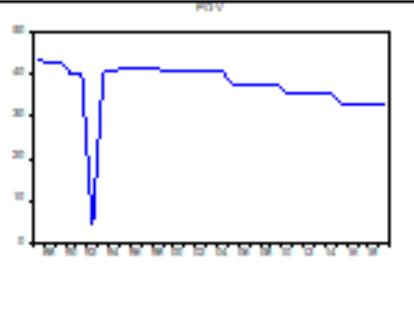
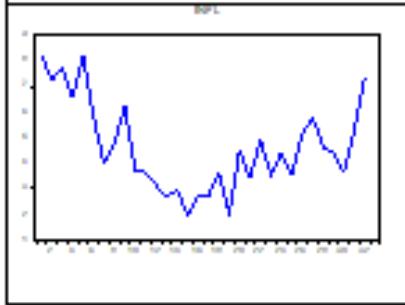
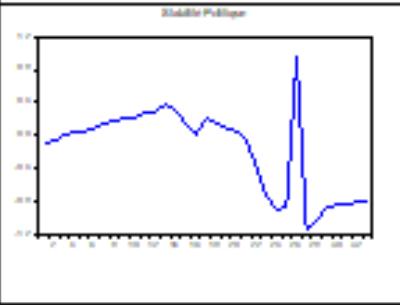
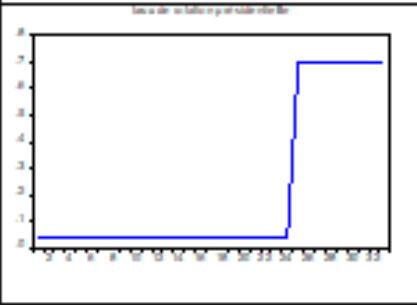 Graph 3
Table 5: Results of Correlation
<table><tr><td colspan="12">Correlation</td></tr><tr><td rowspan="2">Probability</td><td colspan="2">STABILITE_POLITI</td><td rowspan="2" colspan="2">UNEM PAUVRETE</td><td rowspan="2">IDE</td><td rowspan="2">BC</td><td rowspan="2">INFL</td><td rowspan="2">CONS</td><td rowspan="2">TAUX_DE_ROTAT ION_PRESIDENTI</td><td rowspan="2">ELLE</td><td>DEPENSES_M</td></tr><tr><td>ATTACKS</td><td>QUE</td><td>ILITAIRE5</td></tr><tr><td>ATTACKS</td><td>1.000000</td><td></td><td></td><td></td><td></td><td></td><td></td><td></td><td></td><td></td><td></td></tr><tr><td></td><td>----</td><td></td><td></td><td></td><td></td><td></td><td></td><td></td><td></td><td></td><td></td></tr><tr><td>STABILITE_P OLITIQUE</td><td>-0.697500</td><td>1.000000</td><td></td><td></td><td></td><td></td><td></td><td></td><td></td><td></td><td></td></tr><tr><td></td><td>0.0000</td><td>----</td><td></td><td></td><td></td><td></td><td></td><td></td><td></td><td></td><td></td></tr><tr><td>UNEM</td><td>0.186286</td><td>0.073159</td><td>1.000000</td><td></td><td></td><td></td><td></td><td></td><td></td><td></td><td></td></tr><tr><td></td><td>0.3073</td><td>0.6907</td><td>----</td><td></td><td></td><td></td><td></td><td></td><td></td><td></td><td></td></tr><tr><td>PAUVRETE</td><td>-0.703423</td><td>0.752226</td><td>-0.031704</td><td>1.000000</td><td></td><td></td><td></td><td></td><td></td><td></td><td></td></tr><tr><td></td><td>0.0000</td><td>0.0000</td><td>0.8632</td><td>----</td><td></td><td></td><td></td><td></td><td></td><td></td><td></td></tr><tr><td>IDE</td><td>-0.096096</td><td>0.066041</td><td>-0.550754</td><td>-0.089654</td><td>1.000000</td><td></td><td></td><td></td><td></td><td></td><td></td></tr><tr><td></td><td>0.6008</td><td>0.7195</td><td>0.0011</td><td>0.6256</td><td>----</td><td></td><td></td><td></td><td></td><td></td><td></td></tr><tr><td>BC</td><td>-0.456593</td><td>0.383476</td><td>-0.059995</td><td>0.533706</td><td>-0.152216</td><td>1.000000</td><td></td><td></td><td></td><td></td><td></td></tr><tr><td></td><td>0.0086</td><td>0.0303</td><td>0.7443</td><td>0.0017</td><td>0.4056</td><td>----</td><td></td><td></td><td></td><td></td><td></td></tr><tr><td>INFL</td><td>0.201029</td><td>-0.137066</td><td>0.248324</td><td>0.018322</td><td>-0.245372</td><td>-0.098365</td><td>1.000000</td><td></td><td></td><td></td><td></td></tr><tr><td></td><td>0.2699</td><td>0.4544</td><td>0.1706</td><td>0.9207</td><td>0.1759</td><td>0.5922</td><td>----</td><td></td><td></td><td></td><td></td></tr><tr><td>CONS</td><td>0.753438</td><td>-0.626619</td><td>0.356808</td><td>-0.885148</td><td>-0.166250</td><td>-0.445655</td><td>0.173583</td><td>1.000000</td><td></td><td></td><td></td></tr><tr><td></td><td>0.0000</td><td>0.0001</td><td>0.0450</td><td>0.0000</td><td>0.3631</td><td>0.0106</td><td>0.3421</td><td>----</td><td></td><td></td><td></td></tr><tr><td>TAUX_DE_RO TATION_PRESIDENTIELLE</td><td></td><td></td><td></td><td></td><td></td><td></td><td></td><td></td><td></td><td></td><td></td></tr><tr><td></td><td>0.753836</td><td>-0.600022</td><td>0.472496</td><td>-0.872533</td><td>-0.130579</td><td>-0.516901</td><td>0.111221</td><td>0.935646</td><td>1.000000</td><td></td><td></td></tr><tr><td></td><td>0.0000</td><td>0.0003</td><td>0.0063</td><td>0.0000</td><td>0.4763</td><td>0.0025</td><td>0.5445</td><td>0.0000</td><td>----</td><td></td><td></td></tr><tr><td>EV</td><td>-0.690455</td><td>0.654099</td><td>-0.168730</td><td>0.951236</td><td>-0.078067</td><td>0.583552</td><td>0.140326</td><td>-0.845897</td><td>-0.901552</td><td>1.000000</td><td></td></tr><tr><td></td><td>0.0000</td><td>0.0000</td><td>0.3559</td><td>0.0000</td><td>0.6711</td><td>0.0005</td><td>0.4437</td><td>0.0000</td><td>0.0000</td><td>----</td><td></td></tr><tr><td>DEPENSES_M ILITAIRES</td><td>0.194291</td><td>-0.092403</td><td>0.254703</td><td>-0.171233</td><td>-0.344305</td><td>0.288553</td><td>0.200107</td><td>0.401606</td><td>0.210546</td><td>-0.020843</td><td>1.000000</td></tr><tr><td></td><td>0.2866</td><td>0.6150</td><td>0.1595</td><td>0.3487</td><td>0.0536</td><td>0.1092</td><td>0.2722</td><td>0.0227</td><td>0.2474</td><td>0.9098</td><td>----</td></tr></table>
The results of the stationarity tests and the correlation test leads us to study the relationship between terrorism and socio-economic variables by applying the cointegration tests linked to the ARDL approach. The Bounds test requires the selection of the appropriate degree of delay (Feridun and Shahbaz 2010), in our case the AIC choice criterion is used.
Before going to the bounds cointegration test, we think about studying the correlation between the different variables. Table 5 shows the correlation between dependent and independent variables in Tunisia. The results show that explanatory variables such as unemployment rate, inflation, military spending, presidential turnover rate and household consumption were positively correlated with moderate strength with terrorism incidents. In contrast, political stability, foreign direct investment and the trade balance have a moderate negative correlation with terrorist incidents in Tunisia.
Table 5 shows the results of the Bounds cointegration test.
Table 6: Bounds Cointegration Test
<table><tr><td>Dependant variable</td><td>lag selection</td><td>F-statistic</td><td>Decision</td></tr><tr><td>ATTACKS</td><td>(2, 1, 1, 1, 1, 1, 1, 0, 0, 1, 0, 1, 1)</td><td>236.2510</td><td>Co Integration</td></tr><tr><td>Significance</td><td>I0 Bound</td><td>I1 Bound</td><td></td></tr><tr><td>10%</td><td>1.76</td><td>2.77</td><td></td></tr><tr><td>5%</td><td>1.98</td><td>3.04</td><td></td></tr><tr><td>2.5%</td><td>2.18</td><td>3.28</td><td></td></tr><tr><td>1%</td><td>2.41</td><td>3.61</td><td></td></tr></table>
The results show that the calculated statistical F is of the order of 236.2510 which is greater than the critical value advanced by Pesaran et al (2001) at the $1\%$ threshold, this confirms the existence of at least one long-term relationship between variables in Tunisia for the period from 1987 to 2019. The existence of a long-term relationship brings us back to estimating equation (1), using the ARDL technique. The results of the estimation are shown in Table 7:
Table 7: Long-Term Relationship
<table><tr><td rowspan="2">Variable</td><td colspan="3">Dependent variable ATTACKS</td></tr><tr><td>Coefficient</td><td>T-Ratio</td><td>Prob.</td></tr><tr><td>BC</td><td>-0.000867</td><td>-14.58116</td><td>0.000</td></tr><tr><td>CONS</td><td>0.573347</td><td>2.638763</td><td>0.0298</td></tr><tr><td>DM</td><td>1.440729</td><td>4.186424</td><td>0.0031</td></tr><tr><td>EV</td><td>1.162124</td><td>4.147798</td><td>0.0032</td></tr><tr><td>GDP</td><td>-0.121715</td><td>-1.336095</td><td>0.2183</td></tr><tr><td>IDE</td><td>-0.059242</td><td>-0.6277407</td><td>0.5479</td></tr><tr><td>INFL</td><td>-0.131224</td><td>-0.777508</td><td>0.4592</td></tr><tr><td>SP</td><td>2.618345</td><td>2.847902</td><td>0.0215</td></tr><tr><td>TRP</td><td>20.61104</td><td>6.237077</td><td>0.0002</td></tr><tr><td>UMPL</td><td>-0.106024</td><td>-0.448375</td><td>0.6658</td></tr><tr><td>POV</td><td>0.003322</td><td>0.221455</td><td>0.8303</td></tr><tr><td>C</td><td>-75.81844</td><td>-4.704814</td><td>0.0015</td></tr></table>
The results of our model describing the long-term relationship between terrorism and its determinants are presented in Table 7. The existence of a long-term relationship between terrorism and its fundamentals is confirmed for Tunisia. The results show that vulnerable jobs have a positive and significant impact on terrorism in Tunisia at the $1\%$ level. Hence a $1\%$ increase in vulnerable jobs causes a $1.62\%$ increase in terrorism. This means that the fragility of employment and the high level of unemployment facilitate the attraction of young people by terrorist groups. In addition, the effect of the evolution of military spending on terrorism is positive and significant. This result is unexpected compared to those of several previous works which have found a negative and significant sign (Dreher and Fischer (2011) and Aisha Ismail & Shehla Amjad (2014). This result can be justified by the low share of military spending in the
GDP which represents $2.3\%$ in 2018. Thus, an increase in military spending of $1\%$ undergoes an increase in terrorist attacks of $1.44\%$. In terms of political stability and the absence of terrorism and violence, its impact is positive and significant at $1\%$. Indeed, a one percentage point increase in political stability leads to an increase in terrorist attacks of 2.61 percentage points. The result obtained is expected and confirms that of (Kaufmann et al. 2010). The presence of a risk factor inherent in a country is a step forward in experimental methods. Eilat and Enaf (2004) show, in this spirit, that tourism depends on GDP per capita, trade and rate exchange rates of developed countries. They introduced a risk index assessing political stability and the absence of violence and terrorism in the country. They found that a one-point increase in the country's risk generates a $0.2\%$ drop in tourism. As for the presidential turnover rate, it turns out that it is a main determinant of terrorism in Tunisia, its sign is positive and significant at $1\%$. Indeed, the frequent change of presidents destabilizes the state by leading to terrorist attacks. However, a $1\%$ increase in the presidential turnover rate suffers a $20.61\%$ increase in the level of terrorist attacks in Tunisia. Thus politically unstable countries offer favorable conditions for the propagation of the phenomenon of terrorism. Finally, the results show the existence of a negative and significant relationship between the trade balance and the phenomenon of terrorism. Increasing the ML level by $1\%$ results in a $0.000867\%$ depreciation in the number of terrorist attacks. Thus an increase in the level of ML is likely to improve the level of economic growth by undergoing a power to combat this phenomenon and create new sources of employment. Finally, and from the results of the estimates, we can notice that the impact of household consumption on terrorism is positive and significant, hence a $1\%$ increase in the level of household consumption leads to an appreciation of $0.57\%$ at the level of terrorism. After having identified the long-term relationship between the variables, Table 4 presents the short-term model and shows that the coefficient (-71.68281) which indicates the speed of convergence towards the long-term equilibrium "the correction coefficient of ECT error (-1)" is negative and significant at $1\%$. Thus, in the short term, the ECM estimates are presented in Table 8:
Table 8: Short-Term Relationship
<table><tr><td colspan="4">Dependent variable: ATTACKS</td></tr><tr><td colspan="4">Lag structure: (2, 1, 1, 1, 1, 1, 1, 0, 0, 1, 1, 1)</td></tr><tr><td>Variable</td><td>Coefficient</td><td>t-Statistic</td><td>Prob.</td></tr><tr><td>ATTACKS(-1)</td><td>-0.947828</td><td>-18.37942</td><td>0.0000</td></tr><tr><td>BC(-1)</td><td>-0.000822</td><td>-26.72914</td><td>0.0000</td></tr><tr><td>CONS(-1)</td><td>0.543434</td><td>2.827931</td><td>0.0222</td></tr><tr><td>DM(-1)</td><td>1.365562</td><td>3.643418</td><td>0.0066</td></tr><tr><td>EV(-1)</td><td>1.101493</td><td>4.094729</td><td>0.0035</td></tr><tr><td>GDP(-1)</td><td>-0.115365</td><td>-1.331053</td><td>0.2199</td></tr><tr><td>IDE</td><td>-0.056151</td><td>-0.619013</td><td>0.5531</td></tr><tr><td>INFL(-1)</td><td>-0.124378</td><td>-0.772964</td><td>0.4618</td></tr><tr><td>SP(-1)</td><td>2.481740</td><td>2.950798</td><td>0.0184</td></tr><tr><td>TRP(-1)</td><td>19.53571</td><td>5.424197</td><td>0.0006</td></tr><tr><td>UMPL(-1)</td><td>-0.100493</td><td>-0.442345</td><td>0.6700</td></tr><tr><td>POV</td><td>0.003148</td><td>0.221875</td><td>0.8300</td></tr><tr><td>D(Attacks(-1))</td><td>0.286641</td><td>8.084994</td><td>0.0000</td></tr><tr><td>D(BC)</td><td>-0.000257</td><td>-130.08829</td><td>0.0000</td></tr><tr><td>D(CONS)</td><td>0.084564</td><td>0.554095</td><td>0.5947</td></tr><tr><td>D(EV)</td><td>-0.572272</td><td>-2.439842</td><td>0.0406</td></tr><tr><td>D(GDP)</td><td>-1.66423</td><td>-2.6859937</td><td>0.0277</td></tr><tr><td>D(SP)</td><td>-6.234934</td><td>-12.74600</td><td>0.0000</td></tr><tr><td>D(TRP)</td><td>1.802948</td><td>0.873582</td><td>0.4078</td></tr><tr><td>D(UMPL)</td><td>1.802948</td><td>0.873582</td><td>0.0497</td></tr><tr><td>D(INFL)</td><td>0.201054</td><td>1.991665</td><td>0.0816</td></tr><tr><td>ECT(-1)</td><td>-71.68281</td><td>-5.281541</td><td>0.0007</td></tr><tr><td>Adj. R2=.997589</td><td></td><td></td><td></td></tr><tr><td>AIC=1.046393</td><td></td><td></td><td></td></tr><tr><td>F-stat.=572.4643, F-prob.=0.000</td><td></td><td></td><td></td></tr></table>
In fact, the existence of an equilibrium relationship between terrorism and the various explanatory variables of the model makes it possible to highlight a long-term relationship between them at least in one sense. For the short-term coefficients, we notice that the delays of the terrorism variable have a strongly significant and positive effect. Once this phenomenon of terrorism has appeared in a specific location, the speed of its spread is more and more rapid over time. The results also show that the coefficient associated with the unemployment rate delayed by one period is greater than that associated with the same variable delayed by two periods. The amplification of the phenomenon of unemployment is increasingly one of the main catalysts of the phenomenon of terrorism. For the delays in political stability and the presidential turnover rate, we note that they positively and significantly affect terrorism. In addition, military spending and vulnerable jobs have a
significant impact at the threshold of $1\%$. Hence a $1\%$ increase in military spending undergoes a terrorism appreciation of $1.36\%$, and an increase in the level of vulnerable jobs by $1\%$, leads to an increase in terrorist attacks of $1.10\%$. Finally, our results indicate that poverty has a positive and significant effect in the short term. For the trade balance, its delays have a negative and significant effect at the $1\%$ threshold on terrorism. As well as the delays in the consumption variable have a positive and significant impact on terrorism. As for the growth rate used as a proxy for the development of the economy, it turns out that it is a determinant of terrorism in Tunisia. Its sign is negative and significant. Hence an increase in economic growth - a percentage point undergoes a decrease of $1.66\%$ of terrorism in Tunisia. Finally, the rate of inflation influences terrorism positively and significantly in the short term at the $10\%$ level.
Table 9: Diagnostic Test
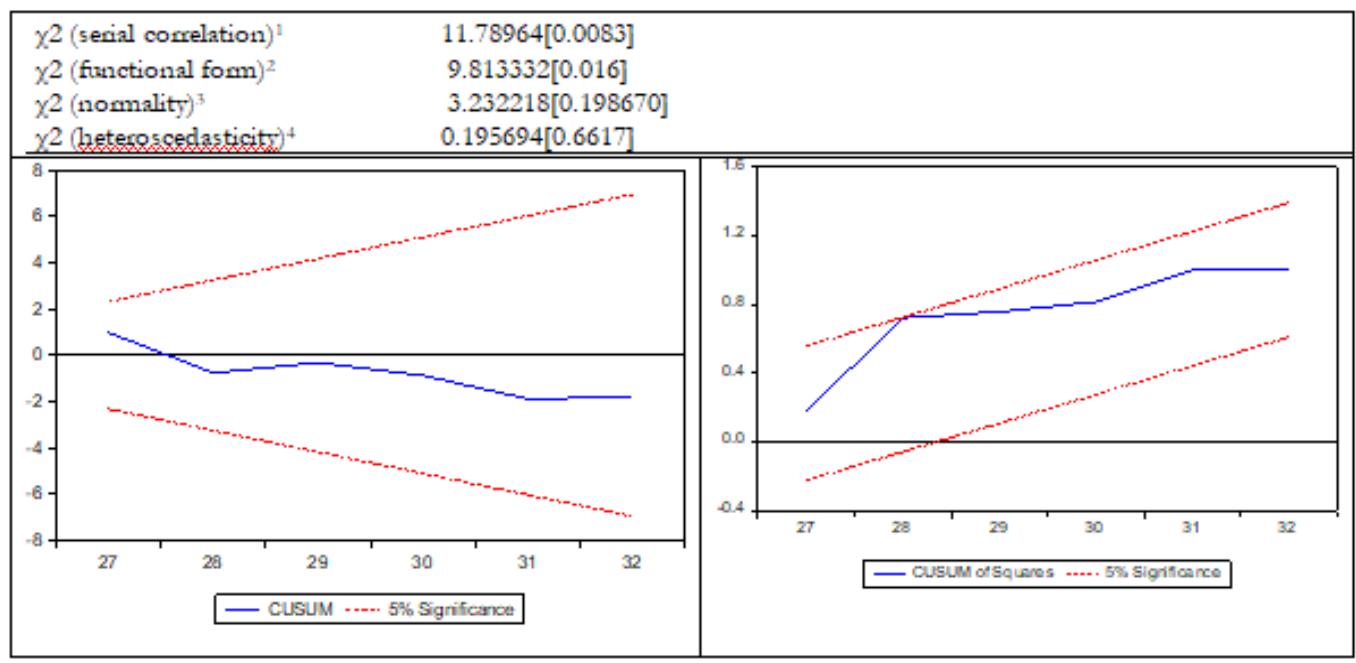
1 The Breusch-Godfrey LM test statistic for no serial correlation.
2 The White's test statistic for homoscedasticity.
3 The Jarque-Bera statistic for normality.
In order to validate the model, a series of econometric tests must be carried out on the residue. Table (8) shows the results of diagnostic tests for the selected ARDL model (2, 1, 1, 1, 1, 1, 1, 0, 0, 1, 1, 1). The Jarque-Béra test of normality confirms that the distribution is normal. Further, from the results of the "Breusch-Godfrey Lgrage multiply" test of the correlation of the series and the Breusch-Pagan-Godfrey test of heteroskedasticity, an absence of correlation of the residuals is shown, which means the absence of heteroskedasticity.
In addition, the Ramsey Reset test confirmed the linear specification of our model.
Finally, and in order to judge the structural stability of the model coefficients, one of the econometric requirements for an ARDL model is to verify the presence of the stability of the parameters. In order to test the stability of the short-term and long-term coefficients estimated by the ARDL model, we apply the cumulative sum (CUSUM) and the cumulative sum of squares (CUSUM Square) tests, carried out to recursive residuals from the ARDL model estimated in this paper (Brown et al. 1975). The results of the tests are presented in Table 5. We note that the curves do not intersect the $5\%$ confidence interval, taking into account that the CUSUM and CUSUM squared plots are located within the critical limits of $5\%$. Thus, we have empirical evidence showing that the estimated coefficients of the ARDL cointegration model (2, 1, 1, 1, 1, 1, 1, 0, 0, 1, 1, 1) are structurally stable.
## VI. CONCLUSIONS AND POLICY IMPLICATIONS
This work is an essay that analyzes terrorism and its main determinants in Tunisia. The ARDL approach was implemented for the period from 1987 to 2019 on the different time series of the following variables: terrorist attacks, unemployment rate, inflation rate, growth rate, military spending, vulnerable jobs, trade balance, household consumption, foreign direct investment, poverty, political stability and the presidential rotation rate. The estimation results show the existence of a short-term and a long-term relationship between the different variables.
In order to test the short-term as well as the long-term relationship between terrorism and the explanatory variables of the model, the empirical analysis was first devoted to examining the relationship between terrorist attacks and socioeconomic variables of the model. Tunisia. The regression results suggest that military spending, vulnerable jobs, political stability, trade balance, household consumption and presidential rotation rate significantly affect terrorism. These results, while consistent with those found by several previous empirical studies, provide a definitive conclusion about the determinants of terrorism.
Indeed, the political instability affecting Tunisia, as well as the low growth rate and the high level of unemployment allowed us to come up with two main ideas. First, in Tunisia, which is politically unstable, the level of unemployment has no significant effect on terrorism, while the presidential turnover rate has a significant and positive effect. Second, the quality of employment positively and significantly affects terrorist attacks. This, it seems to us, corroborates our main idea according to which the opening of the employment horizon brings growth and dissolves terrorism if it is carried out in a stable political framework (Ben Doudou, 2018).
In the context of an economic policy perspective and the fight against terrorism in Tunisia, a set of proposals should be formulated. First, Tunisia should continue to fight terrorism by improving the human and material resources made available to the military system and consolidate efforts to digitize it. In addition, it would seem one of the priorities of the government to ensure the application of the rules of good governance in order to stabilize the political situation and ensure presidential stability. In addition, and in order to reduce the number of young terrorists, it is necessary to create jobs and open up horizons for young people to invest.
[^1]: After September 11, terrorism unexpectedly altered the social, economic and geopolitical conditions in the world (Michael, 2007). Terrorist groups with global connections use national lands for recruitment and training, trade in criminal arms, and have mutual planning to create terror in economies (Shukla, 2009). _(p.1)_
[^4]: The Ramsey's Reset test statistic for regression specification error. _(p.11)_
Generating HTML Viewer...
References
99 Cites in Article
S Abbas,S Syed (2020). Sectarian terrorism in Pakistan: Causes, impact and remedies.
Juha Auvinen (1997). Political Conflict in Less Developed Countries 1981-89.
K Ajide,J Adenuga,I Raheem (2020). Natural resource rents, political regimes, and terrorism in Africa.
M Aziz (2009). Creating Links with Anchors.
A Abadie (2006). Poverty, political freedom, and the roots of terrorism.
I Aisha,A Shehla (2014). Determinants of terrorism in Pakistan: An empirical investigation.
S Akpan,D Obot,A Ubon (2012). Government Agricultural Credit Policy and Macroeconomic Fundamentals: a case study of Agricultural Credit Scheme Fund (ACGSF) in Nigeria.
B Aniruddha,A Jomon (2018). Youth unemployment and terrorism in the MENAP (Middle East, North Africa, Afghanistan, and Pakistan) region.
Auvinen (1997). Political conflict in less developed countries.
Subhayu Bandyopadhyay,Javed Younas (2020). Poverty, political freedom, and the roots of terrorism in developing countries: An empirical assessment.
S Blomberg,Gregory Hess,Akila Weerapana (2004). Economic conditions and terrorism.
Brian Burgoon (2006). On Welfare and Terror.
B Burgoon (2006). On welfare and terror: social welfare policies and political-economic roots of terrorism.
E Berman,J Shapiro,J Felter (2008). Can hearts and minds be bought? The economics of counterinsurgency in Iraq.
S Blomberg,Gregory Hess (2008). The Lexus and the Olive Branch: Globalization, Democratization, and Terrorism.
S Blomberg,G Hess,A Weerapana (2004). Economic conditions and terrorism.
A Bravo,C Dias (2000). An empirical analysis of terrorism: deprivation, Islamism and geopolitical factors.
Subhayu Bandyopadhyay,Todd Sandler,Javed Younas (2013). Foreign aid as counterterrorism policy.
Eli Berman,Michael Callen,Joseph Felter,Jacob Shapiro (2009). Do Working Men Rebel? Insurgency and Unemployment in Iraq and the Philippines.
Atin Basuchoudhary,William Shughart (2010). ON ETHNIC CONFLICT AND THE ORIGINS OF TRANSNATIONAL TERRORISM.
M Ben Doudou (2018). Démocratie, stabilité politique et croissance économique: estimation à partir d'un modèle en panel dynamique.
M Bevir,E Brown,K (2019). Decentring counterterrorism.
Eli Berman,Jacob Shapiro,Joseph Felter (2008). Can Hearts and Minds Be Bought? The Economics of Counterinsurgency in Iraq.
Gaspard Bianquis,Laura Castell (2020). Les attentats nous terrorisent-ils ? L’impact des attentats du 13 novembre 2015 sur les préférences des Français.
Brian Burgoon (2006). On Welfare and Terror.
Benedict Clements,Sanjeev Gupta,Saida Khamidova (2021). Is military spending converging to a low level across countries?.
Ctret Centre Tunisien de Recherches et d'Etudes sur le Terrorisme.
Raul Caruso,Friedrich Schneider (2011). The socio-economic determinants of terrorism and political violence in Western Europe (1994–2007).
P Collier,A Hoeffler (2004). Greed and grievance in civil war.
N Campos,M Gassebner (2008). International Terrorism, Political Instability and the Escalation Hypothesis.
Ralph Catalano,Raymond Novaco,William Mcconnell (1997). A model of the net effect of job loss on violence..
Seung-Whan Choi (2010). Fighting Terrorism through the Rule of Law?.
A Dreher,J Fischer (2010). Government decentralization as a disincentive for transnational terror? an empirical analysis.
Axel Dreher,Martin Gassebner (2008). Does political proximity to the U.S. cause terror?.
Robert Engle,C Granger (1987). Co-Integration and Error Correction: Representation, Estimation, and Testing.
M Estrada,D Park,A Khan (2018). The impact of terrorism on economic performance: The case of Turkey.
Mario Estrada,Donghyun Park,Jung Kim,Alam Khan (2015). The economic impact of terrorism: A new model and its application to Pakistan.
R Ezcura,D Palacios (2016). Terrorism and spatial disparities: Does interregional inequality matter?.
Roberto Ezcurra,David Palacios (2016). Terrorism and spatial disparities: Does interregional inequality matter?.
Mete Feridun,Muhammad Shahbaz (2010). FIGHTING TERRORISM: ARE MILITARY MEASURES EFFECTIVE? EMPIRICAL EVIDENCE FROM TURKEY.
J Fearon,D Laitin (2003). Ethnicity, insurgency and civil war.
Andreas Feldmann,Maiju Perälä (2004). Reassessing the Causes of Nongovernmental Terrorism in Latin America.
T Friedman (2002). New York Times New York State Poll, March 1999.
Andreas Freytag,Jens Krüger,Daniel Meierrieks,Friedrich Schneider (2010). The origins of terrorism: Cross-country estimates of socio-economic determinants of terrorism.
K Goldstein (2006). Unemployment, inequality and terrorism: another look at the relationship between economics and terrorism.
T Gurr (1970). Why Men Rebel.
Martin Gassebner,Simon Luechinger (2011). Lock, stock, and barrel: a comprehensive assessment of the determinants of terror.
Donald Green,Jack Glaser,Andrew Rich (1998). From lynching to gay bashing: The elusive connection between economic conditions and hate crime..
F Hacker (1976). Crusaders, Criminals, Crazies: Terror and Terrorism in Our Time.
Mark Harrison (2006). Bombers and Bystanders in Suicide Attacks in Israel, 2000 to 2003.
R Hudson (2002). Asian organized crime and terrorist activity in Canada, 1999–2002.
M Harrison (2006). An economist looks at suicide terrorism.
J Honaker (2010). Unemployment and violence in Northern Ireland: a missing data model for ecological inference.
Scott Helfstein (2014). Social capital and terrorism.
G Immordino,G Karakoç,S Piccolo (2018). Terrorism, counterterrorism ans optimal striking rules.
A Ismail,S Amjad (2014). Determinants of terrorism in pakistan: an empirical investigation.
S Johansen (1988). Statistical analysis of cointegration vectors.
Søren Johansen,Katarina Juselius (1990). MAXIMUM LIKELIHOOD ESTIMATION AND INFERENCE ON COINTEGRATION — WITH APPLICATIONS TO THE DEMAND FOR MONEY.
G Khusrav,T Sandler (2019). What We Have Learned about Terrorism since 9/11.
T Krieger,D Meierrieks (2019). Income inequality, redistibution and domestic terrorism.
S Kalyvas (2006). The Logic of Violence in Civil War.
Mustafa Kirisci (2020). Who Fights Terror: Gendarmerie Forces and Terrorist Group Termination.
Tim Krieger,Daniel Meierrieks (2011). What causes terrorism?.
A Krueger,J Maleckova (2003). Education, poverty and terrorism: is there a causal connection?.
Peter Kurrild-Klitgaard,Mogens Justesen,Robert Klemmensen (2006). The political economy of freedom, democracy and transnational terrorism.
S Kalyvas (2006). The Logic of Violence in Civil War.
Krisztina Kis-Katos,Helge Liebert,Günther Schulze (2011). On the origin of domestic and international terrorism.
Charfeddine Lanouar,Mohamed Goaied (2019). Tourism, terrorism and political violence in Tunisia: Evidence from Markov-switching models.
Brian Lai (2007). “Draining the Swamp”: An Empirical Examination of the Production of International Terrorism, 1968—1998.
Quan Li,Drew Schaub (2004). Economic Globalization and Transnational Terrorism.
Brian Lai (2007). “Draining the Swamp”: An Empirical Examination of the Production of International Terrorism, 1968—1998.
Nancy Morris,Gary Lafree (2016). Country‐level Predictors of Terrorism.
Edward Muller,Mitchell Seligson (1190). Inequality and Insurgency.
Edward Miguel,Shanker Satyanath,Ernest Sergenti (2004). Economic Shocks and Civil Conflict: An Instrumental Variables Approach.
Zahra Malik,Khalid Zaman (2013). Macroeconomic consequences of terrorism in Pakistan.
Hassen Mohamed,Mehdi Ben Jebli,Slim Ben Youssef (2019). Renewable and fossil energy, terrorism, economic growth, and trade: Evidence from France.
M Mahmoud (2013). Tableau enacdré 9.3. Estimations des loyers du secteur privé au moyen d’un modèle linéaire.
Nicole (2003). America's underclass and crime: the influence of macroeconomic factors.
L Oppenheim (2007). Politics in Chile: socialism, authoritarianism, and market democracy.
L Oppenheim (2007). Politics in Chile: socialism, authoritarianism, and market democracy.
A Oyefusi (2010). Oil, youths, and civil unrest in Nigeria's delta.
M Pesaran,Y Shin,R Smith (2001). bounds testing approaches to the analysis of level relationships.
M Pesaran,Yongcheol Shin,Ron Smith (1999). Pooled Mean Group Estimation of Dynamic Heterogeneous Panels.
Kechagia Polyxeni,Metaxas Theodore (2019). An empirical investigation of FDI inflows in developing economies: Terrorism as a determinant factor.
P Raja,A Raghu (2020). A critical review of terrorism effects and their impacts on tourist destination countries.
James Piazza (2006). Rooted in Poverty?: Terrorism, Poor Economic Development, and Social Cleavages<sup>1</sup>.
James Piazza (2011). Poverty, minority economic discrimination, and domestic terrorism.
Jeffrey Ross (1993). Structural Causes of Oppositional Political Terrorism: Towards a Causal Model.
Dominick Salvatore (2007). Growth, international inequalities, and poverty in a globalizing world.
Farhan Sarwar,Siti Panatik,Hafiz Jameel (2020). Does fear of terrorism influence psychological adjustment of academic sojourners in Pakistan? Role of state negative affect and emotional support.
Muhammad Shahbaz (2013). Linkages between inflation, economic growth and terrorism in Pakistan.
M Shahbaz,M Shabbir,M Malik,M Wolters (2013). An analysis of a causal relationschip between economic growth and terrorism in Pakistan.
Gamini Samaranayake (1999). Patterns of political violence and responses of the government in Sri Lanka, 1971–1996.
J Stern (2003). Terror in the Name of God: Why Religious Militants Kill.
Friedrich Schneider,Tilman Brück,Daniel Meierrieks (2010). The Economics of Terrorism and Counter-Terrorism: A Survey (Part I).
Edward Sayre (2009). Labor Market Conditions, Political Events, and Palestinian Suicide Bombings.
Burcu Savun,Brian Phillips (2009). Democracy, Foreign Policy, and Terrorism.
J Thompson (1989). Deprivation and political violence in Northern Ireland, 1922-1985: a timeseries analysis.
Sara Wade,Dan Reiter (2007). Does Democracy Matter?.
No ethics committee approval was required for this article type.
Data Availability
Not applicable for this article.
How to Cite This Article
Nesrine Dardouri. 2026. \u201cThe Determinants of Terrorism: What lessons for a developing country?\u201d. Global Journal of Management and Business Research - B: Economic & Commerce GJMBR-B Volume 23 (GJMBR Volume 23 Issue B5).
Explore published articles in an immersive Augmented Reality environment. Our platform converts research papers into interactive 3D books, allowing readers to view and interact with content using AR and VR compatible devices.
Your published article is automatically converted into a realistic 3D book. Flip through pages and read research papers in a more engaging and interactive format.
Our website is actively being updated, and changes may occur frequently. Please clear your browser cache if needed. For feedback or error reporting, please email [email protected]
Thank you for connecting with us. We will respond to you shortly.