The Dynamic Atmosphere Energy Transport (DAET) climate model, a mathematical model previously applied to a study of Earth’s climate, has been adapted to study the climatic features in the low-pressure, dust-prone atmosphere of the planet Mars. Using satellite data observed for Martian Year 29 (MY29), temperature profiles are presented here that confirm the studies of prior authors of the existence on Mars of a tropical solar-energy driven zone of daytime atmospheric warming, that both diurnally lifts the tropopause and follows the annual latitudinal cycle of the solar zenith. This tropical limb of ascending convection is dynamically linked to polar zones of descending air, the seasonal focus of which is concentrated over each respective hemisphere’s polar winter cap of continuous darkness. An analysis of the MY29 temperature data was performed to generate an annual average surface temperature metric that was then used to both inform the design of and to constrain the computation of the DAET climate model. The modelling analysis suggests that the Martian atmosphere is fully transparent to surface emitted thermal radiant energy.
## I. INTRODUCTION
The terrestrial planet Mars is the focus of extensive and continuing scientific study. This paper deals with the topic of climatic modelling and is informed by the atmospheric observations of various authors who have made studies in this field (Table 1).
Table 1: Selected Prior Studies of the Atmosphere of Mars
<table><tr><td>Item</td><td>Observation</td><td>Year</td><td>Source</td></tr><tr><td>Polar Cap: Northern Winter Polar Frost</td><td>At the current obliquity,~0.3 mm of ice might sublimate away during the summer</td><td>1990</td><td>[1] Haberle, R.M. and Jakosky, B.M., 1990. Sublimation and transport of water from the north residual polar cap on Mars</td></tr><tr><td>Northern Water Icecap</td><td>Summer temperatures ~205 Kelvin</td><td>1990</td><td>[1] Haberle, R.M. and Jakosky, B.M., 1990. Sublimation and transport of water from the north residual polar cap on Mars</td></tr><tr><td>CO2 Freezing at 145 Kelvin</td><td>Wet and dry adiabats Figure 3</td><td>2000</td><td>[2] Pettengill, G.H. and Ford, P.G., 2000. Winter clouds over the north Martian polar cap</td></tr><tr><td>Dust Heating</td><td>Air absorbs 1% of Solar Radiation. Solar attenuation by dust is 26% at solar zenith</td><td>2005</td><td>[3] Savijarvi, H., Crisp, D. and Harri, A.M., 2005. Effects of CO2 and dust on present-day solar radiation and climate on Mars</td></tr><tr><td>Specific Heat Cp</td><td>cp = 736 J/kg/K</td><td>2005</td><td>[3] Savijarvi, H., Crisp, D. and Harri, A.M., 2005. Effects of CO2 and dust on present-day solar radiation and climate on Mars</td></tr><tr><td>Southern Icecap</td><td>Winter CO2 Snow clouds and surface frost south of 55°S</td><td>2008</td><td>[4] McCleese, D.J., et al.
2008. Intense polar temperature inversion in the middle atmosphere on Mars</td></tr><tr><td>Water Clouds</td><td>Water clouds only up to 60Km</td><td>2010</td><td>[5] Heavens, N.G., et al., 2010. Water ice clouds over the Martian tropics during northern summer</td></tr><tr><td>Atmospheric Temperatures</td><td>Temperature profiles</td><td>2010</td><td>[6] McCleese, D.J., et al.
2010. Structure and dynamics of the Martian lower and middle atmosphere as observed by the Mars Climate Sounder</td></tr><tr><td>Dust Weather</td><td>Coniometeorology</td><td>2011</td><td>[7] Medvedev, A.S., et al., 2011. Influence of dust on the dynamics of the Martian atmosphere above the first scale height</td></tr><tr><td>Carbon Dioxide Polar Ice Clouds</td><td>Lower 20 km of atmosphere</td><td>2011</td><td>[8] Vincendon, M. et al. 2011 New near-IR observations of mesospheric CO2 and H2O clouds on Mars</td></tr><tr><td>Carbon Dioxide Clouds</td><td>50 to 100 Km between [13°S to 9°N] No clouds between 30-40°S</td><td>2011</td><td>[8] Vincendon, M. et al. 2011 New near-IR observations of mesospheric CO2 and H2O clouds on Mars</td></tr><tr><td>Convective Boundary layer</td><td>5 to 10 Km</td><td>2011</td><td>[9] Petrosyan, A., et al., 2011. The Martian atmospheric boundary layer</td></tr><tr><td>Global Average Temperature (GAT)</td><td>Table of results</td><td>2017</td><td>[10] Nikolov, N. and Zeller, K., 2017. New insights on the physical nature of the atmospheric greenhouse effect deduced from an empirical planetary temperature model</td></tr><tr><td>Albedo</td><td>Dust in the lowest 10 Km. The big Volcanoes are all taller than 10 Km</td><td>2017</td><td>[11] Venable, R., 2017. Report on the Mars Apparition of 2007-2008.</td></tr><tr><td>Snow</td><td>Snowfall P85.</td><td>2017</td><td>[11] Venable, R., 2017. Report on the Mars Apparition of 2007-2008.</td></tr><tr><td>Dust</td><td>Peak surface temperatures are close to the 260- to 270-K range</td><td>2019</td><td>[12] Heavens, N.G., et al., 2019. Dusty deep convection in the Mars year 34 planet-encircling dust event</td></tr></table>
Mars is classed by astronomers as a superior planet because it is located further from the Sun than the Earth. Mars orbits the Sun at a mean distance of 227.925 million Km and receives an average solar irradiance of $586.2\mathrm{W} / \mathrm{m}^2$, which is $43.97\%$ of the Earth's insolation. Unlike the terrestrial bodies of Venus, Earth, and Saturn's moon Titan which all have a surface atmospheric pressure greater than 0.1 Bar (10,000 pascals) and therefore have tropospheric thermal radiant opacity [13], the surface atmospheric pressure of Mars is 636 pascals at the planet's mean radius. The tenuous gaseous envelope of the Martian atmosphere is highly transparent to thermal radiation and consequently the planet experiences major surface atmospheric window thermal energy loss to space.
The main constituent gas of the Martian atmosphere is Carbon Dioxide $95.1\%$ by volume. The atmospheric pressure varies seasonally between 400 and 870 pascals due to the sequestration of solid carbon dioxide on the polar icecaps during each hemisphere's polar winter (Table 2).
Table 2: Martian Planetary Metrics.
<table><tr><td>Parameter</td><td>Value</td><td>Units</td><td>Source</td></tr><tr><td>Volumetric Mean Radius of Mars</td><td>3389.5</td><td>Km</td><td>[14] Williams, D.R., 2022. Mars Fact Sheet</td></tr><tr><td>Average Surface Atmospheric Pressure</td><td>0.636</td><td>kPa</td><td>[14] Williams, D.R., 2022. Mars Fact Sheet</td></tr><tr><td>Average Surface Temperature</td><td>211.8</td><td>Kelvin</td><td>This study of Martian Year 29 (MY29) Temperature Data</td></tr><tr><td>Average Surface Temperature</td><td>-61.35</td><td>Celsius</td><td></td></tr><tr><td>Expected Ta</td><td>209.8</td><td>Kelvin</td><td>[15] Sagan, C. and Chyba, C., 1997. The early faint sun paradox</td></tr><tr><td>Atmospheric Thermal Effect (ATE)</td><td>2.0</td><td>Kelvin</td><td></td></tr><tr><td>Surface gravity</td><td>3.71</td><td>m/s2</td><td>[14] Williams, D.R., 2022. Mars Fact Sheet</td></tr><tr><td>Tropopause height</td><td>70</td><td>km</td><td>[16] Justus, C.G. and Braun, R.D., 2007. Atmospheric Environments for Entry, Descent, and Landing (EDL): Table 5.1.1</td></tr><tr><td>Tropospheric lapse rate</td><td>1.064</td><td>K/km</td><td>[16] Justus, C.G. and Braun, R.D., 2007. Atmospheric Environments for Entry, Descent, and Landing (EDL): Table 5.1.1</td></tr><tr><td>Solar Irradiance of Mars</td><td>586.2</td><td>W/m2</td><td>[14] Williams, D.R., 2022. Mars Fact Sheet</td></tr><tr><td>Ratio of Irradiance to Earth</td><td>43.07%</td><td>%</td><td>[14] Williams, D.R., 2022. Mars Fact Sheet</td></tr><tr><td>Bond Albedo</td><td>0.25</td><td>A (Constant)</td><td>[14] Williams, D.R., 2022. Mars Fact Sheet</td></tr><tr><td>Average Annual Solar Insolation</td><td>219.825</td><td>W/m2</td><td>[14] Williams, D.R., 2022. Mars Fact Sheet</td></tr><tr><td>Axial Tilt</td><td>25.19</td><td>degrees</td><td>[14] Williams, D.R., 2022. Mars Fact Sheet</td></tr><tr><td>Length of Year</td><td>686.98</td><td>Sols</td><td></td></tr><tr><td>Carbon Dioxide (CO2) Volume%</td><td>95.1%</td><td>%</td><td>[14] Williams, D.R., 2022. Mars Fact Sheet</td></tr><tr><td>Minimum Surface Pressure in Southern Winter</td><td>400</td><td>Pascal</td><td>[17] Haberle, R.M. 2003 Planetary Atmospheres Mars</td></tr><tr><td>Maximum Surface Pressure in Southern Late Spring</td><td>870</td><td>Pascal</td><td>[17] Haberle, R.M. 2003 Planetary Atmospheres Mars</td></tr><tr><td>Average Orbital Distance</td><td>227,925,000</td><td>Km</td><td>[14] Williams, D.R., 2022. Mars Fact Sheet</td></tr></table>
The Martian Global Average Temperature (GAT) has been variously estimated to range between 200 Kelvin and 240 Kelvin (Table 3).
Table 3: Martian Global Average Temperature (GAT) Estimates
<table><tr><td>Temperature (Kelvin)</td><td>Year</td><td>Title</td><td>Reference</td><td>Source</td></tr><tr><td>218</td><td>2006</td><td>Vázquez, M. and Hanslmeyer, A., 2006. Ultraviolet radiation in the solar system</td><td>[18]</td><td>(Vol. 331). Springer Science & BusinessMedia</td></tr><tr><td>202</td><td>2007</td><td>Fenton, L.K., Geissler, P.E. and Haberle, R.M., 2007. Global warming and climate forcing by recent albedo changes on Mars.</td><td>[19]</td><td>Nature, 446(7136), pp.646-649.</td></tr><tr><td>200</td><td>2008</td><td>Rapp, D. 2008 Human missions to Mars: enabling technologies for exploring the red planet. Back Matter.: Appendix C Water on Mars pp 445-511.</td><td>[20]</td><td>Springer Germany</td></tr><tr><td>214</td><td>2010</td><td>Taylor, F.W.
2010. The scientific exploration of Mars</td><td>[21]</td><td>Cambridge University Press, 2010. ISBN978-0-521-82956-4</td></tr><tr><td>215</td><td>2010</td><td>Lacis, A.A., Hansen, J.E., Russell, G.L., Oinas, V. and Jonas, J., 2013. The role of long-lived greenhouse gases as principal LW control knob that governs the global surface temperature for past and future climate change.</td><td>[22]</td><td>Tellus B: Chemical and Physical Meteorology, 65(1), p.19734.</td></tr><tr><td>227</td><td>2011</td><td>Schulze-Makuch, D., Méndez, A., Fairén, A.G., Von Paris, P., Turse, C., Boyer, G., Davila, A.F., Antonio, M.R.D.S., Catling, D. and Irwin, L.N., 2011. A two-tiered approach to assessing the habitability of exoplanets.</td><td>[23]</td><td>Astrobiology, 11(10), pp.1041-1052.</td></tr><tr><td>202</td><td>2013</td><td>Haberle, R.M., 2013. Estimating the power of Mars' greenhouse effect.</td><td>[24]</td><td>Icarus, 223(1), pp.619-620.</td></tr><tr><td>240</td><td>2014</td><td>Barlow, N., 2014. Mars An Introduction to its Interior, Surface and Atmosphere</td><td>[25]</td><td>by Nadine Barlow, Cambridge, UK: Cambridge University Press, 2014</td></tr><tr><td>210</td><td>2022</td><td>Williams, D.R., 2022. Mars Fact Sheet</td><td>[14]</td><td>NASA Online</td></tr></table>
The surface diurnal temperature range measured at the Viking 1 lander site is between a nighttime low of 184 Kelvin and a daytime high of 242 Kelvin [14]. The climate modelling study presented here is informed by the Martian Year 29 (MY29) atmospheric temperature profile data first published in 2010 by McCleese et al. [6] and kindly supplied for use in this work [26, 27].
## II. MY29 DATA ANALYSIS AND PRESENTATION
The Dynamic-Atmosphere Energy-Transport (DAET) climate model is predicated on a design protocol that ensures the computational existence of the dual planetary surface environments of a lit daytime hemisphere of net energy gain and a dark nighttime hemisphere of net energy loss [28].
In order to appropriately constrain the temperature data and to ensure that polar circle zones of continuous lit surface (summer) and continuous dark surface (winter) are appropriately binned, the MY29 source data was regrouped into two separate lit and dark data sets [26,27]. These two datasets incorporate the illumination effect of the seasonal axial tilt of Mars in the binning process (Table 4).
Table 4: Solar Zenith with the Associated Latitude and Locus of Equivalent Meridian Angle for the North Polar Cap Terminator
<table><tr><td>Octon</td><td>Sol</td><td>Scaled Sol</td><td>Solar Zenith Latitude</td><td>Latitude of Polar Cap Terminator</td><td>Terminator Meridian Angle Equivalent</td><td>Northern Hemisphere Season</td></tr><tr><td>0</td><td>0</td><td>0.00</td><td>0.00</td><td>90.00</td><td>0.00</td><td>Northern Spring Equinox</td></tr><tr><td>45</td><td>84</td><td>45.27</td><td>17.90</td><td>72.10</td><td>17.90</td><td>Northern Spring</td></tr><tr><td>90</td><td>167</td><td>90.00</td><td>25.19</td><td>64.81</td><td>25.19</td><td>Northern Summer Solstice</td></tr><tr><td>135</td><td>251</td><td>135.27</td><td>17.73</td><td>72.27</td><td>17.73</td><td>Northern Summer</td></tr><tr><td>180</td><td>334</td><td>180.00</td><td>0.00</td><td>90.00</td><td>360.00</td><td>Northern Autumn Equinox</td></tr><tr><td>225</td><td>418</td><td>225.27</td><td>-17.90</td><td>72.10</td><td>342.10</td><td>Northern Autumn</td></tr><tr><td>270</td><td>501</td><td>270.00</td><td>-25.19</td><td>64.81</td><td>334.81</td><td>Northern Winter Solstice</td></tr><tr><td>315</td><td>585</td><td>315.27</td><td>-17.73</td><td>72.27</td><td>342.27</td><td>Northern Winter</td></tr></table>
To achieve this re-binning the latitude of each zonal cell was converted into a 360-degree equivalent meridional angle with the North Pole 90-degree latitude as the zero-angle datum. For this meridional great circle, the far side surface latitudes are calibrated between 0 and 180 degrees and the near side (sun facing) latitudes are calibrated between 180 and 360 degrees. This data re-organisation ensures that the planet's zonal latitudes track the seasonal axial tilt illumination, consequently only lit surface latitudes were used to compute average daytime temperatures and correspondingly only dark surface latitudes were used to compute average nighttime temperatures (Table 5).
The MY29 temperature data are organised by 5-degree wide latitudinal zones across the full surface area of the Martian globe. Because of the standard geometric effect on surface area of zonal latitude bands, whereby zonal latitude area has a maximum value at the equator and decreases towards the poles, it is necessary to compute the temperature data using an areal weighted algorithm. This process ensures that high-latitude polar zones of small surface area are not overrepresented in the calculation of global temperature averages.
In addition to the areal weighted averages of global temperature, similar calculations were made of the average tropopause height for the two polar and one tropical convection cell. Using these tropopause heights as the upper boundary, a surface to tropopause lapse rate was calculated for each zonal latitude component of the planetary meridional atmospheric transect. (Table 5).
Table 5: Martian MY29 Atmosphere Temperature Metrics
<table><tr><td colspan="4">Martian Atmosphere Temperature Metrics</td></tr><tr><td>Item</td><td>Kelvin</td><td>Celsius</td><td>Flux Averaging W/m2</td></tr><tr><td>North Pole Day Temperature</td><td>192.2</td><td>-80.94</td><td>77.4</td></tr><tr><td>North Pole Night Temperature</td><td>177.9</td><td>-95.23</td><td>56.8</td></tr><tr><td>North Pole Flux Average Annual Surface Temperature</td><td>185.5</td><td>-87.68</td><td>67.1</td></tr><tr><td>Tropical Day Temperature</td><td>226.7</td><td>-46.50</td><td>149.6</td></tr><tr><td>Tropical Night Temperature</td><td>210.8</td><td>-62.32</td><td>112.0</td></tr><tr><td>Tropical Flux Average Annual Surface Temperature</td><td>219.2</td><td>-53.98</td><td>130.8</td></tr><tr><td>South Pole Day Temperature</td><td>181.1</td><td>-92.03</td><td>61.0</td></tr><tr><td>South Pole Night Temperature</td><td>176.3</td><td>-96.83</td><td>54.8</td></tr><tr><td>South Pole Flux Average Annual Surface Temperature</td><td>178.8</td><td>-94.38</td><td>57.9</td></tr><tr><td>Both Poles Day Temperature</td><td>188.4</td><td>-84.79</td><td>71.4</td></tr><tr><td>Both Poles Night Temperature</td><td>183.6</td><td>-89.53</td><td>64.5</td></tr><tr><td>Polar Flux Average Annual Surface Temperature</td><td>186.0</td><td>-87.11</td><td>67.9</td></tr><tr><td>Global Octon Day Temperature</td><td>220.0</td><td>-53.15</td><td>132.8</td></tr><tr><td>Global Octon Night Temperature</td><td>202.5</td><td>-70.65</td><td>95.3</td></tr><tr><td>Mars Global Flux Average Surface Temperature (MY29)</td><td>211.8</td><td>-61.36</td><td>114.1</td></tr><tr><td>Tropical Tropopause Height Day (m)</td><td>61.977</td><td></td><td></td></tr><tr><td>Tropical Tropopause Height Night (m)</td><td>59.281</td><td></td><td></td></tr><tr><td>Polar Tropopause Height Day (m)</td><td>24.817</td><td></td><td></td></tr><tr><td>Polar Tropopause Height Night (m)</td><td>29.606</td><td></td><td></td></tr><tr><td>Tropical Lapse Rate Day (K/km)</td><td>1.25</td><td></td><td></td></tr><tr><td>Tropical Lapse Rate Night (K/km)</td><td>1.10</td><td></td><td></td></tr><tr><td>Polar Lapse Rate Day (K/km)</td><td>0.95</td><td></td><td></td></tr><tr><td>Polar Lapse Rate Night (K/km)</td><td>0.96</td><td></td><td></td></tr></table>
An additional benefit of the re-binning of the latitudinal transects to a great circle meridian calibration is that it facilitates the presentation of the seasonal global atmosphere transects into an Octon set of polar plots organised from the perspective of the solar zenith (Figures 1 and 2).
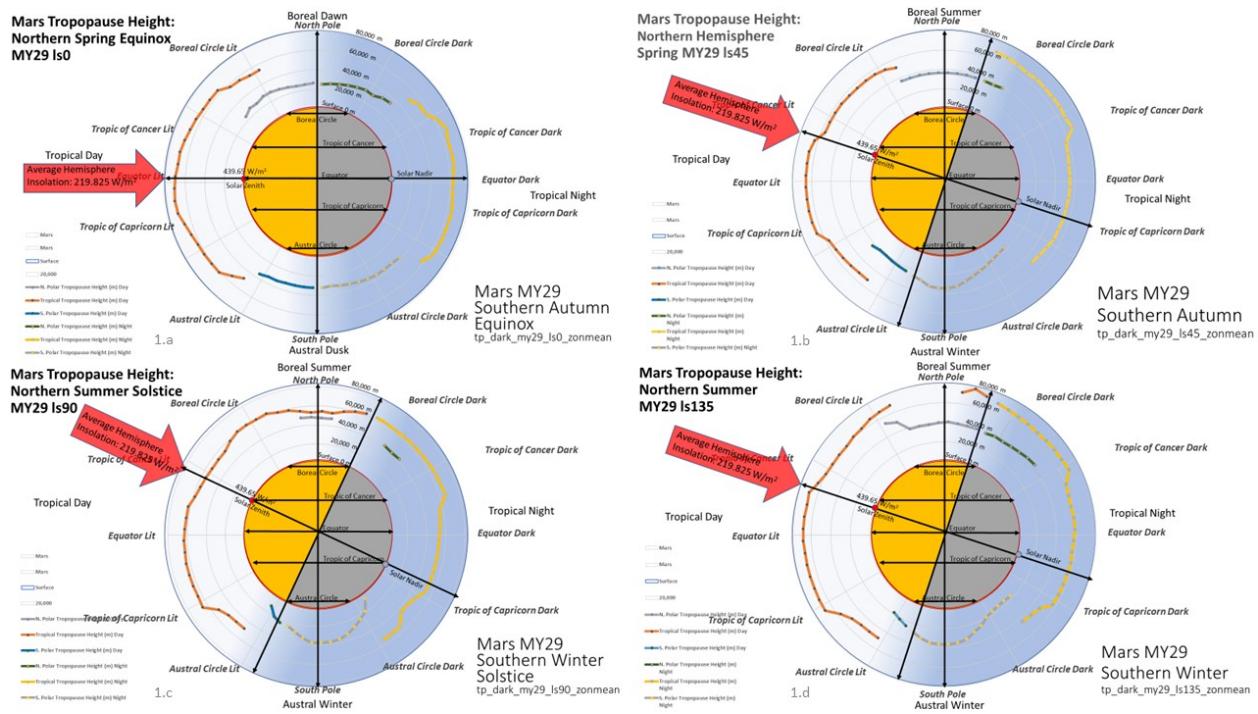
Figure 1: Mars Global Tropopause Height - Northern Hemisphere Summer
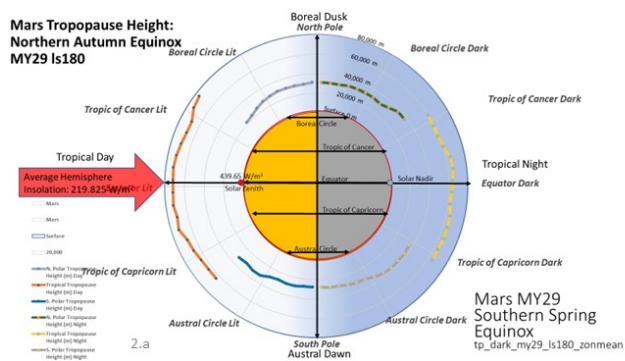
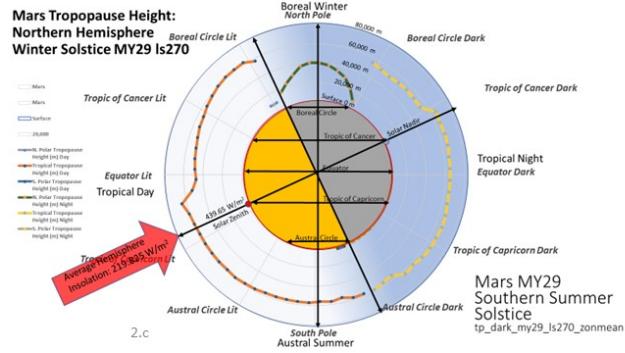
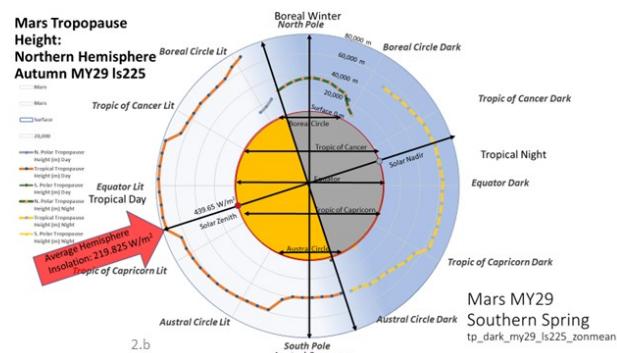
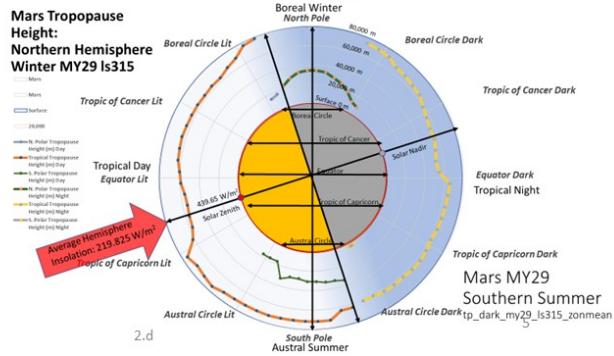 Figure 2: Mars Global Tropopause Height - Southern Hemisphere Summer
### a) Data Quantity and Quality
The MY29 atmospheric data used here [6] is organised into a set of two Excel Workbooks that each contain a group of 8 Excel worksheets. These worksheets collate the daytime and nighttime polar meridional transect data across each hemisphere for the 8 seasonal octans for the Martian year MY29 [26, 27]. Each of the 16 worksheets contains 36 columns that record the atmospheric profile data in 5-degree wide latitude swathes that cover the full extent of the specific hemisphere (either lit day or dark night). For each 5-degree wide latitude band the vertical profile data is recorded at a set of 96 levels that range in height above the datum surface from $1,263\mathrm{m}$ (610 pascals) to a maximum height of $93,523\mathrm{m}$ (0.0042 pascals). Due to technical issues associated with the satellite data acquisition process [6] the physical extent of the collated temperature data varies for each of the 8 worksheets within the respective workbook [26, 27].
### b) Data Analysis
Data Analysis was performed on the MY29 seasonal panels to identify the following sets of atmospheric variables:
1. The air temperature at the datum level of 610 pascals (1,263 m).
2. The tropospheric lapse rate between $10.4 \, \text{km}$ and $60.4 \, \text{km}$ of surface elevation.
3. The lapse rate between a datum level of $1.3 \mathrm{~km}$ and the variable tropopause height for each of the 3 regional circulation cells (North Pole, Tropical and South Pole).
4. The tropopause height in metres for each of the 3 regional circulation cells (North Pole, Tropical and South Pole).
5. The tropopause temperature in Kelvin for each of the 3 regional circulation cells (North Pole, Tropical and South Pole).
6. Near-surface temperature inversions associated with anomalous energy capture in the boundary layer were recorded when observed in the data.
- The results of this analysis are presented in data supplemental files located online at Research Gate [29].
c) A Comparison between the Tropospheres of Venus and Mars
The two terrestrial planets Venus [30] and Mars have a significant number of environmental differences and some very interesting atmospheric similarities (Table 6).
Table 6: Mars Venus Planetary Atmospheric Comparisons
<table><tr><td>Comparison</td><td>Mars</td><td>Venus</td></tr><tr><td>Planetary Surface Pressure (Pascal)</td><td>636</td><td>9,321,900</td></tr><tr><td>Planetary Surface Temperature (Kelvin)</td><td>211.8</td><td>699</td></tr><tr><td>Scale Height (Atmospheric thickness) (m)</td><td>10,900</td><td>15,080</td></tr><tr><td>Atmospheric Composition: CO2 by Volume%</td><td>95.1%</td><td>96.5%</td></tr><tr><td>Height of the Planet's Lit side Tropical Tropopause (Km)</td><td>62.0</td><td>63.43</td></tr><tr><td>Equation Temperature of the Planet's Tropopause (Kelvin)</td><td>134.4</td><td>224</td></tr><tr><td>Equation Pressure of the Planet's Tropopause (Pascal)</td><td>0.592</td><td>8,042</td></tr><tr><td>Planet's Vacuum Planet Equation Emission Height (Km)</td><td>1.6</td><td>71.06</td></tr><tr><td>Planet's Vacuum Planet Equation Emission Pressure (Pascal)</td><td>548.3</td><td>1,868</td></tr><tr><td>Venus Atmosphere to Mars Surface Pressure Equivalence Height (Km)</td><td>0</td><td>76.23</td></tr><tr><td>Venus Atmosphere to Mars Surface Pressure Equivalence Temperature (Kelvin)</td><td>211.8</td><td>208.27</td></tr><tr><td>Venus Atmosphere to Mars Tropopause Pressure Equivalence Height (Km)</td><td>62</td><td>>100</td></tr></table>
## i. The Planetary Differences
- $\succ$ Venus is closer to the Sun than Mars and therefore receives a greater solar radiation flux.
- > Venus is a slowly rotating world; Mars is a fast daily rotator.
- > Venus is more massive than Mars and therefore has a higher surface gravity.
- At its base the atmosphere of Venus is a high-pressure, high temperature environment.
- At its base the atmosphere of Mars is a low-pressure, low temperature environment.
- $\succ$ Venus has a high planetary Bond Albedo $(A_{\mathrm{v}})$ and is therefore visibly bright and reflective.
- $\succ$ Mars has a low planetary Bond Albedo $(A_{\mathrm{M}})$ and is therefore visibly dull and poorly reflective.
- The exit-to-space thermal radiation emission height of Venus is in the planet's stratosphere at an elevation of 71 Km.
- The exit-to-space thermal radiation emission height of Mars is in the planet's surface boundary layer at an elevation of $1.6\mathrm{Km}$.
## ii. The Atmospheric Similarities
Both Venus and Mars contain an abundance of carbon dioxide gas in their respective atmospheres (Venus $96.5\%$; Mars $95.1\%$ ).
Both Venus and Mars have an equivalent tropopause elevation (Venus 63.4 Km; Mars 62.0 Km) this is despite the massive differences in the pressure and temperature profiles of the two planet's tropospheres (Figure 3) and requires an explanation.
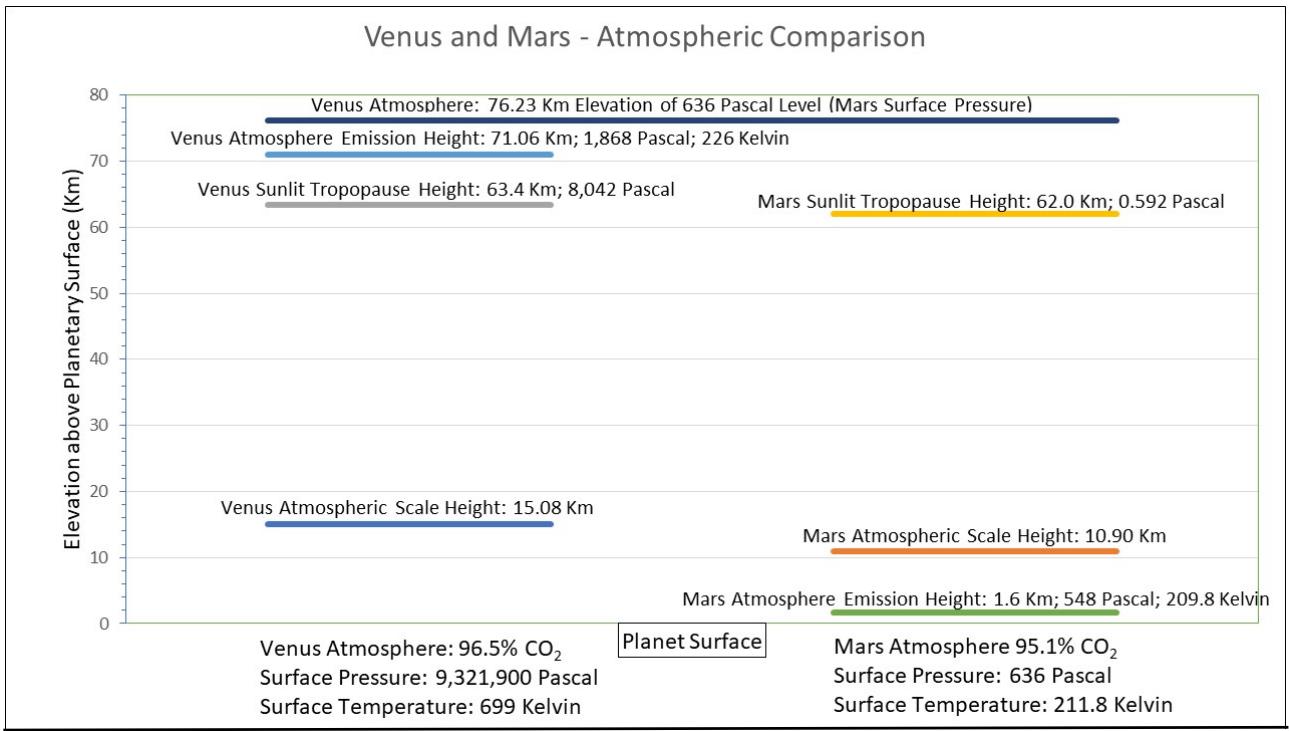 Figure 3: Venus and Mars - Atmospheric Comparison
## III. THE DYNAMIC-ATMOSPHERE ENERGY-TRANSPORT (DAET) INVERSE MODELLING STUDY OF MY29 DATA
Climate Science is built on a conceptual model that removes from its fundamental analysis the dual complementary energy environments of a lit daytime hemisphere and a dark nighttime hemisphere. By preserving these two energy environments the Dynamic-Atmosphere Energy Transport (DAET) climate model more appropriately mimics the meteorological reality of a solar lit globe [30] and the DAET model is therefore applied herein.
### a) The Vacuum Planet Equation (VPE)
Studies of the atmospheric dynamics of terrestrial solar system planets has a long and detailed history. The fundamental equation for the basis of this work is exemplified by the radiation balance equation (corrected from the published errorpers comm) used by Sagan and Chyba [15]: -
"The equilibrium temperature $T_{e}$ of an airless, rapidly rotating planet (or moon) is: -
Equation 1: $T_{\mathrm{e}} \equiv [\mathrm{S}\pi \mathrm{R}^{2}(1 - \mathrm{A}) / 4\pi \mathrm{R}^{2}\varepsilon \sigma]^{1 / 4}$
where $\sigma$ is the Stefan-Boltzmann Constant (S-B), $\varepsilon$ the effective surface emissivity, A the wavelength-integrated Bond albedo, R the planet's (or moon's) radius (in metres), and S the solar constant (in Watts/m2) at the planet's (or moon's) average orbital distance from the sun." [15]. Equation 1 is hereafter called the Vacuum Planet Equation (VPE).
b) The Issues of Absorptance $\alpha$, Reflectance $\rho$ and Emittance $\varepsilon$
The Absorptance $\alpha$ of the surface of a material is its effectiveness in absorbing radiant energy. Absorptance is the ratio of the absorbed to the incident radiant power.
The Reflectance $\rho$ of the surface of a material is a measure of its capability to reflect radiant energy. Reflectance is defined as the fraction of incident radiation reflected by a surface or discontinuity.
For an incident beam of unit power striking a material surface the Absorptance $\alpha$ plus Reflectance $\rho$ is unity because energy is conserved.
Equation 2: $\alpha +\rho = 1$
Emittance $\varepsilon$ is the ratio of radiant exitance of a thermal radiator to that of a full radiator (black-body) at the same temperature. As such Emittance $\varepsilon$ is the low-frequency radiant converse of Absorptance $\alpha$ and is less than unity because of the missing component of energy lost to the absorbing surface by Reflectance $\rho$. For a surface at thermal radiant equilibrium the amount of insolation energy absorbed is equal to the amount of thermal radiant energy emitted, therefore $\varepsilon = \alpha$ and consequently Kirchhoff's Law applies [31]:
Equation 3: $\varepsilon +\rho = 1$
As a material body with zero reflectance would be a black-body (Kirchhoff's Law of Thermal Radiation) and the surface is in fact a grey-body it follows therefore that reflectance must be included in the computation of the total energy budget.
c) The role of Bond Albedo (A) in the Atmospheric Energy Budget In equation 1 the wavelength-integrated Bond Albedo A reduces the power of the solar irradiance that acts within the planetary climate system. The Bond Albedo is a bypass filter that records the planetary brightness and removes from the climate budget the solar energy flux that exits the planetary atmosphere and returns to space as unaltered high frequency radiation. Therefore, it is axiomatic that all the high frequency energy flux post-albedo (1-A) is degraded to low frequency thermal radiant flux by the processes of light interception, both in the planet's atmosphere and at the physical surface. For the planet Mars there are three main processes that capture insolation energy. These are:
1. Atmospheric dust which generates the visibility obscuring haze, warms the atmosphere and so reduces the power of the insolation that reaches the surface [32].
2. The physical surface which absorbs insolation energy by absorptance $\mathbf{a}$.
3. The action of surface reflectance $\rho$ that creates a process of near surface backlighting of the dust in the boundary layer of the lower atmosphere.
N.B. Although the Martian surface is obviously visible, this lit surface reflects the insolation of necessity already incorporated into the Bond Albedo $(A_{\mathsf{M}})$. Consequently, the insolation energy rejected by the surface $\{(1 - A_{\mathsf{M}})^{\star}\rho\}$ must be absorbed by the atmosphere, otherwise the black body status for the thermal emission temperature of the planetary globe that is demonstrated by setting the emissivity to value 1 in the Vacuum Planet Equation could never be achieved (Table 7).
### d) Global Average Temperature Calculations
The Black-body temperature $T_{\mathrm{e}}$ for Mars is 209.8 Kelvin, this value is achieved by setting the emissivity $\varepsilon$ to unity in the VPE (Equation 1), however the observed mean surface temperature for this planet is $T_{\mathrm{s}} = 211.8$ K (this study) therefore the difference $\Delta T$ between $T_{\mathrm{e}}$ and $T_{\mathrm{s}} = 2.0$ Kelvin which is the atmospheric thermal enhancement effect for Mars. (Table 7).
Emissivity is an intrinsic property of the material composition of the planetary surface of Mars, and as such surface emissivity is independent of the nature and presence of an overlying atmosphere. When the surface emissivity is set to unity this parameter adjustment includes in the VPE the missing component of high frequency reflectance energy that must have been absorbed by the atmosphere.
Clearly for Mars the 0.25 Bond Albedo, which is applied for the process of insolation energy filtering, must already incorporate into its value any planetary surface reflectance of insolation that is lost to space. Consequently, the post-albedo insolation energy flux $(1 - A_{\mathrm{M}})$ that illuminates the surface must all be captured by atmospheric opacity and converted into thermal energy for use within the dynamics of the Martian climate system.
Table 7: The Global Thermal Emission Black-body Temperature $T_{e}$ of Mars compared with its actual Surface Temperature $T_{s}$
<table><tr><td>Parameter</td><td>Symbol</td><td>Mars</td><td>Units</td><td>Dimensions</td></tr><tr><td>Solar Constant at distance a</td><td>S</td><td>586.2</td><td>W/m2</td><td>MT-3</td></tr><tr><td>Radius of Body</td><td>R</td><td>3,376,200</td><td>m</td><td>L</td></tr><tr><td>Bond Albedo</td><td>A</td><td>0.25</td><td>Constant</td><td>Constant A</td></tr><tr><td>Effective energy capture</td><td>α + ρ</td><td>1</td><td>Constant</td><td>Constant</td></tr><tr><td>Surface Power</td><td></td><td>109.913</td><td>W/m2</td><td>MT-3</td></tr><tr><td>Stefan-Boltzmann Constant</td><td>σ</td><td>5.67E-08</td><td>W/m2/K4</td><td>MT-3K-4</td></tr><tr><td>Expected Te</td><td>Te</td><td>209.8</td><td>Kelvin</td><td>K</td></tr><tr><td>Atmospheric Thermal Enhancement</td><td>ATE</td><td>2.0</td><td>Kelvin</td><td>K</td></tr><tr><td>Actual Ts</td><td>Ts</td><td>211.8</td><td>Kelvin</td><td>K</td></tr><tr><td>Distance from the Sun</td><td>a</td><td>2.2793E+11</td><td>m</td><td>L</td></tr></table>
The issue of reflectance is fundamental to climate science because the quantity of energy is always conserved. Therefore, a surface with an emissivity of $< 1$ (a grey-body) will always report a S-B temperature that is lower than the planetary emission temperature, because the planetary radiant emission temperature that is seen externally incorporates all the surface solar reflectance energy flux that has been converted to thermal energy by the presence of the atmosphere.
### e) Estimation of Mars Global Surface Emissivity
For the purposes of the modelling analysis presented here it has been assumed that the Global Octon Night time temperature of 202.5 Kelvin for MY29 [6] is a function of the average surface emittance of Mars (Table 5). The proposition being applied is that the unlit nighttime surface acts as a radiator that exits thermal radiant energy directly to space via an unimpeded atmospheric window. Further that the diurnal temperature range for Mars is generated solely by the process of adiabatic thermal enhancement, because the diabatic thermal radiant opacity of the semi-transparent Martian atmosphere is effectively energy neutral. Based on this proposition applying the Vacuum Planet Equation with a global average solar irradiance of 109.9 W/m2 reports an emissivity of 0.87 (Table 8) as the surface flux parameter that generates an average nighttime surface temperature of 202.5 Kelvin (Table 5).
Table 8: The Effective Surface Emissivity $\varepsilon$ for Mars that generates a MY29 data derived Nighttime Surface Temperature of 202.5 Kelvin
<table><tr><td>Parameter</td><td>Symbol</td><td>Mars</td><td>Units</td><td>Dimensions</td></tr><tr><td>Solar Constant at distance a</td><td>S</td><td>586.2</td><td>W/m2</td><td>MT3</td></tr><tr><td>Radius of Body</td><td>R</td><td>3,376,200</td><td>m</td><td>L</td></tr><tr><td>Bond Albedo</td><td>A</td><td>0.25</td><td>Constant</td><td>Constant A</td></tr><tr><td>Effective surface emissivity</td><td>ε</td><td>0.87</td><td>Constant</td><td>Constant ε</td></tr><tr><td>Surface Power</td><td></td><td>95.346</td><td>W/m2</td><td>MT3</td></tr><tr><td>Stefan-Boltzmann Constant</td><td>σ</td><td>5.67E-08</td><td>W/m2/K4</td><td>MT-3K-4</td></tr><tr><td>Expected Te</td><td>Te</td><td>202.5</td><td>Kelvin</td><td>K</td></tr><tr><td>"Greenhouse Effect"</td><td>GE</td><td>9.3</td><td>Kelvin</td><td>K</td></tr><tr><td>Actual Ts</td><td>Ts</td><td>211.8</td><td>Kelvin</td><td>K</td></tr><tr><td>Distance from the Sun</td><td>a</td><td>2.2793E+11</td><td>m</td><td>L</td></tr></table>
Using this solid surface emissivity value of $\varepsilon = 0.87$ and applying an estimated atmospheric dust absorptance of $\alpha = 0.8$ [33], the DAET model percentage of dust dimming that generates a global average air temperature of 211.8 Kelvin can now be determined by inverse modelling.
Table 9: Martian Climate Metrics
<table><tr><td colspan="2">Martian Climate Metrics</td></tr><tr><td>A: Mars Top Of Atmosphere (TOA) Solar Irradiance W/m2</td><td>586.20</td></tr><tr><td>B: Mars Bond Albedo</td><td>0.250</td></tr><tr><td>C: TOA Post-Albedo Solar Irradiance W/m2</td><td>219.83</td></tr><tr><td>D: Insolation Absorbed by Obscuring Atmospheric Dust Haze%</td><td>3.11%</td></tr><tr><td>D: Dust Absorptance α</td><td>0.80</td></tr><tr><td>D: Insolation Absorbed by Obscuring Atmospheric Dust Haze W/m2</td><td>5.48</td></tr><tr><td>G: Martian Lit Hemisphere Average Surface Illumination W/m2</td><td>214.35</td></tr><tr><td>E: Effective surface emissivity ε</td><td>0.867</td></tr><tr><td>E: Martian Lit Hemisphere Average Surface Absorption W/m2</td><td>185.94</td></tr><tr><td>F: Lit Surface Reflectance (1-ε) (Atmospheric Back-Lighting)</td><td>0.13</td></tr><tr><td>F: Martian Lit Hemisphere Average Back-Lighting W/m2</td><td>28.41</td></tr><tr><td>Global Surface Area of Lit Tropical Cell</td><td>84.26%</td></tr><tr><td>Global Surface Area of Lit Polar Cell</td><td>15.74%</td></tr><tr><td>Global Surface Area of UnlitTropical Cell</td><td>76.59%</td></tr><tr><td>Global Surface Area of Unlit Polar Cell</td><td>23.41%</td></tr></table>
This value is estimated to be an average dust haze dimming of $3.11\%$ for the MY29 planetary atmospheric temperature data (Table 9).
### f) Mars Global Average Emissivity (MGAE) Sensitivity Test
The Mars Global Average Emissivity (MGAE) used herein is derived from matching the VPE for Mars to the average annual night time surface air temperature. Assuming a diabatic transfer of thermal flux energy from the air to the surface and an open atmospheric window then the surface emissivity is calculated to be $\varepsilon = 0.876$. Using this value, a dust haze solar flux dimming of $3.11\%$ is calculated by DAET inverse modelling for a GAT constraint of 211.8 Kelvin.
Conversely Savijärvi, et. al. (2005) [3] report that the Martian air absorbs $1\%$ of Solar Radiation and that the Solar attenuation by dust is $26\%$ at the solar zenith. Using their value of a global dust haze solar flux dimming of $1\%$ then the MGAE value can also be determined by DAET inverse modelling for a GAT constraint of 211.8 Kelvin. The DAET climate model reports that $\varepsilon = 0.880$ in this case. This simple sensitivity test demonstrates that as the dust opacity weakens and the air captures less solar energy, then the surface must become darker and absorb more insolation to allow the DAET model to report the GAT constraint of 211.8 Kelvin.
In a dynamic environment such as the dust laden troposphere of Mars both dust opacity and clear sky surface albedo are observed to vary[34], for example by dark dust storm deposits occurring on the bright polar icecaps during summer solstice when the Tropical convection cell expands to become hemisphere encompassing (Figures1.c, 2.c). The relative stability of the calculated MGAE under different dust loadings supports the modelling hypotheses of using the VPE with an assumption of a fully open atmospheric window and suggests that global surface temperature values are a key component of dust circulation vigour [7].
### g) DAET Model Design Features
There are three key facts about planetary atmosphere on terrestrial globes that determine the climatic response of the atmospheric system: -
1. That the presence of even a fully thermally radiant transparent mobile-fluid atmosphere raises the global average surface temperature above that of a rotating vacuum world.
2. That this thermally radiant transparent atmosphere both retains and recycles solar energy, and achieves a stable energy flow across the planet's surface.
3. The stable limit of the energy flow within the system is set by the partition ratio of energy between the radiant loss to space of the emitting surface of both
hemispheres, and the quantity of energy retained and recycled by the air.
The action of atmospheric heating by insolation involves the collection of energy by the following four physical processes:
1. The interception of down welling solar energy by atmospheric particles (dust and aerosols) and absorptive polyatomic gases thereby heating the atmosphere.
2. The action of conduction whereby the lit hemisphere solar heated solid surface warms the basal air layer above the ground by physical contact.
3. The action of convection whereby the warmed basal atmospheric layer parts company from the heated surface by the gravity involved process of buoyancy mediated vertical translation of air.
4. The process of thermal radiant opacity whereby the mean free path of thermal radiant energy is significantly less than the physical width of the atmospheric layer being traversed by the upwelling beam of radiant energy.
Each of these four physical processes behaves as either an energy balance or diabatic process (processes 1, 2 and 4) or as an energy imbalance or adiabatic process (process 3). It is process 3, adiabatic convection that permits the flux-gate mediated storage of thermal kinetic and gravitational potential energy within the mobile fluid medium being impacted by a radiant energy flux in the presence of a gravity field.
In the case of the low-pressure atmosphere of Mars the energy flux from the lit solar heated solid surface into the overlying atmosphere is a diabatic process whereby $50\%$ of the flux is transmitted into the atmosphere by conduction and $50\%$ of the flux is directly lost to space via the atmospheric window.
The action of atmospheric cooling involves the loss of energy by the following two physical processes:
1. Thermal radiant emission to space where the opacity interception window is open. This takes place either through the surface atmospheric window[35] or through low density air of whatever composition at air pressures typically below 0.1 bar [13]. N.B. the physical cooling of an air mass as it rises away from the ground surface under the action of convection is not an energy loss process.
2. Vibrational flexure associated with either the asymmetric bending motion of polyatomic molecules (those gases with three or more covalent bonded atoms) or the propagation of flexural shear waves through physical solids (either the planetary surface or atmospheric dust, aerosols, and ice particles). N.B. Shear wave flexure of a solid is the coupling mechanism that permits the loss of kinetic energy (a mass motion quality) from a physical material and its transformation into radiant energy
(an electromagnetic quality). Because fluids and gases cannot transmit shear waves, these fluid media therefore rely on the presence of embedded particles that can sustain flexure (dust, aerosols, ice, and polyatomic gases) to facilitate the process of radiant cooling from their physical mass.
climate model replicates a series of descending fractions (halves-of-halves); the infinite summation of which has as its limit the finite number one. The computational process used to generate the stable number outcome of a mean global surface air temperature is shown in Table 10.
### h) DAET Model Design Structure
The mathematical design for the structure used in the Dynamic-Atmosphere Energy-Transport (DAET)
Table 10: The Dynamic-Atmosphere Energy-Transport (DAET) Computational Sequence
<table><tr><td>Action</td><td>Initial</td><td>Final</td><td>Gain</td><td>Partition</td><td>Recycled</td><td>Comments</td></tr><tr><td>A: Mars Top Of Atmosphere (TOA) Solar Irradiance W/m2</td><td>586.20</td><td>586.20</td><td>1</td><td></td><td></td><td></td></tr><tr><td>B: Mars Bond Albedo</td><td>0.25</td><td>0.250</td><td>1</td><td></td><td></td><td></td></tr><tr><td>C: Post-Albedo Solar Irradiance W/m2</td><td>219.83</td><td>219.83</td><td>1</td><td></td><td></td><td></td></tr><tr><td>D: Lit Hemisphere Atmospheric Dust Solar Energy Absorption W/m2</td><td>5.48</td><td>5.48</td><td>1</td><td></td><td>6.57</td><td>(D-K)*2: (Dust capture minus direct loss) all times by two</td></tr><tr><td>E: Lit Hemisphere Surface Absorbed Solar Radiation W/m2</td><td>185.94</td><td>185.94</td><td>1</td><td></td><td>240.88</td><td>(E-H)*2: (Surface capture minus direct loss) all times by two</td></tr><tr><td>F: Martian Lit Hemisphere Surface Boundary Layer Back-Lighting W/m2</td><td>28.41</td><td>28.41</td><td>1</td><td></td><td>56.81</td><td>F*2: Reflectance times two [Fully opacity quenched with no losses]</td></tr><tr><td>U: Total Flux Powering the Lit side Surface (E+R) W/m2</td><td>185.94</td><td>262.01</td><td>1.4090874</td><td></td><td>304.26</td><td>((D-K)+(E-H)+F)*2: Daytime Budget: Generated by the Adiabatic Convection of Captured Solar Energy</td></tr><tr><td>H: Lit side Surface Thermal Radiant Loss to Space W/m2</td><td>46.49</td><td>65.50</td><td>1.4090874</td><td>25%</td><td></td><td></td></tr><tr><td>I: Reduced Lit Surface Thermal Flux after Atmospheric Window Loss (U-H) W/m2</td><td>139.46</td><td>196.51</td><td>1.4090874</td><td>75%</td><td></td><td></td></tr><tr><td>J: Total Lit side Atmospheric Thermal Flux (H+O-F) W/m2</td><td>173.34</td><td>230.39</td><td>1.32912047</td><td></td><td></td><td></td></tr><tr><td>K: Day Lit Atmospheric Dust Diabatic Energy Loss to Space W/m2</td><td>2.19</td><td>2.19</td><td>1</td><td>50%</td><td>67.69</td><td>Daylit Flux Loss to Space from Solid Surface and Illuminated Dust (Figure 1)</td></tr><tr><td>L: Lit side Top of Atmosphere Thermal Radiant Loss to Space W/m2</td><td>57.05</td><td>76.07</td><td>1.33333333</td><td>33.33%</td><td>143.76</td><td>H+K+L: Total Flux lost to Space from the Daylit side (Figure 1)</td></tr><tr><td>N: Lit side Tropical Cell Thermal Reservoir (Adects to Dark side) W/m2</td><td>114.10</td><td>152.13</td><td>1.33333333</td><td>66.67%</td><td>152.13</td><td>This is the Active Flux that passes thru the Nighttime Reservoir (Figure 1)</td></tr><tr><td>Nighttime Budget: Adiabatic Circulation of Net Insolation minus Litside Atmospheric Loss W/m2</td><td></td><td>228.20</td><td></td><td></td><td>76.07</td><td>This is the Stable Flux that is Retained in the Nighttime Reservoir</td></tr><tr><td>O: Dark side Surface Thermal Radiant Loss to Space W/m2</td><td>28.52</td><td>38.03</td><td>1.33333333</td><td>25%</td><td></td><td></td></tr><tr><td>P: Reduced Dark Surface Flux after Atmospheric Window Loss W/m2</td><td>85.57</td><td>114.10</td><td>1.33333333</td><td>75%</td><td></td><td></td></tr><tr><td>Q: Dark side Top of Atmosphere Radiant Loss to Space W/m2</td><td>28.52</td><td>38.03</td><td>1.33333333</td><td>33.33%</td><td>76.07</td><td>O+Q: Total Flux lost to Space from the Night side (Figure 1)</td></tr><tr><td>R: Dark side Polar Atmosphere Thermal Retention (P-Q): Adects to Tropics W/m2</td><td>57.05</td><td>76.07</td><td>1.33333333</td><td>66.67%</td><td></td><td></td></tr><tr><td>V: Total Thermal Radiant Energy Exiting to Space (H+K+L+O+Q) W/m2</td><td>162.78</td><td>219.83</td><td>1.35048085</td><td></td><td>219.83</td><td>Balances with C: the post-Albedo Captured Insolation</td></tr><tr><td>W: Global Mean Air Temp (N/2+R/2) W/m2</td><td></td><td>114.10</td><td></td><td></td><td>Kelvin</td><td>Converts via the Stefan-Boltzmann Equation to 211.8 Kelvin</td></tr></table>
Starting with the Top of the Atmosphere average annual insolation intercepted by the disk of the lit hemisphere, this flux is divided by 2 to produce the average hemisphere insolation (Action A). To this diluted flux is then applied the Bond Albedo (Action B) to generate the post-albedo flux (1-B) that is captured by the Martian Climate System and recycled internally within the Atmospheric Reservoir by non-lossy Adiabatic Convection (Table 10).
In the thin thermally radiant transparent atmosphere of Mars the surface heating process is diabatic (50% 50%). However, in the DAET model computation the surface partition ratio applied is 25% radiant flux and 75% thermal flux (Table 10). The reason for applying this ratio is because it is the solar energy that is split diabatically, whereas the convecting air above the surface air retains energy from previous flux cycles and so behaves as an energy reservoir that indefinitely retains a finite quantity of historic energy flux. The 50:50 diabatic ratio is best observed in the night time component of the model where all the energy flux is delivered by the advected air (Figure 4). The convected
air diabatically heats the unlit surface and so the upwelling surface radiant flux loss to space through the atmospheric window must equal the down welling thermal air flux delivered to this surface, therefore the 50:50 diabatic ratio applies.
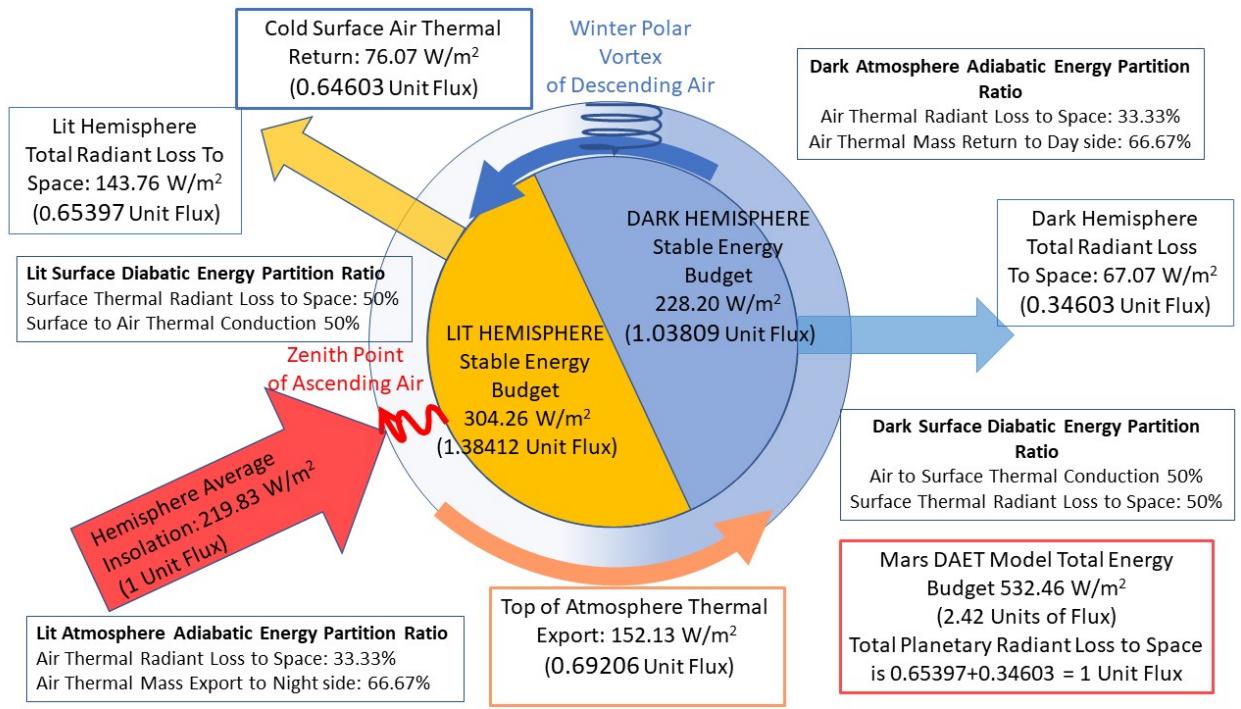 Figure 4: Stable Adiabatic Advection Model of Mars - Showing Energy Vectors and Total Energy Distributions.
In the DAET model the adiabatic partition ratio of 1/3 thermal radiant flux loss to space from the atmosphere and 2/3 thermal mass flux being retained by the mobile air (Table 10) is the application of the infinite sequence halves-of-halves doubling of flux energy in the mass motion domain. This concept of an infinite feedback series with a finite limit is already well established by Climate Science as the process of flux retention in the radiant domain of a thermally opaque atmosphere [36].
## IV. RESULTS OF APPLYING THE DUST LOSSY ADIABATIC DAET CLIMATE MODEL TO MARS
The energy budget for the atmosphere of Mars that results from the application of the computational sequence detailed in Table 10 is recorded in Table 11:
Table 11: The Martian Climatic Energy Budget. Lit Flow C: Post-Albedo Solar Irradiance W/m2 Lit side Loss to Space from Solid Emitters (H+K) Net Effective Litside Insolation (C-H-K) Daytime Budget: Adiabatic Circulation of Net Insolation Times Two (Infinite Fractional Summation Loop) Lit side Loss to Space from Atmospheric Emitters(L) Total Lit side Loss to Space (H+K+L) Nighttime Budget: Adiabatic Circulation of Net Insolation minus Litside Atmospheric Loss Mars Gross Atmospheric Budget Gains W/m2 219.83 Losses W/m2 67.69 76.07 143.76 Retention W/m2 152.13 Reservoir W/m2 304.27 228.20 532.47 Dark Flow N: Net Advection to Nightside across the Dusk Terminator Permanent Nighttime Reservoir Storage O: Nighttime Bypass Window to Space from Advection Heated Surface P: Reduced Dark Surface Flux after Atmospheric Window Loss Q: Dark side Loss to Space from Atmospheric Emitters(N-P) Total Dark side Loss to Space (O+Q) R: Dark side Polar Atmosphere Thermal Retention (P-Q): Advects to Tropics across Dawn Terminator Mars Gross Planetary Radiation Loss to Space (H+K+L+O+Q) Gains W/m2 152.13 Losses W/m2 38.03 38.03 76.07 219.83 Retention W/m2 76.07 114.10 76.07
<table><tr><td>Lit Flow</td><td>C: Post-Albedo Solar Irradiance W/m2</td><td>Lit side Loss to Space from Solid Emitters (H+K)</td><td>Net Effective Litside Insolation (C-H-K)</td><td>Daytime Budget: Adiabatic Circulation of Net Insolation Times Two (Infinite Fractional Summation Loop)</td><td>Lit side Loss to Space from Atmospheric Emitters(L)</td><td>Total Lit side Loss to Space (H+K+L)</td><td>Nighttime Budget: Adiabatic Circulation of Net Insolation minus Litside Atmospheric Loss</td><td>Mars Gross Atmospheric Budget</td></tr><tr><td>Gains W/m2</td><td>219.83</td><td></td><td></td><td>304.27</td><td></td><td></td><td></td><td></td></tr><tr><td>Losses W/m2</td><td></td><td>67.69</td><td></td><td></td><td>76.07</td><td>143.76</td><td></td><td></td></tr><tr><td>Retention W/m2</td><td></td><td></td><td>152.13</td><td></td><td></td><td></td><td></td><td></td></tr><tr><td>Reservoir W/m2</td><td></td><td></td><td></td><td>304.27</td><td></td><td></td><td>228.20</td><td>532.47</td></tr><tr><td>Dark Flow</td><td>N: Net Advection to Nightside across the Dusk Terminator</td><td>Permanent Nighttime Reservoir Storage</td><td>O: Nighttime Bypass Window to Space from Advection Heated Surface</td><td>P: Reduced Dark Surface Flux after Atmospheric Window Loss</td><td>Q: Dark side Loss to Space from Atmospheric Emitters(N-P)</td><td>Total Dark side Loss to Space (O+Q)</td><td>R: Dark side Polar Atmosphere Thermal Retention (P-Q): Advects to Tropics across Dawn Terminator</td><td>Mars Gross Planetary Radiation Loss to Space (H+K+L+O+Q)</td></tr><tr><td>Gains W/m2</td><td>152.13</td><td></td><td></td><td></td><td></td><td></td><td></td><td></td></tr><tr><td>Losses W/m2</td><td></td><td></td><td>38.03</td><td></td><td>38.03</td><td>76.07</td><td></td><td>219.83</td></tr><tr><td>Retention W/m2</td><td></td><td>76.07</td><td></td><td>114.10</td><td></td><td></td><td>76.07</td><td></td></tr></table>
Note the significant figure rounding issue in the Excel table $(152.13^{*}2 = 304.27)$ for the calculation of the Retained Net Effective Insolation (C-H-K = 152.13(5) W/m2), which is the post-albedo insolation that the lit hemisphere captures {C} minus the lit surface thermal loss to space via the atmospheric window (H) and from entrained dust (K). This flux energy value is doubled by the summation process of infinite planetary adiabatic circulation (Table 10) to form the lit side Atmospheric Reservoir of 304.26(7) W/m2 (Table 11).
The energy budget parameters recorded in Table 11 are shown diagrammatically in Figure 5.
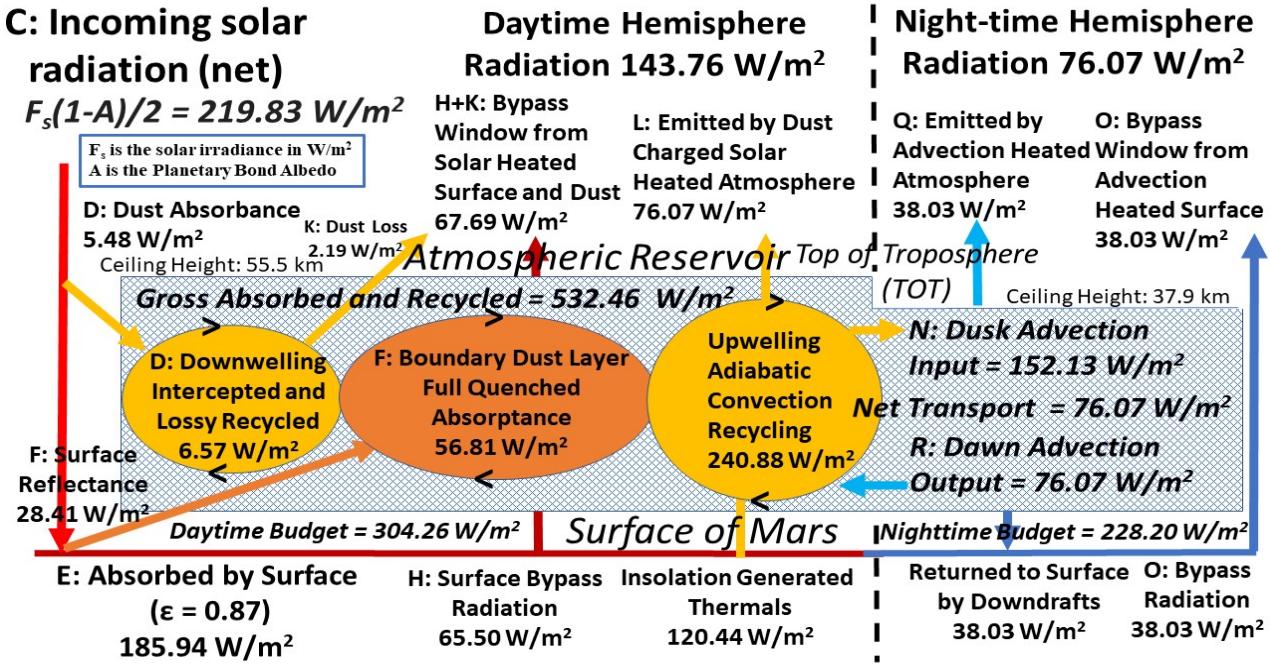 Figure 5: The Atmospheric Energy Flux Reservoir of Dust Opaque Mars Generated by the Adiabatic Convection Recycling of Surface Thermal Conduction Energy
## V. DISCUSSION
The climate modelling analysis presented here is based on the following propositions:
1. That Climate Science is fundamentally engaged in the study of atmospheric thermal radiant opacity.
2. That the planet Mars when observed from space acts as a black-body thermal radiant emitter $(\varepsilon = 1)$ [14].
3. That the surface to spaceatmospheric window for Mars is completely open. A comparison with the stratospheric pressure profile from the Venus carbon dioxide atmosphere demonstrates that the low-pressure carbon dioxide troposphere of Mars is fully transparent to surface thermal radiation (Figure 3).
4. On applying the Vacuum Planet Equation (VPE) to the MY29 average annual nighttime surface temperature it is established that the surface emittance of the planet Mars is $\varepsilon = 0.87$ (Table 8).
5. That because Kirchhoff's Law applies $(\varepsilon + \rho = 1)$ it necessarily follows that all the post-albedo solar reflectance $\rho$ from the solid surface of Mars must be absorbed by the atmosphere, otherwise the external blackbody status of the planet $(\varepsilon = 1)$ could not be achieved.
6. That because there is a logical conflict between points #3 - full thermal radiant atmospheric transparency and #5 - full thermal radiant atmospheric opacity, it necessarily follows that there are two separate physical mechanisms in play. These are that the low-pressure carbon dioxide atmosphere of Mars is transparent to thermal radiation, while it is the dust content that generates the thermal radiant opacity of the Martian atmosphere [7].
7. Critical to this understanding is the recognition that the absorptance of solar energy by the Martian atmosphere refers solely to the post-albedo insolation flux. It is the surface reflectance component of the pre-Albedo flux which returns directly to space that allows the surface of Mars to be observed with visible light, while it is the post-albedo component of the reflectance flux that is quenched by the dust haze in the Martian atmosphere (Figure 5).
8. The surface radiation loss to space via the atmospheric window in the DAET model is a diabatic 50/50 partition ratio and that the atmospheric window is completely open to surface thermal radiation.
9. That the calculated 2 Kelvin Atmospheric Thermal Effect for the planet Mars is a consequence of the infinite halves-of-halves recycling of energy flux by the atmospheric mass motion of convection
between the solar heated lit surface of Mars and the unlit dark hemisphere of the planet's nighttime surface.
10. This infinite sum of decreasing fractional quantity retained by the circulation of the air is a direct functional equivalence to and has the same mathematical form as the radiant flux process of energy loss to space from a thermally radiant opaque atmosphere that is invoked by the standard climate model paradigm [36].
11. The DAET modeled flux that maintains the nighttime atmosphere in balance is higher than the diurnal circulating flux (Table 11). The presence of a "stable level" flux datum for the nighttime atmospheric reservoir is confirmation of the need for the structure of the atmospheric circulation cell to be maintained against the force of gravity.
12. That in establishing from MY29 temperature data that the surface emittance for Mars $\varepsilon = 0.87$ it follows that the average surface temperature of the planet will be lower than the thermal emission temperature as observed from space ( $\varepsilon = 1$ ). This conflict in emissivity values generates the misconception of a negative greenhouse effect in the Martian atmosphere in which the surface is indeed observed to be colder than the atmosphere above it [24].
13. The MY29 temperature data clearly shows the presence of a boundary layer thermal inversion at the planet's lit hemisphere surface, particularly at high latitudes with correspondingly low solar elevations (Figure 6). Surface atmosphere thermal inversions are typically a nighttime phenomenon and to observe this feature under daytime surface insolation requires explanation.
14. It is proposed here that dust absorptance of surface reflectance during daylight captures into the surface boundary layer the solar energy required to produce the observed surface inversion (Figure 6). Consequently, the atmospheric inversion is paradoxically a feature of atmospheric solar heating by dust presence and not of surface to space radiative cooling via the atmospheric window.
15. The structural form, seasonal variation, and physical height of the tropopause for both the Tropical and Polar cells is a manifestation of atmospheric circulation dynamics under daytime insolation forcing and dark surface radiative cooling (Figures 1, 2).
16. The locus of energy loss for the planet's surface is located over the poles (Figure 7), with particular focus at the respective winter pole of continuous darkness (Figure 8).
17. During each Equinox there is a symmetrical balance between the structure of the Tropical and Polar atmospheric cells (Figure 7).
18. At the Solstice the Tropical Tropopause completely overrides the Polar Tropopause of the continuously lit pole. Note the curious feature of the night time
teleconnected residual Polar Tropopause between $40^{\circ}\mathrm{N}$ and $55^{\circ}\mathrm{N}$ that is absent from this latitude during the daytime (Figure 8).
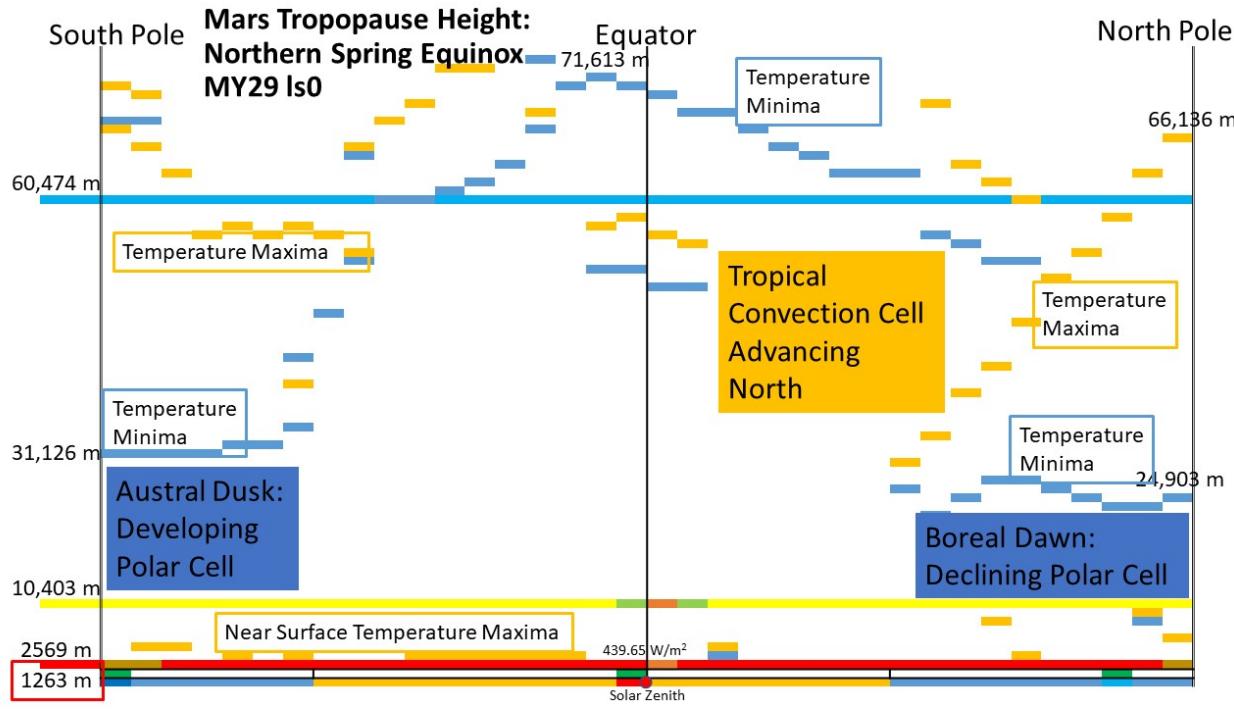
Figure 6: Lit Hemisphere Zone Mean Troposphere Transect for Octon 0 MY29
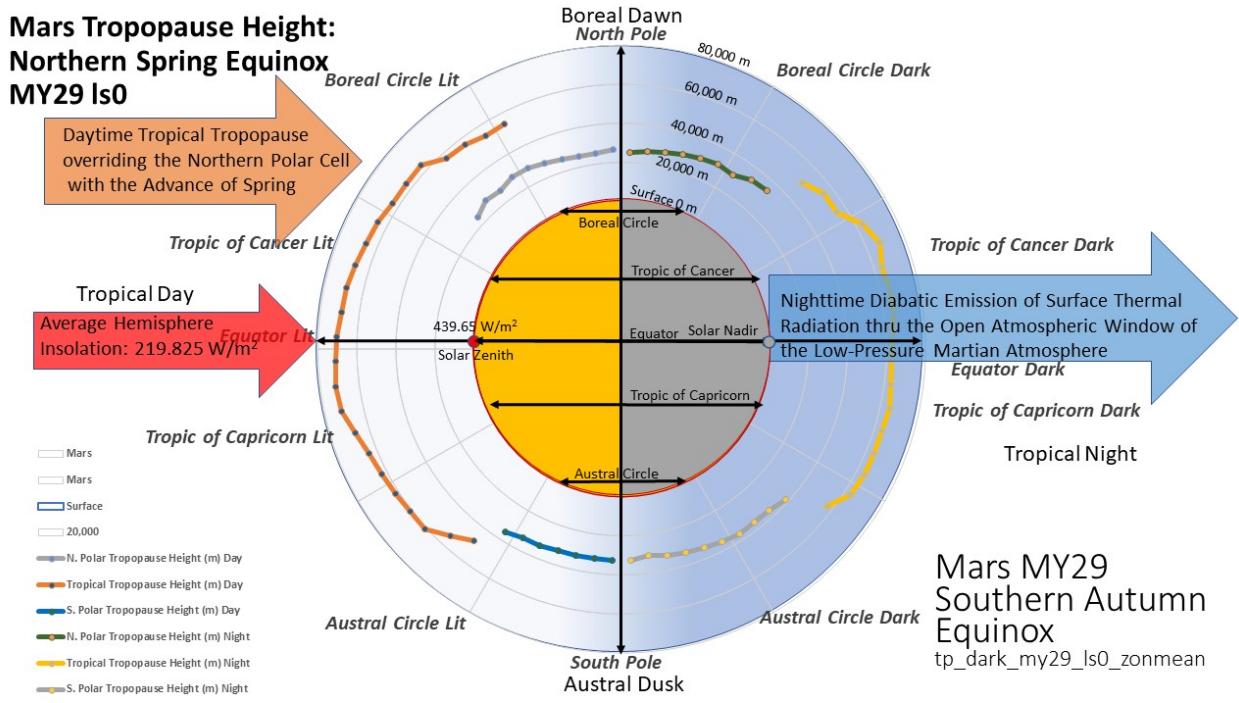
Figure 7: Mars Tropopause Height: Northern Spring Equinox MY29 ls0.
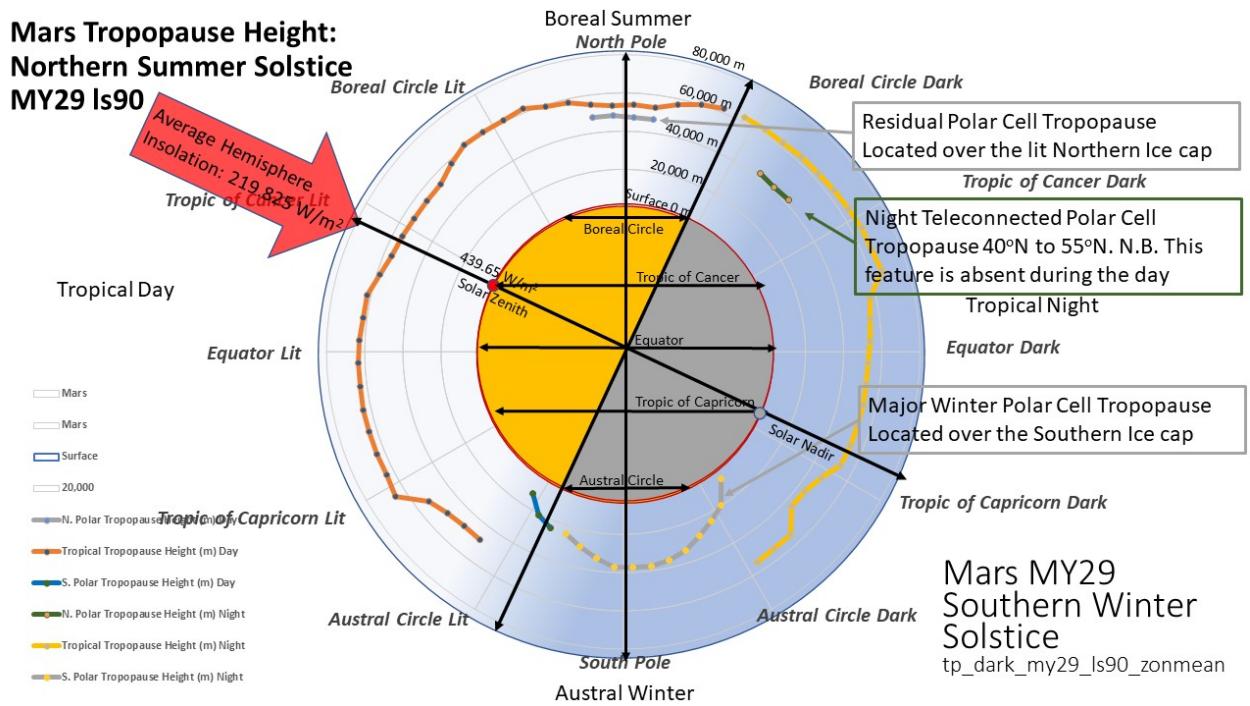 Figure 8: Mars Tropopause Height: Northern Summer Solstice MY29 ls90.
## VI. CONCLUSIONS
1. In the low-pressure carbon dioxide atmosphere of Mars, the atmospheric window is completely open and consequently the air on Mars is fully transparent to surface to space thermal radiation.
2. Based on the MY29 data global annual average nighttime surface air temperature of global 202.5 Kelvin and the presence of a fully open atmosphere window, the surface emittance for the planet Mars is calculated as 0.87 using the Vacuum Planet Equation.
3. That the insolation energy flux component of the post-albedo surface reflectance is fully absorbed by the atmospheric dust opacity of the planetary surface boundary layer.
4. That for the lit hemisphere the presence of an atmospheric inversion, whereby the temperature of the solid surface is lower than the overlying air, is a direct consequence of the back-lighting process of the absorption of surface reflectance insolation by the dust content of the surface boundary layer.
5. That the Atmospheric Thermal Effect, defined as the difference between the global annual average surface air temperature, and the effective planetary thermal radiant emission temperature is 2 Kelvin.
6. That the explanation for the 2 Kelvin Atmospheric Thermal Effect is because of atmospheric dust opacity and the presence in the Martian atmosphere of a non-lossy adiabatic convection cycle that transports the captured surface tropical solar energy surplus and delivers this surplus to the polar regions of energy deficit.
7. The concept of a negative green house effect for the planet Mars, defined as the difference between the grey-body surface emittance radiant temperature and the planetary black body emittance radiant temperature, is resolved by accounting for the role of surface reflectance in Kirchhoff's Law and the quenching of solar back-lighting by surface boundary layer dust opacity.
8. The application of the DAET climate model to the MY29 atmosphere temperature data demonstrates that, even in the presence of a fully gaseous transparent atmosphere, adiabatic circulation flux doubling occurs and that this non-lossy process explains the retention of thermal energy in the Martian atmosphere.
9. The weight of the atmosphere that needs to be supported against gravity includes the dust particles present at any given time. That weight varies with the vigour of adiabatic convection. The clearer the atmosphere of dust the more the surface heats and the stronger the adiabatic convection becomes. That increased convection strength lifts more dust which cools the surface by increasing albedo until the strength reduces again and dust clears and falls back to the ground for the cycle to begin again.
10. The effect of this cyclical atmospheric see-saw explains why the planet Mars experiences periodic planet-wide dust storms [37,38] with a potential trigger being the overwhelming and disappearance of the southern polar cell by the tropical cell soon after the southern spring equinox (Figure 2b) whereas the northern polar cell is maintained in
some form during the full course of the northern hemisphere summer (Figure 1).
### ACKNOWLEDGEMENTS
The authors thank Dr Nigel G. Heavens for his kind assistance in providing the source panel data of the Zonal average temperature nightside and dayside retrievals for MY29 that informs this study [39]. These data comprise the first Martian year and a half of observations by the Mars Climate Sounder aboard the Mars Reconnaissance Orbiter.
#### Conflict of Interest
The authors have received no funding from any source in the execution of this work.
#### Citations
- Absorptance, $\alpha$, emittance, $\varepsilon$ reflectance, $\rho$: IUPAC. Compendium of Chemical Terminology, 2nd ed. (the "Gold Book"). Compiled by A. D. McNaught and A. Wilkinson. Blackwell Scientific Publications, Oxford (1997). Online version (2019-) created by S. J. Chalk. ISBN 0-9678550-9-8. https://doi.org/10.1351/goldbook.
- Blackbody Radiation and Planck's Law: A blackbody is defined as a perfect radiator which absorbs all radiation incident upon it.
- Kirchhoff's Law and Emissivity: Gustav Robert Kirchhoff (1824–1887) stated in 1860 that "at thermal equilibrium, the power radiated by an object must be equal to the power absorbed." This leads to the observation that if an object absorbs 100 percent of the radiation incident upon it, it must reradiate 100 percent. As already stated, this is the definition of a blackbody radiator.
Generating HTML Viewer...
References
39 Cites in Article
Robert Haberle,Bruce Jakosky (1990). Sublimation and transport of water from the north residual polar cap on Mars.
Gordon Pettengill,Peter Ford (2000). Winter clouds over the North Martian Polar Cap.
Hannu Savijärvi,David Crisp,Ari‐matti Harri (2005). Effects of CO<sub>2</sub>and dust on present‐day solar radiation and climate on Mars.
D Mccleese,J Schofield,F Taylor,W Abdou,O Aharonson,D Banfield,S Calcutt,N Heavens,P Irwin,D Kass,A Kleinböhl,W Lawson,C Leovy,S Lewis,D Paige,P Read,M Richardson,N Teanby,R Zurek (2008). Intense polar temperature inversion in the middle atmosphere on Mars.
N Heavens,J Benson,D Kass,A Kleinböhl,W Abdou,D Mccleese,M Richardson,J Schofield,J Shirley,P Wolkenberg (2010). Water ice clouds over the Martian tropics during northern summer.
D Mccleese,N Heavens,J Schofield,W Abdou,J Bandfield,S Calcutt,P Irwin,D Kass,A Kleinböhl,S Lewis,D Paige,P Read,M Richardson,J Shirley,F Taylor,N Teanby,R Zurek (2010). Structure and dynamics of the Martian lower and middle atmosphere as observed by the Mars Climate Sounder: Seasonal variations in zonal mean temperature, dust, and water ice aerosols.
Alexander Medvedev,Takeshi Kuroda,Paul Hartogh (2011). Influence of dust on the dynamics of the martian atmosphere above the first scale height.
Mathieu Vincendon,Cedric Pilorget,Brigitte Gondet,Scott Murchie,Jean-Pierre Bibring (2011). New near-IR observations of mesospheric CO<sub>2</sub>and H<sub>2</sub>O clouds on Mars.
A Petrosyan,B Galperin,S Larsen,S Lewis,A Määttänen,P Read,N Renno,L Rogberg,H Savijärvi,T Siili,A Spiga,A Toigo,L Vázquez (2011). THE MARTIAN ATMOSPHERIC BOUNDARY LAYER.
Ned Nikolov,Karl Zeller (2017). New Insights on the Physical Nature of the Atmospheric Greenhouse Effect Deduced from an Empirical Planetary Temperature Model.
R Venable (2017). Report on the Mars Apparition of 2007-2008.
Nicholas Heavens,David Kass,James Shirley (2019). Dusty Deep Convection in the Mars Year 34 Planet‐Encircling Dust Event.
T Robinson,D Catling (2014). Common 0.1 bar tropopause in thick atmospheres set by pressure-dependent infrared transparency.
D Williams (2022). Mars Fact Sheet NASA NSSDCA.
Carl Sagan,Christopher Chyba (1997). The Early Faint Sun Paradox: Organic Shielding of Ultraviolet-Labile Greenhouse Gases.
C Justus,R Braun (2007). Atmospheric Environments for Entry, Descent, and Landing.
Uttam Kumar,Cristina Milesi,Ramakrishna Nemani,S Raja,Weile Wang,Sangram Ganguly (2003). Partially and Fully Constrained Least Squares Linear Spectral Mixture Models for Subpixel Land Cover Classification Using Landsat Data.
M Vázquez,A Hanslmeier (2006). UV Fluxes on Other Bodies of the Solar System.
L Fenton,P Geissler,R Haberle (2007). Global warming and climate forcing by recent albedo changes on Mars.
Donald Rapp (2008). Human Missions to Mars.
F Taylor (2010). Penelope GARDNER-CHLOROS Code-switching 2009, Cambridge, Cambridge University Press ISBN 978-0-521-86264-6 (DB) et 978-0-521-68113-1 (PB).
A Lacis,J Hansen,G Russell,V Oinas,J Jonas (2013). The role of long-lived greenhouse gases as principal LW control knob that governs the global surface temperature for past and future climate change.
D Schulze-Makuch,A Méndez,A Fairén,P Von Paris,C Turse,G Boyer,A Davila,M Antonio,D Catling,L Irwin (2011). A twotiered approach to assessing the habitability of exoplanets.
Robert Haberle (2013). Estimating the power of Mars’ greenhouse effect.
Nadine Barlow (2014). Mars: An Introduction to its Interior, Surface and Atmosphere.
P Mulholland,S Wilde,N Heavens (2021). MY29 Seasonal Panels Night 18Mar21.
P Mulholland,S Wilde,N Heavens (2021). MY29 Seasonal Panels Day 18Mar21.
P Mulholland,S Wilde (2020). An Inverse Climate Modelling Study of the Planet Venus.
P Mulholland,S Wilde (2023). Mars MY29 Atmosphere Average Tables 07Jan23.
P Mulholland,S Wilde (2021). Venus Gravity Profile 01Mar21.
Max Riedl (2001). Optical Design Fundamentals for Infrared Systems, Second Edition.
H Wang,M Richardson (1999). The origin, evolution, and trajectory of large dust storms on Mars during Mars years 24-30.
S Ruff,P Christensen (1999). Thermal-infrared spectral characteristics of Martian albedo features: Clues to composition.
Joshua Bandfield (2009). Effects of surface roughness and graybody emissivity on martian thermal infrared spectra.
G Simpson (1928). G. C. SIMPSON, C.B., F.R.S., ON SOME STUDIES IN TERRESTRIAL RADIATION Vol. 2, No. 16. Published March 1928.
S Wilde,P Mulholland (2020). An Analysis of the Earth's Energy Budget.
C Leovy,R Zurek,J Pollack (1973). Mechanisms for Mars dust storms.
James Shirley,Richard Mckim,J Battalio,David Kass (2019). Orbit‐Spin Coupling and the Triggering of the Martian Planet‐Encircling Dust Storm of 2018.
N Heavens,D Mccleese,M Richardson,D Kass,A Kleinböhl,J Schofield (2011). Structure and dynamics of the Martian lower and middle atmosphere as observed by the Mars Climate Sounder: 2. Implications of the thermal structure and aerosol distributions for the mean meridional circulation.
No ethics committee approval was required for this article type.
Data Availability
Not applicable for this article.
How to Cite This Article
Stephen Paul Rathbone Wilde. 2026. \u201cThe Dust Planet Clarified Modelling Martian MY29 Atmospheric Data using the Dynamic-Atmosphere Energy-Transport (DAET) Climate Model\u201d. Global Journal of Science Frontier Research - A: Physics & Space Science GJSFR-A Volume 23 (GJSFR Volume 23 Issue A9).
Explore published articles in an immersive Augmented Reality environment. Our platform converts research papers into interactive 3D books, allowing readers to view and interact with content using AR and VR compatible devices.
Your published article is automatically converted into a realistic 3D book. Flip through pages and read research papers in a more engaging and interactive format.
Our website is actively being updated, and changes may occur frequently. Please clear your browser cache if needed. For feedback or error reporting, please email [email protected]
Thank you for connecting with us. We will respond to you shortly.