
I. INTRODUCTION
The survey shows that more people in cities find that adding a little risk factor to their lives can improve health and happiness and provide balance in life (Yeh, Stone, Churchill, Wheat, Brymer & Davids, 2016); Taiwan's nature-resource potential (NRP) lies not only in the island's many well-known mountains, but in its countless canyons, waterfalls, white water rapids, deep pools, and meandering streams. So, as affluent societies become more urbanized and leisure activities become more and more diversified, adventure or adventure tourism has become an increasingly important part of human civilization (Wang & Wang, 2018); some people pay more attention to adventure recreation activities than other people do (Chandel & Bansal, 2014), and even some families will take part in adventure recreation activities with the whole family, because parents' attitudes towards children's adventurous education have been evolving and changing (Pomfret, 2019). What is adventurous recreation? In fact, participation in adventure recreation activities will inevitably involve challenges, stimuli, fear, risks or unknown results, etc. (Yeh et al., 2016). Thus change the value of adventure recreation (Buckley, Westaway, & Brough, 2016). Some scholars found that some personality traits such as feeling-seeking and extroversion are significantly related to the influence of participation in adventure recreation activities (McEwan, Budreau, Curran & Rhodes, 2019). Some scholars also found social media to be more influential than mass media in terms of different factors (Sultana, 2018). So different people have different skills and expertise in adventure recreation activities, and different attitudes towards risks (Lepp & Herpy, 2015) and scholars studying extreme sports have also found that there is a key mediating role between risk and adventure (Keane, Eastman & Iyer, 2020). Therefore, people may get experiential value from various kinds of experiences (Wu et al., 2018). Also, the variable customer experience and innovative value significantly influence tourist satisfaction through destination image (Ristawati, Saufi, & Rinuastuti, 2019). Thus, this study aims to explore the effects of perceived risk, personality trait, and social media on experience value and satisfaction.
II. LITERATURE REVIEW
a) Adventure Recreation
Ewert (1985) points out that climbing, diving, cave safaris, and mountain climbing are often seen as typical adventure recreation activities while others are rafting, canoeing, rock climbing, gliding, mountain climbing, cross-country skiing, cave safaris and diving (Ewert & Hol lenhorst, 1989; Ewert & Hollenhorst, 1997; Robinson, 1992b); Robinson, 1992b). The research direction of adventure tourism has three different fields so far: adventure tourism experience, destination planning and development, adventure recreation management, etc.
(Cheng & Edwards, 2019). Buckley presents adventure recreation as an integral part of adventure sightseeing (Buckley, 2010). Buckley (2018) believes that adventure tourism, nature tourism, outdoor adventure, adventure recreation, etc. are actually related activities of the same type of adventure recreation. Adventure recreation and outdoor recreational tourism activities have been booming all over the world for several years. There are more and more lovers of adventure recreation activities and adventure tourism products intensively growing and appearing all over the world (Association, 2013). Therefore, this research expects to study the impact on experience value and satisfaction with participants in adventure recreation activities as the survey object, which is also one of the motivations of this research.
b) Perceived risk and Personality trait
Ewert & Hollenhorst (1989) put forward a set of lasting involvement model of adventure recreation, which divides the influence attribute area of recreation into two parts, named personal attribute, and environment properties. In terms of personal attribute, includes frequency of participation, skill experience level, locus of control, motivation, so personality traits are also one of the important aspects that affect adventure recreation. Some scholars have also found that certain personality traits (such as sensation-seeking and extroversion) are significantly related to the influence of participation in adventure recreation activities (McEwan, Budreau, Curran & Rhodes, 2019), Rotter, a scholar of social learning school, firstly developed the concept of internal and external control personality in social learning theory (Rotter, 1954, 1966). Research by Reisinger and Mavondo (2005) shows that tourists with externally controlled personality traits usually participate in leisure activities that are more peaceful, quiet, pleasant and safe, while tourists with internally controlled personality traits are more likely to actively participate in activities that induce excitement, stress, fear, risk and other risky adventure recreation activities; based on the above, the hypotheses are as follows:
Hypothesis 1A: Perceived risk and internal control personality traits have a significant positive effect on adventure recreation.
Hypothesis 1B: Perceived risk and external control personality traits have a significant positive effect on adventure recreation.
c) Personality trait, Social media and Experience value
Safko and Brake (2009) argue that social media is a gathering of people that can share information, communicate with knowledge and ideas through a dialogue medium that can create and deliver content including text, pictures, videos, etc. Social media platform can describe how to reach more user response with the success of purchasing goal (Rahman & Rashid, 2018). Weber's (2009) definition of social media is a collection of people with common interests, an online platform for sharing ideas, views and perspectives. Social media has two features: interactive and word-of-mouth. Moreover, the social media is a community world, and its content is both social and media. In the
Robinson's adventure recreation model (1992b) which can be divided into five cycles, namely: (i) Attraction: Seeking and Coping with Risk; (ii) Cognitive: Appraisal of Situational Risk; (iii) Decision Making: Approach/Withdrawal; (iv) Performance Experience; (v) Intuitive-reflective Appraisal. The fourth stage as to measure of the experience value. Mathwick, Naresh Malhotra, and Edward Rigdon (2001) test the experience value of online shopping in four elements: (i) customer return on investment (CROI), (ii) service excellence, (iii) aesthetics, and (iv) fun are adopted. In this study, social media, personality traits, and experience value are discussed and validated, while in the concept of McAlexander et al are used (2002). Based on the above, the hypotheses are as follows:
Hypothesis 2A: Internal control personality traits and experience value have a significant positive effect on adventure recreation.
Hypothesis 2B: External control personality traits and experience value have a significant positive effect on adventure recreation.
Hypothesis 3A: Internal control personality traits and social media have a significant positive effect on adventure recreation.
Hypothesis 3B: External control personality traits and social media have a significant positive effect on adventure recreation.
d) Experience value and Satisfaction
In Robinson (1992b) adventure recreation model the fifth stage is intuitive-reflective appraisal, so customer satisfaction can be measured, a study on the satisfaction and willingness to revisit of adventure recreation tourists showed that the experience characteristics of tourists will positively affect satisfaction and increase the willingness of tourists to revisit (Tapar, Dhaigude & Jawed, 2017). The expectations and experiences of tourists before and after travel will also faithfully reflect on satisfaction (Jin, Lee, & Lee, 2015). And scholars' research on hang gliders pointed out that there is a direct and indirect positive relationship between immersion satisfaction, life satisfaction and experience satisfaction in the state of sinking net (Ayazlar, & Yüksel, 2018). Based on the above, the hypothesis is as follows:
Hypothesis 4: Experience value and satisfaction have a significant positive effect on adventure recreation.
III. RESEARCH METHOD
a) Research framework
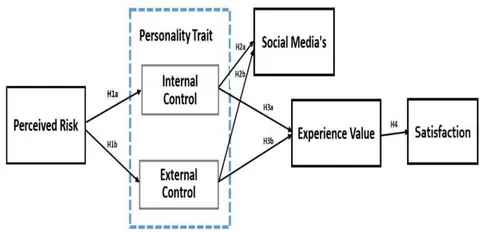
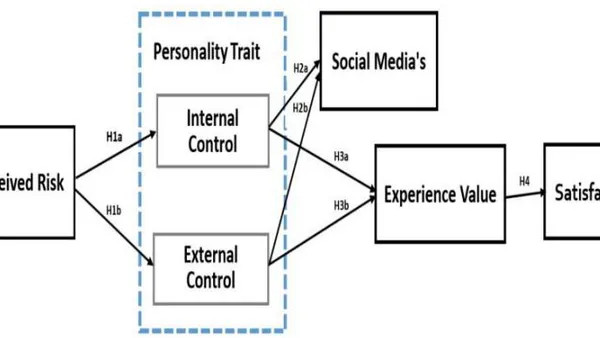
b) Questionnaire
In this study, a questionnaire was compiled based on literature discussion and related scales in reference. The questionnaire for this study is based on the following structure:
The perceived risk section in the questionnaire has a total of seven questions related to (1) Physical risk, (2) Functional risk, (3) Financial risk, (4) Performance risk, (5) Psychological risk, (6) Time risk, and (7) Social risk, (Cheron & Ritchie, 1982; Van Riper et al., 2016).
The personality trait internal control and external control section in the questionnaire is based on the Levenson's "internal, powerful others and chance scale (IPC scale)" (1974) and the scale proposed by Hoffman, Novak, and Schlosser (2003). There are total of nine questions, four questions for the internal control and five for the external control.
The social media's section in the questionnaire has a total of six questions and is based on the concept proposed by McAlexander et al (2002).
The experience value section in the questionnaire has a total of ten questions which is based on (1) customer return on investment (CROI), (2) service excellence, (3) aesthetics, and (4) fun (Charal Mathwick, Naresh Malhotra, and Edward Rigdon, 2001). These are adopted in the four elements.
The satisfaction section in the questionnaire has a total of three questions and is based on research of Harris and Goode (2004), and Wu and Liang (2011).
c) Pretest analysis
A pre-test is conducted before the official questionnaire is issued. The questionnaire survey targets are tourists who participate in water adventure recreational activities in Taiwan. A total of 165 pretest questionnaires were collected. The analysis of the critical ratio (CR) reached a significant level. All questionnaires were followed by exploratory factor analysis (EFA), with a KMO value of 0.896 > 0.7 (Hair et al., 2010). Bartlett's spherical type was significant (p < 0.05). The explanatory power of the first three factors was 33.1%, 16.6%, and 9.1%, respectively. The explanatory power of all the individual factors were no more than 50%, so there was no serious common method variation (CMV) in the sample data. The Cronbach's , meaning its reliability was acceptable, and all scales' Cronbach's values were > 0.8.
d) Sampling and Descriptive statistical analysis
The subject of this research questionnaire survey is tourists who participate in water adventure recreational activities in Taiwan. The activities include: whitewater rafting, canoeing or standup paddle, river tracing, scuba diving and skin diving, floating, and surfing. The design of the survey was based on Hoffman & Novak's (1996) and Finneran and Zhang's (2005) survey methods of actual participation in the activity. The questionnaires were collected through the assistance of the activity operator or coach or by handing out at the site of the adventure recreation activity, and the paper questionnaire or computer google will be sent out immediately after the activity. Subjects are asked to recall and evaluate their own feelings during adventure recreation activities by answering the designed questions, so as to meet the requirements of the research concept.
As shown in Table 1, a total of 425 questionnaires were issued and 386 were recovered. After deleting the invalid questionnaires such as inconsistent and incomplete answers, the total number of valid questionnaires was 314, of which 87 were whitewater rafting at most 27.7%, followed by 70 for canoe or stand paddle, 68 for river tracing, 57 for scuba diving or snorkeling, and 32 for surfing. There are 179 males and 135 females, with a total of 208 between 21-30 years old for 66.2%, while a total of 145 in the northern part of the country for 46.2% and 251 education level was college or university for 80.0%.
e) Partial Least Squares(PLS)
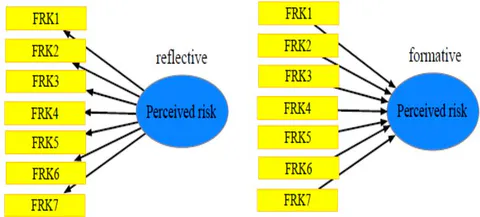
This study used Smart PLS3.3 statistical software to analyze the adventure recreational model. Urbach and Ahlemann (2010) cite statistics from the top journals MIS quarterly and information systems research (ISR) indicating a positive growth trend in the current use of partial least squares (PLS) (Ringle, Sarstedt, & Straub, 2012). The number of papers using the PLS partial least squares method is increasing, showing a positive growth trend (Henseler, Dijkstra, Sarstedt, Ringle, Diamantopoulos, Straub & Calantone, 2014). Due to the difference in the nature of the indicators, the causal order between the latent variables and the observed variables is different, which forms the relationship between reflective and formative indicators (Figure 2). Scholars such as Jarvis, MacKenzie, & Podsakoff (2003) counted top marketing journals such as JCR, JM, JMR, MS and other reflective indicators and formative indicator model settings and found that, from 1997 to 2000, up to 28% of the models have setting errors. Other scholars have also pointed out that up to 30% of the top-level asset management journals MIS Quarterly and ISR (Information Systems Research) have set errors in the model (Petter, Straub, & Rai, 2007). To judge whether it is a formative indicator, according to the research of Petter (et al., 2007) and other scholars, the characteristics of its dimension must be: the dimension of the item formation, the changing dimension of the item will also change, the non-interchangeability between the items, the question items do not have the same or similar content, deleting items may change the concept of dimensions, etc, According to research and scales based on the perceived risks dimension measurement show that the various indicators of perceptual risk should be an indivisible overall concept and must jointly determine the perceptual risk dimension (Van, Wallen, Landon, Petriello, Kyle & Absher, 2016; Cheron & Ritchie, 1982). Therefore, for this study the perceived risk building is based on the formative indicator, and the other facets which are reflective indicators. However, LISREL-SEM or AMOS cannot deal with the formative indicator. Only PLS can be used to deal with both the reflective and formative indicators when it comes to analysis of the model.
f) Analysis, Reliability, Validity
Then performed and critical ratio (CR) of each item was calculated, and the results obtained all items reached a significant level. After that, the project analysis was performed and the critical ratio (CR value) of each item was calculated, and the results obtained all items reached a significant level and it turns out that the KMO (Kaiser-Meyer-Olkin) value is 0.884 >.7, and Bartlett's ball type test is significant <.05. The factor load of all items except the perceived risk is retained because of the use of formative indicators. The load of the remaining item factors is >.6. So all items are retained (Hair, Black, Babin, Anderson, & Tatham, 2006), and the explanatory power of the first three factors are 27.6%, 19.3%, 10.7, respectively%, the explanatory power of all individual factors does not exceed 50% (Podsakoff & Organ, 1986). It can be seen that there is no CMV in the sample data.
As shown in Table 1, The reliability analysis of the scale, Cronbach's value of all facets is >.7 (Nunnally, 1978), In addition, the CR value of each facet All >.7 (Hair, Black, Babin, Anderson, & Tatham, 2010). The reliability of the scale tests its AVE >.5 (Hair et al., 2006), The factor loadings of this study are >.6, indicating that the measurement indicators of this study have good reliability.
| Construct | Items | Mean | SD | Cronbach's α | C.R. | AVE |
| perceived risk | 7 | 4.18 | 1.10 | 0.849 | 0.887 | 0.585 |
| Internal control | 4 | 5.48 | 0.90 | 0.873 | 0.908 | 0.665 |
| External control | 5 | 4.29 | 1.24 | 0.849 | 0.898 | 0.688 |
| social media's | 6 | 4.55 | 0.93 | 0.874 | 0.905 | 0.617 |
| experience value | 4 | 5.72 | 0.89 | 0.923 | 0.945 | 0.813 |
| satisfaction | 3 | 5.78 | 0.95 | 0.948 | 0.966 | 0.905 |
Table 2 shows the correlation matrix analysis of the scale. According to the two criteria proposed by scholars to test the discriminative validity, the correlation coefficient between the dimensions is <1, and the correlation coefficient between the dimensions is less than the individual Cronbach's . It can be expressed that the two dimensions have discriminative validity (Fornell & Larcker, 1981; Gaski & Nevin, 1985). In addition, Fornell and Larcker (1981) proposed the third criterion of discriminative validity. The correlation coefficient of the two facets is less than the square root of AVE, indicating that the two facets have discriminative validity (Hair et al., 2010; Shiau & Luo, 2013). The analysis of the scale of this study is shown in Table 3, which all meet the discriminant criteria suggested by the above scholars, indicating that the questionnaire has good discriminative validity.
| Construct | Cronbach's α | Perceived risk | Internal control | External control | Social media's | Experience value | Satisfaction |
| Perceived risk | 0.849 | 0.765 | |||||
| Internal control | 0.873 | 0.240 | 0.815 | ||||
| External control | 0.849 | 0.602 | 0.333 | 0.829 | |||
| Social media's | 0.874 | 0.246 | 0.173 | 0.275 | 0.785 | ||
| Experience value | 0.923 | -0.006 | 0.406 | 0.214 | 0.236 | 0.902 | |
| Satisfaction | 0.948 | -0.055 | 0.467 | 0.108 | 0.158 | 0.856 | 0.951 |
IV. RESULT AND DISCUSSION
a) Sampling and Descriptive statistical analysis
As shown in Table 1, a total of 425 questionnaires were issued and 386 were recovered. After deleting the invalid questionnaires such as inconsistent and incomplete answers, the total number of valid questionnaires was 314, of which 87 were whitewater rafting at most 27.7%, followed by 70 for canoe or stand paddle, 68 for river tracing, 57 for scuba diving or snorkeling, and 32 for surfing. There are 179 males and 135 are females, with a total of 208 between 21-30 years old for 66.2%, while a total of 145 in the northern part of the country for 46.2% and 251 education level was college or university for 80.0%.
| Personal background Number% | Personal background Number% | ||||||
| Sex | Male | 179 | 57.0% | Education | Senior high school & following | 36 | 11.4% |
| Female | 135 | 43.0% | University & college | 251 | 80.0% | ||
| Graduate & above | 27 | 8.6% | |||||
| Age | Under 20 year old | 42 | 13.4% | Birthplace | Northern Taiwan | 145 | 46.2% |
| 21-30 year old | 208 | 66.2% | Central Taiwan | 42 | 13.4% | ||
| 31-40 year old | 33 | 10.5% | Southern Taiwan | 69 | 22.0% | ||
| 41-50 year old | 19 | 6.1% | Eastern Taiwan | 49 | 15.6% | ||
| 51-60 year old | 9 | 2.9% | Taiwan Outlying Islands | 9 | 2.8% | ||
| Over 61 years old | 3 | 0.9% | |||||
b) The
In terms of perceived risk scales, the average score is 4.18, with a higher average score for physical risk functional risk. The average scores are as follows: (1) physical risk: 5.45. (2) functional risk: 5.54. (3) financial risk: 3.56. (4) performance risk: 3.44. (5) personal image 3.67. (6) time risk: 3.46, and (7) Social risk: 4.13. In the personality trait, the average is 4.82 the internal control is 5.49 and the external control is 4.29. In the external control the Change Control is 4.29 and the Powerful others controlled is 4.28. The social media is 5.31 and the experience value average is 5.72 of which (1) the CROI is 5.49, (2) the services excellence is 5.74, (3) aesthetic is 5.76, and (4) fun is 5.89. The customer satisfaction is 5.78, which shows that the tourist participants in the adventure recreation activities are satisfied with the degree of satisfaction.
c) Hypothesis testing Multiple Regression Analysis
The hypothesis 1 perceived risk and personality trait to analyze results showed that the TOL value was greater than 0.7 >0.1, VIF value is 1.0 <10, CI value is 7.69 <30. Eigenvalue is 0.033 which is >0.01, which means that the multicollinearity problem does not exist, while the R2 for 30% and the adjusted R2 is 29.7%, indicating that the variable can explain 29.7% of the variance and the standardized beta coefficient is 0.547. T-value is 11.56 (p<.001) so the analysis of perceived risk and personality traits has a significant positive correlation.
Hypothesis 2B the relationship between external control and social media to analysis results showed that the TOL is 0.915 >0.1, VIF is 1.0 <10, CI is 7.074 <30, eigenvalue is 0.039 which is >0.01, which means that the multicollinearity problem does not exist. The R2 is 8.5%, adjusted R2 is 8.2%, and the standardized beta coefficient is 0.291, T-value is 5.377 (p <.001), so they are a significant positive correlation. But in Hypothesis 2A, the relationship between internal control and social media is not significant.
Hypothesis 3A the relationship between internal control and experience value to analysis results showed that the TOL is 0.789 >0.1, VIF is 1.128 <10, CI is 7.964 and 14.969 <30, eigenvalue is 0.046 in which 0.013 of it are >0.01, which means that the multicollinearity problem does not exist. The R2 is 21.1%, and the adjusted R2 is 20.6%. The standardized beta coefficient is 0.431 and T-value is 8.062. The result of them is significant (p<.001), but hypothesis 3B between external control and experience value is not significant.
Hypothesis 4 the relationship between social media and experience value to analyze results showed that the TOL is 0.776 >0.1, VIF is 1.03 <10, CI are 10.152 and 15.702 <30, eigenvalue is 0.029 in which 0.012 of it are >0.01. R2 is 22.4% and adjusted R2 is 22.0%, standardized beta coefficient of internal control value is 0.432. T-value is 8.518 which is a significant number (p<0.001).
Hypothesis 5, the relationship between experience value and satisfaction to analyze results showed that the TOL is 0.27 >0.1, VIF value is 1.0 <10, CI value is 12.893 <30, eigenvalue is 0.012 >0.01. R2 is 73.0%, adjusted R2 is 73.0%, standardized beta coefficient is 0.855. T-value is 29.079 (p <.001) there is a significant positive correlation.
d) Hypothesis testing and analysis
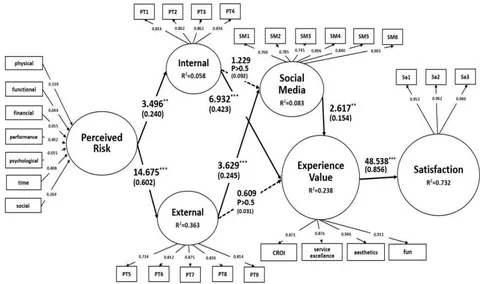
As shown in Table 5, the hypothesis that 1A and 1B are significant, indicating that the perceived risk and personality traits are positively correlated. The path coefficient of the external control is 14.675 and T value is 0.602 are higher than the 3.469 and 0.240 of the internal control, which shows that perceived risk has a greater impact on external control. Lepp and Herpy (2015) also show that different people have different attitudes towards the risk of adventure recreation activities; hypothesis 2A is not working while the result of H2B is significant, it shows that the influence is different between internal and external control to social media, social media marketing for adventure recreation activities should pay attention to the difference in internal and external control to adjust the direction of the difference in marketing and advertising; hypothesis 3A is significant but hypothesis 3B does not. It shows that the influence between internal and external control to experience value is different, Reisinger and Mavondo (2005) also shows that tourists with internal control usually participate in a more peaceful, pleasant, and safe way. Therefore, when planning external control adventure recreation tourists, the experience value can be enhanced to increase satisfaction, but for tourists with external control personality traits, you can use the aesthetic marketing of social media or the direction of inner touch to increase the value and satisfaction of the event. Finally, in H4 and H5 significant assumptions are established for leisure activities, indicating that social media will have the experience value of visitors, and experience value will also affect the satisfaction of visitors.
| Hypotheses | Path Coefficients | Standard Deviation (STDEV) | T Statistics (|O/STDEV|) | P Values | Hypotheses testing | ||
| H1a | perceived risk -> internal control | 0.240 | 0.071 | 3.496 | 0.001 | ** | support |
| H1b | perceived risk -> external control | 0.602 | 0.039 | 14.675 | 0.000 | *** | support |
| H2a | internal control -> social media | 0.092 | 0.070 | 1.229 | 0.188 | P >.05 | Not support |
| H2b | external control -> social media | 0.245 | 0.067 | 3.629 | 0.000 | *** | support |
| H3a | internal control -> Experience Value | 0.423 | 0.057 | 6.932 | 0.000 | *** | support |
| H3b | external control -> Experience Value | 0.031 | 0.050 | 0.609 | 0.537 | P >.05 | Not support |
| H4 | social media -> Experience Value | 0.154 | 0.058 | 2.617 | 0.009 | ** | support |
| H5 | Experience Value -> Satisfaction | 0.856 | 0.017 | 48.538 | 0.000 | *** | support |
e) Adventure Recreation Model: The research model
According to the analysis of the PLS research framework, and through Bootstrapping calculation and PLS Algorithm calculation the analysis of the perceived risk dimension adopts formative indicators, and the remaining dimensions adopt reflective indicators. The analysis results are shown in Figure 3, the indicators used in the PLS to measure the fitness of the model are GOF (Goodness of Fit), the GOF measurement standard >.1 for weak fitness, >.25 for moderate fitness, and >.36 for strength fitness (Akter, D'Ambra, & Ray, 2011), the GOF of this model is 0.461 >0.36, show that this model is strength fit degree of the standard. Henseler, Hubona, and Ray (2016) also mentioned that
PLS provides a new method of model fitness testing, the SRMR (Standardized root mean square residual), which can be observed in PLS. The difference related to the prediction is used to evaluate the model's suitability. If it is <0.1 it has a good model suitability. The SRMR of this model is 0.078 <0.1 to a significant level and this model indicating a good fit. As shown in Figure 3, this model can explain 23.2% of experience value and 73.2% of satisfaction, this shows that the model of this research explains the potential variables of adventure recreational activities it's very well, and the result is the same as the scholars on the research of flow experience to the satisfaction of adventure recreation tourists (Wen, Cedric, Chen, Yi, Yi & Shu Chang, 2019).
V. CONCLUSION AND SUGGESTIONS
a) Findings and theoretical implications
This study is on adventure recreation tourists in waters, and explores the influence of adventure recreation tourists' perceived risk, personality trait, and social media usage on experience value and satisfaction. The study found that internal control and external control personality traits have an impact on social media and experience value. Significance is very different. Internal control is significant for experience value while external control is significant for social media. Therefore, when planning to attract external control tourists, the experience value can be increased to improve satisfaction, and for internal control tourists, you can use social media aesthetic marketing or inner feeling direction to enhance experience value and satisfaction.
The average perceived risk scale is 4.18. Among them, the physical risk is 5.45 and the functional risk is 5.54 which is the highest. It shows that tourists are most worried about the perceived risk of physical injury and equipment and functional risk when participating in adventure recreation activities. Risk factors are reduced or eliminated to ensure that tourists are safe and secure during activities and can get adventurous excitement. As scholars Yüksel and Yüksel (2007) have stated, adventure recreation operators must be able to reduce the real risks of activities, and at the same time effectively retain adventures and enjoyment, thrilling and exciting risk experience.
As for the experience value and satisfaction scales in social media, the average numbers are 5.31, 5.72, and 5.78, the average number of satisfaction scales is the highest, just as the average number of funs in the experience value scale is 5.89. Tourists have a high degree of recognition and satisfaction with adventure recreation activities.
In terms of the overall research model architecture, the GOF of the model in this research is 0.461, which is the standard for strong fit, and the standardized root mean square residual matching indicator SRMR of the model is 0.078, which indicates a good model fit, and the entire model can explain the satisfaction degree of 73.2%. It's also in line with the characteristics of the aforementioned adventure recreation activities, because it is difficult to control the perceived risk and personality traits in the current adventure recreation activities, so the amount of explanation is usually low, but the satisfaction can be higher. The amount of interpretation even reached more than 70% in this model. It can be seen that this research model is very good for explaining the potential variables of tourist satisfaction with adventure recreational activities.
b) Management Implications, Research Limits and Research Recommendations
First of all, during the sample survey in this study, a questionnaire survey was conducted only for adventurous tourists in water types in Taiwan. However, the types of adventure recreation should also include mountaineering and air sports, so follow-up researchers can consider expanding the sample items and scope and increase the sample in different fields, hope to obtain more complete research results. Secondly, in terms of management implications, this research focuses on the measurement of the perceived risk dimension. According to the research of Van Riper (et al., 2016) and other scholars, the perceived risk is an overall indicator dimension, so the perceptual risk dimension is validated and analyzed by formative indicators, and it is shown in the management meaning that the perceptual risk dimension can be analyzed by formative indicators to be complete, so that it can also show the overall perceptual risk. At the same time, it is also suggested that follow-up scholars can use PLS to simultaneously to deal with the characteristics of reflective and formative indicators in the future research, to re-examine other studies, and obtain more diverse or broader research results. Finally, then model validation analysis shows that only 73.2% satisfaction is high, and others, such as external control personality traits which is 36.3%, experience value which is 23.8%, social media which is 8.3%, and internal control which only accounts for 5.8%, are all low, indicating that there are other aspects of influential factors exist, which can be strengthened in the future research framework.