Introduction
The process of globalisation is putting increasing pressure on publicly traded organisations to live in an ambiguous, risky and competitive environment, which deepens in times of crisis. Each company's individual strategic decision increasingly depends on factors that are also external to the organisation. In this sense, decision-making and the formalisation of concise strategies - whether public or private - are becoming increasingly vital and sometimes need to be done quickly and effectively.
There is an interdependent relationship between the capital market and public policy in countries. Through the capital market, companies can expand their borrowing to make investments and create jobs, which stimulates the generation of income for the population and thus tends to increase public revenue through taxes. Carvalho (2000) notes that, historically, the most advanced societies have continuously growing capital market structures, i.e., the financial development process of the main capitalist economies has also been characterised by the expansion of the financial securities market.
Similarly, the way in which politics is conducted also has a direct impact on the maintenance of the capital market. Aspects such as exchange rate policies, the basic interest rate, the level of taxation and economic openness - among others - can affect the continuity of companies and the flow of business. Vargas (2020) observed that conjunctural and economic aspects can stimulate the growth or bankruptcy of publicly traded companies, affecting their level of activity.
Latin America and the connections between the countries that make it up have been covered in various studies with the aim of understanding movements and integrations, as well as their behaviour during crises. In their research, Arshanapalli and Doukas (1992) found high degrees of international correlation in the 1982 financial crisis, which saw the Mexican financial system collapse and spread throughout Latin America.
In addition to essentially financial crises, countries and their financial markets are also susceptible to shocks from other sectors. The novel coronavirus crisis began in the city of Wuhan, China, and subsequently became a global health crisis, declared a pandemic by the World Health Organization (WHO) on March 11, 2020.
Although the crisis was initially a health crisis, it has gone beyond this concept and has also become relevant in economic and social terms. Recent studies are also seeking to understand the disruptions that may have been caused in organisations due to the COVID-19 pandemic.
Heyden and Heyden (2020) state that the pandemic has had an unprecedented negative effect on capital markets around the world. Zhang, Hu and Ji (2020) study the effect of the pandemic on twelve world stock exchanges and show that financial market risk has increased substantially in response to the pandemic.
The Economic Commission for Latin America and the Caribbean - ECLAC (2022), highlights that even in 2022 - two years after the start of the pandemic - Latin America faces major economic recovery challenges. In this ECLAC report, in addition to slow economic growth after the pandemic, there are challenges of inflationary pressure, slow job creation and strong social issues, reinforcing that increased investment is vital for economic recovery.
Given the importance of the capital markets for their respective countries and the need for new approaches related to the pandemic, research in this direction is extremely important, deepening the analyses and, through this, making the information more robust for managers, investors, the community in general and the public sector. In this context, this paper seeks to answer the following question: what is the impact of the new coronavirus on the main Brazilian, Mexican and Chilean stock exchanges?
Given that Latin America is an important part of the world market and its economic similarities - as stated above - this study focuses on the three main stock exchanges in Brazil (B3, Bolsa de Balcão), Mexico (BMV) and Chile (Bolsa de Santiago). According to Bastos and Nakamura (2009), Brazil, Mexico and Chile are among the largest economies in the region and can be considered the main players in the world.
In order to answer the research problem, the aim is to evaluate the three main stock exchanges in Latin America: Brazil, Mexico and Chile between 2020 and 2022, a period of systemic crisis caused by the COVID-19 pandemic. These evaluations were carried out in two parallel, complementary but distinct analyses.
Firstly, a time window was set for the years 2017 to 2019 (the period before the pandemic) and 2020 to 2022 (the period when the pandemic is in progress). Following the basic method of Güereña de la Llata et al. (2014), by comparing the periods (prior to and in progress of the pandemic) of the number of companies listed on each of the three stock exchanges and their capitalisation values, we sought to understand whether the period of the pandemic crisis had an impact on the continuity or bankruptcy of the listed companies, as well as their level of valuation on the stock market.
The second analysis corresponds to the period from 2020 to 2022 and is related to the last two specific objectives. Based on the method of Albulescu (2021), we sought to relate the number of COVID-19 cases and deaths in each of the countries in the study with the fluctuations in the indices of each stock market to assess the interference of the pandemic with the volatility of the capital markets. Also in this context, the number of global cases and fatalities of the new coronavirus and their relationship with possible market fluctuations in the study countries are evaluated. Based on Ji et al. (2021), the daily volatility of the Bovespa (B³), S&P/BMV IPC (BMV) and IPSA (Santiago Stock Exchange) indices was used as a proxy for the volatility of the capital markets in Brazil, Mexico and Chile, respectively.
The article is structured in five sections, the first of which comprises this introduction. Section 2 contains the literature review, subdivided into four sub-items. Section 3 contains the methodology followed, which presents the study variables, the characteristics of the sample, as well as the methods and tests used to conduct the research in question. Section 4 then presents and discusses the results obtained and finally, section 5 summarises the main results achieved.
Literature review
The financial system and the capital market
Within the financial market, there are four other segments: the financial market, the credit market, the foreign exchange market and the capital market. The capital market was the subject of this work, but specifically the stock market, which is worked on together due to its connection to the financial market.
Within the capital market there are the Stock Exchanges. Ponce (2010) defines the Stock Exchange as a self-regulated institution with the aim of providing duly registered intermediaries with all the information and services necessary to carry out transactions in a transparent and orderly manner. The effects of a stock exchange's fluctuations can be measured through its indices, which measure the performance of a portfolio with the weighted composition of the main shares traded on the respective market. Peixoto (2021) emphasises that indices are important indicators for investors, as they generally detect market fluctuations.
Brazil's largest and only stock exchange is B³, which, according to the organisation itself, is "one of the world's leading financial market infrastructure companies". B³'s main index is the Ibovespa, and its headquarters in Brazil are in the city of São Paulo. According to information from Economática (2020), the total financial volume of the Brazilian stock exchange in June 2020 was US$ 655 billion. The Brazilian Stock Exchange is supervised by the Central Bank of Brazil (BCB) and the Brazilian Securities and Exchange Commission (CVM).
Mexico's main stock exchange is the BMV, an acronym for the Mexican Stock Exchange. It is headquartered in Mexico City and, according to the BMV's own data, is the second largest stock exchange in Latin America with a total market capitalisation of over $520 billion. The main index of the Mexican stock exchange is the S&P/BMV IPC, which shows the shares of the largest listed companies. The Mexican Stock Exchange is supervised by the Comisión Nacional Bancaria y de Valores (National Banking and Securities Commission).
Chile's main stock exchange is the Santiago Stock Exchange, which has the IPSA index, which, as described by the organisation, measures the price variations of the largest and most liquid Chilean issuers listed on the exchange. Although it is less representative in Latin America than the main stock exchanges in Brazil and Mexico, according to Economática (2016), in December 2016 the Santiago Stock Exchange had a market value of US$179,733 million. The regulatory body for the Chilean Stock Exchange is the Superintendencia de Valores y Seguros (Superintendency of Securities and Insurance).
The sum of the values of the shares on a given stock exchange is given by market capitalisation, which is an important trading indicator. Market capitalisation, according to Ponce (2010), is the market value of shares measured by the sum of the market value of the shares listed on that exchange.
Another important aspect of the capital market is the number of companies listed on each market, which has a better impact on the sustainability of a country's companies, since listed companies generally have a higher level of governance, control and transparency than other companies, even though the requirements may change in each country. According to B³, in the IPO (Initial Public Offering) Guide, an IPO significantly alters a company's strategic positioning.
Relevant and intrinsic to the capital market are risks and uncertainties. Risk comes from market uncertainties, according to Lima (2018), and the financial market is highly unpredictable and predisposed to fluctuations due to internal and external factors. Moving further into economic theory, Keynes (1985) was one of the first economists to study and link the concept of uncertainty and the concept of choice by convention (individual choice, but following "collective" standards) to markets. Through the concept of uncertainty, the author emphasises that it is extremely difficult to predict exactly when a crisis will occur. In relation to Keynesian theory, Carvalho (2014, p. 248) explains:
The definition of convention is relatively straightforward: it is a belief shared by a certain number of individuals. [...] A convention, therefore, is a reducer of uncertainty by making the behaviour of those who are assumed to share the same belief predictable. [...] Keynes used the idea of convention in the sense of a dominant belief at a given time, one that is capable of explaining not just the behaviour of an individual but, in fact, the economy as a whole. (CARVALHO, 2014, p. 248)
The complexity of the financial market and the foundations of the capitalist system were also explained by Minsky (1986), who sought to explore instability as a phenomenon intrinsic to the market itself. With his theory based in part on that of Keynes, the author reports on the relationship between investment and savings and economic cycles.
For Minsky (1982), institutions play an important role in intervening and sustaining the stability of the capitalist system. As Oliveira (2013, p. 22) points out, "the combination of effective government policies and the intervention of the Central Bank as a guide for the banking system can avoid peaks of deflation and depression in the economy".
It can be understood that the notion of risk is inherent in the stock market; however, it tends to become more noticeable in times of crisis. Siegel (2008) analyses the effect of wars - such as Iraq (2003-2011) - on the stock market, finding that times of peace have higher returns. The author concludes that world events can have a profound impact on the market in the short term, but would still be incapable of diminishing long-term stock returns.
Since crises tend to interfere with countries' capital markets, the next section seeks to relate aspects of pandemic crises to their impact on the world economy. Through these aspects, it is possible to emphasise that other health crises have transcended health issues and had a strong negative impact on the economy.
Pandemics and the economy: Spanish flu and swine flu
A pandemic is defined as when the transmission of a particular disease reaches a global level, reaching all continents, according to the United Nations (UN, 2020). Even before COVID-19, there were other pandemics. The largest known pandemic caused by the H1N1 virus was the Spanish Flu in 1918.
Marson and Siviero (2021, p. 7) emphasise that "a pandemic, such as the Spanish flu, can affect the economy in different ways in both the short and long term". The authors conclude that the level of mortality has a direct impact on the labour market and the level of production in nations. As a result, the goods and services needed by the population can be limited, raising the price level.
According to Tomasi (2020, p. 27-28), the Spanish flu pandemic had various economic impacts. The author emphasises that the infection was not limited to humans, infecting and killing pigs on farms, affecting the production sector. As the disease progressed, hospitals did not have enough beds to care for the population, and pharmacies restricted the sale of medicines and adjusted prices upwards due to the high demand. In addition, several insurance companies went bankrupt as a result of the mass deaths of people infected with the disease, as well as the negative impact on the labour market in the countries.
Almost a century after the Spanish flu pandemic, 2009 saw the emergence of the second pandemic caused by the H1N1 virus, known as Swine Flu. According to Dominguez et al. (2020), this flu initially only infected pigs, however, the virus mutated and humans became infected in Mexico, spreading to other countries.
With symptoms and transmission methods very similar to the Spanish flu, in July 2009, according to the British Broadcasting Corporation News (BBC News, 2009), Latin America was the region hardest hit by swine flu. Even so, the crisis situation in the markets was systemic. According to Agência Estado (2009), the fall in the world's stock markets was generalised by investors' fear: "the fear that swine flu will turn into a pandemic is driving down the shares of airlines and pork producers".
In addition to the impact on the stock markets, the swine flu pandemic crisis may have had an impact on the level of exports and imports by nations. Ceci (2020) concluded in his research that there were noticeable impacts on the volume of Brazilian exports and imports during the initial months of swine flu. Even so, the author emphasises that the creation of a vaccine for the disease in 2009 may have minimised the deleterious effects of the crisis from 2010 onwards.
In light of the above, it is possible to consider that pandemics also have a profound influence on the economy as a whole. There are repercussions on both demand and supply, where government decisions have an influence on the effectiveness of human and, not excluding, economic protection measures.
The COVID-19 pandemic and its impact on the world economy
The novel coronavirus pandemic began in Wuhan, China, and later became a global crisis, declared a pandemic by the World Health Organization (WHO) on March 11, 2020. Proof of the ability of information to spread and interact in the globalised world, as Albulescu (2021) points out, the world's stock markets have already been experiencing shock waves since February 2020.
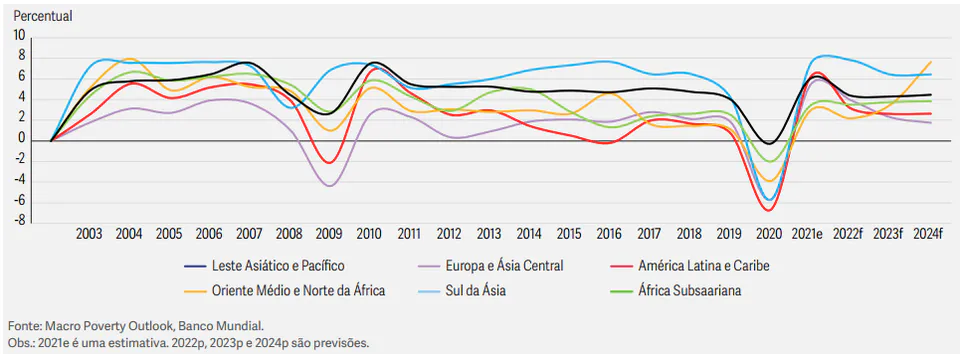
According to data from the World Bank (2022), Latin America and the Caribbean experienced a downturn in real GDP during the pandemic period very close to the 2008 financial crisis, as shown in Figure 1. Another characteristic is that the impact of the pandemic on real GDP growth has not been limited to certain undeveloped regions.
Although the health crisis initially differed from other financial crises, it is clear that the impacts went beyond public health issues. Using ordinary least squares and recursive least squares methods, Albulescu (2021) took an empirical look at the official announcements of infected people and the fatality rates of the new coronavirus on the US financial market. The study found that the global level of fatalities and infection has a greater impact on the volatility of the S&P500 index than local variables, concluding that the health crisis increases volatility in the US market.
Various studies have sought to better understand the effect of the COVID-19 pandemic on countries' economies. The consensus among researchers is that the novel coronavirus crisis has brought profound changes to markets around the world.
Methodology
As described, this work establishes two parallel and distinct analyses, with different time windows and data: a) descriptive analysis, covering 2017 to 2022; b) time series analysis, covering 2020 to 2022. For the descriptive analysis, monthly data was collected on the number of listed companies and their capitalisation value on each of the stock exchanges in the study. For the time series analysis, the daily indices of each of the stock exchanges (dependent variable) and the number of COVID-19 cases and fatalities at local (country) and global levels (independent variables) were collected.
Descriptive analysis
Monthly data was collected for the years 2017 to 2019 (prior to the pandemic) and 2020 to 2022 (after the start of the pandemic) in order to assess possible impacts of the pandemic on the capital markets of each country in both periods.
Table 1: Data display for Descriptive and Comparative Analysis
| Exchange I, II and III | Period 1 - Before the Pandemic | Period 2 - After the Pandemic Starts |
|---|---|---|
| No. of Listed Companies | Mean, median, standard deviation, minimum and maximum value | Mean, median, standard deviation, minimum and maximum value |
| Capitalisation Value (USD) | Mean, median, standard deviation, minimum and maximum value | Mean, median, standard deviation, minimum and maximum value |
Source: Elaborated by the authors (2022).
Table 1 shows the compilation of this first analysis for later comparison. Based on the research problem listed above, data was collected on the companies listed on each of the three stock exchanges in the countries in this study, as well as their capitalisation value.
Time Series model
Using time-series econometric modelling, we sought to understand the number of COVID-19 fatalities and infections in each of the countries, in relation to the fluctuations in the stock market indices of each nation. Six time-series econometric models were developed, two for each country, in order to assess the effects and magnitude of COVID-19 deaths and cases (local and global) on the respective stock market indices. The proposed time-series multiple regression models are specified as follows:
(1)
(2)
Equations 1 and 2 correspond to the time series model, where the subscript i = country; t = 2020 to 2022, in days; are the residue vectors for the country analysed. The variables DeathsM and CasesM correspond to the numbers related to global data, while Deaths and Cases portray the local numbers for the respective country.
The six models establish that a change in the independent variables with a time lag has an effect on the Ibovespa, S&P/BMV CPI and IPSA. The independent variables of the number of fatalities and cases were lagged by one level due to the fact that the accounting of this data takes place during the course of the day and is released to the market with a delay. Based on Ji et al. (2021), the daily volatility of the Bovespa (B³), S&P/BMV IPC (BMV) and IPSA (Santiago Stock Exchange) indices was used as a proxy for the volatility of the financial markets in Brazil, Mexico and Chile, respectively. After compiling the data, the tests and analyses were carried out using Stata 15.1® software.
Unit root tests are used to detect whether or not a time series is stationary. To check for stationarity, the Dickey-Fuller (DF)1 unit root test was applied. To obtain the result of the DF test, two hypotheses are considered: , the series is stationary; , the series is not stationary.
The Jarque-Bera (1987) normality tests were carried out, testing the null hypothesis of normality, the residuals follow a normal distribution. However, it is important to emphasise that as the model worked with more than 1094 observations, it is possible to admit asymptotic normality and the validity of the hypothesis tests.
After estimating the models, the possibility of heteroscedasticity in the data was checked using the Breusch-Pagan and Cook-Weisberg test proposed by Greene (2012). If the null hypothesis of the Breusch-Pagan2 and Cook-Weisberg test was rejected, it was decided to correct the errors using the Newey-West3, Robust Inference method, which, according to Gujarati and Porter (2011), ensures that the results are consistent with regard to autocorrelation and heteroscedasticity.
Data Sources
For the descriptive analysis, which corresponds to the years 2017 to 2022, the monthly data on the number of listed companies and capitalisation values for each of the markets was collected from the Statistics Portal of The World Federation of Exchanges and covers the years 2017 to 2022*.*
To analyse the time series, corresponding to the years 2020 to 2022, the variation of the daily IBovespa, S&P/BMV IPC and IPSA indices was collected from the websites of the stock exchanges themselves. The daily data on fatalities and the number of COVID-19 cases in each country was taken from the Ministry of Health: Ministry of Health, in the case of Brazil; Ministry of Communications, in the case of Chile; and, the Government of Mexico, in the Mexican case. For information on the novel coronavirus in the world, data was collected from the World Health Organization (WHO).
Analysis and Discussion of Results
Descriptive analysis
The descriptive analysis revealed three distinct behaviours for each country, in terms of the number of listed companies and the total capitalisation value. Considering both indicators - listed companies and capitalisation value - in the case of Brazil, the sample for the 2017-2019 period was more homogeneous than the 2020-2022 period. The opposite situation occurred in Chile, where the period after the start of the COVID-19 pandemic was more homogeneous than the previous one. In the case of Mexico, the period after 2020 showed greater fluctuation in the total capitalisation value of listed companies, but stability in the number of listed companies. Table 1 compiles the results for each of the countries.
With these results, it can be said that in parts, the behaviour of Brazil and Mexico is similar, since the depreciation of their average capitalisation value after the start of the pandemic fell by 6% and 2% respectively, with an even greater reduction in the minimum capitalisation value, however, with a higher maximum capitalisation value after 2020 in both cases. The sample of the capitalisation value of these countries from the comparative period after the start of the pandemic was also less symmetrical and homogeneous - showing a period of greater volatility between 2020 and 2022.
Chile, despite having a more symmetrical sample in the period after the start of the pandemic, showed greater fluctuations in the average total capitalisation value in the period after the start of the COVID-19 pandemic, reaching a depreciation of 34% in the average value and 26% in the minimum value and 33% in the maximum value - comparing the two periods of analysis. It can be seen that the historical minimum of the market capitatisation (USD) of the periods took place between 2020 and 2022, in addition to the maximum value during the pandemic being lower than the previous period. It's important to bear in mind that when Chile entered the pandemic period, it had already been going through one of its biggest political and social crises since 2019, which culminated in major protests involving more than 5% of its population, as reinforced by Leopoldino (2020) and Desir (2022).
In the case of Mexico, the average number of listed companies from 2017-2019 and 2020-2022 was similar. In the case of Brazil and Chile, the average number of listed companies after 2020 increased, with greater significance in the case of Brazil, and the opposite effect in the case of Mexico. One hypothesis for this effect was the different measures taken by the Brazilian, Chilean and Mexican governments to contain the pandemic, given that, according to Cota (2021), Mexico was the country - among the largest in Latin America - that spent the least as a percentage of GDP to contain the damage caused by the pandemic, with 0.7 per cent - compared to 14 per cent for Chile and 9.2 per cent for Brazil. Simioni Neto (2023, p. 44) emphasises that Chile has spent resources on unemployment insurance and payroll subsidies to prevent companies from going bankrupt, in the same way that Brazil has increased public spending in this regard.
As for market capitalisation (USD), all the stock exchanges in the countries analysed had negative impacts after the start of the pandemic compared to the previous period, where Chile showed greater depreciation. Even so, the period before the pandemic showed a less symmetrical distribution in the Chilean case in terms of the number of listed companies and similar in both periods in terms of market capitalisation.
Chart 1: Comparison of periods between indicators of the number of listed companies and capitalisation value B3, Santiago Stock Exchange and BMV
| Country | Indicator | 2017-2019: No. of Listed Companies | 2017-2019: Capitalisation Value | 2020-2022: No. of Listed Companies | 2020-2022: Capitalisation Value |
|---|---|---|---|---|---|
| Brazil | Average | 337,97 | 946.365,57 | 361,61 | 890.586,65 |
| Minimum | 326,00 | 771.081,01 | 327,00 | 605.067,53 | |
| Maximum | 350,00 | 1.187.361,69 | 388,00 | 1.198.298,09 | |
| Median | 339,00 | 945.458,11 | 369,50 | 867.666,79 | |
| Asymmetry | More symmetrical | More symmetrical | Less symmetrical | Less symmetrical | |
| Standard Deviation | 6,05 | 107.925,98 | 19,92 | 150.762,36 | |
| Chile | Average | 287,92 | 255.712,42 | 291,58 | 168.141,29 |
| Minimum | 204,00 | 185.532,58 | 277,00 | 136.563,39 | |
| Maximum | 298,00 | 314.057,01 | 299,00 | 211.343,23 | |
| Median | 291,50 | 256.192,85 | 295,00 | 167.556,77 | |
| Asymmetry | Less symmetrical | Similar | More symmetrical | Similar | |
| Standard Deviation | 15,26 | 30.271,32 | 8,15 | 16.264,53 | |
| Mexico | Average | 145,81 | 413.121,39 | 144,81 | 404.875,28 |
| Minimum | 144,00 | 355.723,41 | 144,00 | 275.086,58 | |
| Maximum | 149,00 | 463.361,60 | 146,00 | 497.919,25 | |
| Median | 145,00 | 413.910,87 | 145,00 | 426.233,98 | |
| Asymmetry | Less symmetrical | More symmetrical | More symmetrical | Less symmetrical | |
| Standard Deviation | 1,49 | 28.387,72 | 0,86 | 62.175,10 |
Source: Statistics Portal do The World Federation of Exchange, elaborated by the authors (2023).
In general, it can be said that the COVID-19 pandemic has had negative effects on the three stock exchanges in the three countries studied, mainly considering the market capitalisation of these markets. This result corroborates other preliminary studies related to market pricing with Covid-19, such as the work by Avelar (2020), which identified high losses in the value of companies and an increase in their level of indebtedness.
Time Series analysis
For the time series analysis, two equations were drawn up for each of the countries, in one of which the index of each stock exchange was used as the dependent variable in relation to the number of new cases and fatalities computed within the nation. For the days when the variations in the stock market indices were not available (weekends and public holidays), the values were mirrored, i.e., values closed on Friday were mirrored for Saturday and the values of the variation in the index on Monday were mirrored for Sunday.
In both models, the Dickey-Fuller (DF) unit root test showed that the Brazilian and Chilean models were stationary, failing to reject . The null hypothesis was rejected for the Mexican model, where means that the series is not stationary at the level, making it necessary to model the variables in one difference. In one difference the model becomes stationary, on which we worked out.
In the two regressions for the three countries, the Jarque-Bera normality test for the residuals rejected H0: residuals follow a normal distribution, with a p-value < 0.05. However, as the models worked with more than 1,094 observations, asymptotic normality was accepted and the hypothesis tests were valid.
The Breusch-Pagan and Cook Weisberg heteroscedasticity test suggested the presence of heteroscedasticity in the Brazil and Chile regressions, meaning that the variance for each observation is uniform only in the Mexico models. Based on these results, robust estimates were also used in the regressions for Brazil and Chile, using Newey-West Robust Inference, which showed no significant signs, values or other changes in the results. As described in chapter 4.2, using Newey-West robust inference ensures that the results are consistent with regard to autocorrelation and heteroscedasticity.
Time Series model: National Cases and Fatalities
As can be seen in Tables 2, 3 and 4, the number of national COVID-19 cases and fatalities do not - individually or collectively - explain the fluctuations in the stock market indices of their respective countries.
Table 2: Regression (1), Ibovespa (Brazil)
| Variable | Coefficient | Std. Error | t | P>|t| | Statistic | Value |
|---|---|---|---|---|---|---|
| No. of CasesCountryDef | 0.00000079 | 0.0000 | 0.37 | 0.708 | Note No. | 1095 |
| No. of DeathsCountryDef | 0.0001216 | 0.0001 | 1.24 | 0.217 | F (2, 1092) | 1.57 |
| _cons | -0.142385 | 0.0871 | -1.64 | 0.102 | Prob > F | 0.2076 |
| R² | 0.0029 |
Note: Independent variables do not jointly or individually predict the dependent variable.
Source: Elaborated by the authors (2023).
Of the three models, the one with the lowest explanatory power was Mexico's, followed by Brazil and Chile. This may be related to the size of the stock exchanges, i.e., the number of companies listed on Chile's stock exchange is smaller than the other two.
Table 3: Regression (5), IPSA (Chile)
| Variable | Coefficient | Std. Error | t | P>|t| | Statistic | Value |
|---|---|---|---|---|---|---|
| No. of CasesCountryDef | 0.0000002 | 0.0000001 | 2.02 | 0.044 ** | Note No. | 1095 |
| No. of DeathsCountryDef | -0.0000017 | 0.0000016 | -1.09 | 0.277 | F (2, 1092) | 2.51 |
| _cons | -0.0011256 | 0.0006939 | -1.62 | 0.105 | Prob > F | 0.082 |
| R² | 0.0046 |
Note: Independent variables do not jointly or individually predict the dependent variable at 5% statistical significance.
** Significant at 5%
Source: Elaborated by the authors (2023).
The equation for the Mexican model, evaluating the BMV index in relation to cases and fatalities within the country, obtained 1094 observations, due to the need for a difference because the model is not stationary in level. Even so, it did not prove to be a robust model for explaining the oscillations that occurred between 2020 and 2022.
Table 4: Regression (3), BMV (Mexico)
| Variable | Coefficient | Std. Error | t | P>|t| | Statistic | Value |
|---|---|---|---|---|---|---|
| No. of CasesCountryDIF | -0.000000020 | 0.000000087 | -0.23 | 0.817 | Note No. | 1094 |
| No. of DeathsCountryDIF | -0.000003200 | 0.000014700 | -0.22 | 0.828 | F (2, 1092) | 0.06 |
| _cons | -0.000038200 | 0.000428900 | -0.09 | 0.929 | Prob > F | 0.9414 |
| R² | 0.0001 |
Note: Independent variables do not jointly or individually predict the dependent variable.
Source: Elaborated by the authors (2023).
The preliminary results of the equation that evaluated the impact of the number of cases and fatalities within the country related to the new coronavirus on the volatility of the Ibovespa, IPSA and BMV indices did not have good explanatory power. The next section looked at whether the new cases and deaths of the disease around the world had an impact on the fluctuations of each country's index.
Time Series model: Worldwide Cases and Fatalities
In the second estimated model - no longer taking into account domestic COVID-19 cases and fatalities, but rather global ones in the volatility of the Ibovespa, BMV and IPSA indexes - the results for Brazil and Mexico were similar. While Chile's result was antagonistic to the others.
In the case of Chile, the model shown in Table 5 reduces the explanatory power, as well as the joint significance of the two independent variables in relation to the dependent one - when compared to the model in Table 3.
Table 5: Regression (6), IPSA (Chile)
| Variable | Coefficient | Std. Error | t | P>|t| | Statistic | Value |
|---|---|---|---|---|---|---|
| No. of CasesCountryDef | 0,000000001 | 1E-09 | 1,3 | 0,195 | Note No. | 1095 |
| No. of DeathsCountryDef | 0,000000209 | 1,38E-07 | 1,51 | 0,13 | F (2, 1092) | 2,29 |
| _cons | -0,0022209 | 0,001052 | -2,11 | 0,035 | Prob > F | 0,1013 |
| R² | 0,0042 |
Note: Independent variables do not jointly or individually predict the dependent variable.
Source: Elaborated by the authors (2023).
Unlike the results for Chile, the models for Brazil and Mexico with the number of fatalities and global COVID-19 cases showed a greater explanatory capacity for the Ibovespa and BMV fluctuations respectively, corroborating the results of the work by Albulescu (2021). In the results for both countries, the R² increases, showing that the global data on the new coronavirus had a greater influence on the volatility of the Ibovespa and BMV indices during the study period.
Table 6: Regression (2), Ibovespa (Brazil)
| Variable | Coefficient | Std. Error | t | P>|t| | Statistic | Value |
|---|---|---|---|---|---|---|
| No. of CasesCountryDef | 0,0000001 | 1E-07 | 1,61 | 0.10 * | Note No. | 1095 |
| No. of DeathsCountryDef | 0,000033 | 1,52E-05 | 2,17 | 0.03 ** | F (2, 1092) | 4,21 |
| _cons | -0,32125 | 0,116081 | -2,77 | 0.006 *** | Prob > F | 0,015 |
| R² | 0,0076 |
Note: Independent variables jointly predict the dependent variable at 5%.
*** Significant at 1%; ** Significant at 5%; * Significant at 10%
Source: Elaborated by the authors (2023).
In the Mexican regression model, cases of global deaths from the disease showed greater statistical significance in the impact on BMV in the period than the number of cases; however, the F test showed that the independent variables have the explanatory capacity to predict the dependent variable together, with a 10% significance level, with Prob > F of 0.0859. This result may demonstrate the country's dependence on external factors.
Table 7: Regression (4), BMV (Mexico)
| Variable | Coefficient | Std. Error | t | P>|t| | Statistic | Value |
|---|---|---|---|---|---|---|
| No. of CasesCountrYDIF | -0,0000000004 | 0,000000002 | -0,17 | 0,865 | Note No. | 1094 |
| No. of DeathsCountryDIF | -0,000000798 | 0,000000390 | -2,05 | 0.041 ** | F (2, 1092) | 2,46 |
| _cons | -0,0000324 | 0,000428 | -0,08 | 0,94 | Prob > F | 0,0859 |
| R² | 0,0045 |
Note: Independent variables jointly predict the dependent variable by 10%.
** Significant at 5%
Source: Elaborated by the authors (2023).
In general, the time series models showed that the number of new cases and fatalities of the new coronavirus in the world had a more significant influence on the volatility of the stock market indices in Brazil and Mexico, without having the same effect in Chile. This difference may be linked to various aspects that differentiate Brazil and Mexico from Chile, such as the size of the stock exchanges studied and the lower representation of foreign organisations in the composition of companies listed on B3 and BMV.
Table 8: Compiled Time Series Regression Results
| Country | Regression | I - Internal Cases | II - Worldwide Cases |
|---|---|---|---|
| Brazil | Cases | Unexpected but not significant signal | Unexpected signal, but significant at 10% |
| Fatalities | Unexpected but not significant signal | Unexpected signal, but significant at 5% | |
| R² | Low explanatory capacity | 162% increase over the previous model | |
| Joint Prediction | No | Yes, at 5% significance | |
| Chile | Cases | Unexpected signal, but significant at 5% | Unexpected but not significant signal |
| Fatalities | Expected signal, but not significant | Unexpected but not significant signal | |
| R² | Low explanatory capacity | Low explanatory capacity | |
| Joint Prediction | Yes, but at 10% significance | No | |
| Mexico | Cases | Expected signal, but not significant | Signal expected, but not significant |
| Fatalities | Expected signal, but not significant | Signal expected, significant at 5% | |
| R² | Very little explanatory capacity | 4400% increase over the previous model | |
| Joint Prediction | No | Yes, at 5% significance |
Source: Elaborated by the authors (2023).
Table 8 compiles the results shown in sections [time-series-model-national-cases-and-fatalities] and [time-series-model-worldwide-cases-and-fatalities]. As explained above and compiled in the respective table, Brazil and Mexico are the most similar in terms of the behaviour of new cases and fatalities of the new coronavirus in relation to the fluctuations of their Ibovespa and BMV indices. Even so, each country has shown itself to be unique in the results of this study, and further research is suggested in the future.
Conclusion
This study sought to analyse the impacts of the COVID-19 pandemic on the stock markets of three Latin American countries: Brazil, Mexico and Chile. Using a methodological approach that combined descriptive and time series analyses, the oscillations in the number of listed companies and the capitalisation value of the stock exchanges were investigated, as well as the impact of the number of COVID-19 cases and fatalities, both domestic and global, on the oscillations of each country's indices.
In the descriptive analysis, established in correspondence with the first and second specific objectives, three distinct behaviours were observed for each country. Chile showed a greater depreciation in the total capitalisation value of the Santiago Stock Exchange during the pandemic, although the number of listed companies recovered after 2020. However, the country was already facing a political and social crisis before the pandemic, which may have influenced the results.
Brazil, on the other hand, showed less depreciation in the average capitalisation value of the B³ compared to Chile after the start of the pandemic, but considerable market volatility in this respect. Even with a loss of market value in terms of capitalisation, the average number of companies listed on the Brazilian stock exchange increased after 2020. Mexico also showed less symmetry in the capitalisation value of listed companies after 2020, but maintained stability in the number of listed companies and was the country that showed the least variation in average capitalisation values between the two periods.
The time series analysis, linked to the third and fourth specific objectives, revealed that the number of domestic COVID-19 cases and fatalities did not explain the fluctuations in the stock market indices of the countries studied. However, when considering global data on cases and deaths, the models for Brazil and Mexico showed greater explanatory power for the variations in the Ibovespa and BMV indices, respectively. On the other hand, global data did not have the same impact on Chile's IPSA index.
These results suggest that the stock markets of Latin American countries have been influenced differently by the COVID-19 pandemic. Brazil and Mexico were more sensitive to global data, while Chile appeared to be more resilient to these external variations.
Several factors can explain these differences. The size of the stock exchanges, the representation of foreign companies and the policies adopted by each country to combat the pandemic are some of the aspects that may have influenced the results. Brazil, for example, was the first country to show cases of infection and death from the new coronavirus, but started vaccinating its population later than Mexico and Chile. The political uncertainty surrounding the 2022 Brazilian presidential elections may also have contributed to the greater instability of the market during the period analysed.
In addition, the economic policy and macroeconomic decisions of the countries after the start of the pandemic, such as the increase in the basic interest rate, may also have had an impact on the volatility of the capital markets. High inflation in the three countries studied led to an increase in interest rates, which may have made credit more expensive and dampened demand for goods and services, affecting companies' profitability.
It is important to note that the results presented cannot be generalised and other variables can be considered in the analysis. Fluctuations in the capital markets are complex and can be influenced by a number of factors, not just the COVID-19 pandemic.
To summarise, the COVID-19 pandemic had negative effects on the stock markets of the countries studied, but these impacts were perceived differently in each of them. The descriptive and time series analyses provided an accurate understanding of the fluctuations in the stock markets, but the economic scenario and government decisions also had a significant influence. Continued research in this area is essential for a better understanding of the mechanisms that govern the capital markets and for the development of more effective economic recovery policies.
Therefore, future studies could delve deeper into these issues and consider other variables that could better explain the variations in the stock markets of Latin American countries. In addition, it is essential that the governments and economic authorities of the countries continue to monitor and implement appropriate policies to mitigate the economic impacts of the pandemic and promote the recovery of the capital markets.