In order to test the influence of augmented reality technology on the learning interest, achievement of learning goals and cognitive load, an experimental study was conducted using the contour map teaching as an example. This paper selected 427 students from 8 classes in grade 7 of Zhantan Middle School in Xindu District of Chengdu as experimental samples, Classes with no significant difference in learning basic level were divided into experimental classes and control classes. The experimental classes adopted the AR three-dimensional video as teaching aids to give new lessons and the control classes adopted the traditional twodimensional video, and then the students’ learning interest level, achievement of learning goals and cognitive load were measured. The results showed that the application of augmented reality technology in teaching could improve students’ learning interest and achievement of learning goals, but had no effect on reducing cognitive load.
## I. INTRODUCTION
Augmented reality (AR) technology is an extension of virtual reality (VR) technology, which can achieve a visual hybrid enhancement effect through the fusion of artificially generated three-dimensional virtual images with the real world under the coordination of software and hardware (Cai Su, Wang Pei-wen, Yang yang, et al., 2016; Zhang Si-fang & Jiang Jia-fa, 2018). AR technology has the characteristics of virtual and real combination, real-time interaction and three-dimensional display, etc. Combining theories of learning motivation, constructivism, and behaviorism, it is found that AR technology can promote the occurrence of interaction, establish the connection between stimulus and response, and help learners construct and transfer knowledge. It has many advantages in creating a learning environment, improving learning interest, reducing cognitive load, improving learning effectiveness, innovating teaching methods, and improving interaction effects (Wang Guo hua & Zhang Li-guo, 2017), which has led to the continued promotion of AR technology in the field of education.
Based on the research status of AR technology in teaching at domestic and abroad, it is found that domestic research mainly focuses on the introduction of application cases of AR technology in teaching, but a series of empirical studies have been conducted on the pedagogical use of AR technology by some domestic and foreign researchers, which confirms that AR technology has an influence on the achievement of learning goals, learning interest and cognitive load. Chiang et al (2014), and Carrera et al (2017) confirmed that AR technology is significantly superior to traditional inquiry learning methods in terms of stimulating students' learning interest, etc. Turan et al (2018), Carrera et al (2017; 2017), Yuan Ling (2019), and Chen Liang-ying (2019) found that AR technology is better than traditional teaching methods in the terms of promoting the achievement of learning goals. Hsiao et al (2013) found that mobile AR technology has a greater positive influence on students' academic performance and interest than multimedia teaching resources. In addition, some studies have shown that AR technology has the effect of reducing cognitive load (Wang Yuan, 2018). Lu Xiao-xu et al (2011) found a positive correlation between learning interest and achievement of learning goals. In addition, many studies have shown a negative correlation between cognitive load and achievement of learning goals (Wang C X, Fang T & Gu Y X, 2020).
Based on the cognitive load theory and the learning motivation theory, AR technology can reduce cognitive load, improve learning interest and achievement of learning goals as a learning aid. But the improvement of learning interest and the reduction of cognitive load will improve the achievement of learning goals. The theoretical model of the research design is shown in Figure 1.
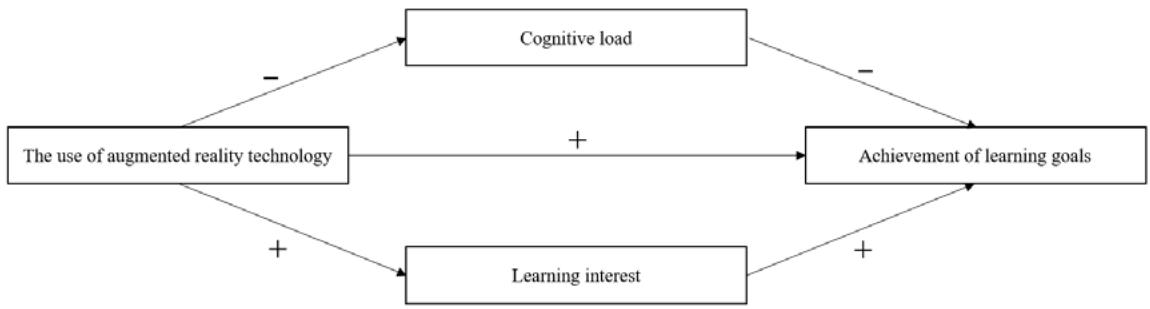 Figure 1: The theoretical model of the research design
This paper applies empirical thinking to verify the influence of AR technology on the achievement of learning goals, learning interest, and cognitive load. The following three hypotheses are proposed: Hypothesis 1: The use of AR technology has a significant positive influence on learning interest. Hypothesis 2: The use of AR technology has a significant positive influence on the achievement of learning goals. Hypothesis 3: The use of AR technology has a significant negative influence on cognitive load, i.e., it can reduce cognitive load. This study tests whether AR technology has the influence of improving learning interest, achievement of learning goals, and reducing cognitive load by means of a teaching experiment. To understand the effect of using AR technology and provide a reference for teachers to use AR technology in their daily teaching.
## II. METHOD
### a) Participants
The experiment was conducted at Zhantan Middle School in Xindu District of Chengdu. This experiment was based on a new geography curriculum of the contour map conducted in Zhantan Middle School in Xindu District of Chengdu. Zhantan Middle School in Xindu District of Chengdu is a new, high-standard and modern full-time junior middle school funded by the government of Xindu District, Chengdu. As a pilot unit of the modern school system, the school was named a pilot school of the "School of the Future" in Chengdu in January 2017, and was successfully declared a digital base school in Chengdu in September 2017. A total of 431 students from 8 classes in grade 7 were selected to participate in this experiment. After deleting 4 invalid data, the final sample size was 427.
### b) Instrument
coefficient of the scale was 0.805. $②$ The measurement instrument of achievement of learning goals: Using the contour skill test questions compiled by the researchers themselves, including 10 test questions. The measurement instrument has high validity and discrimination. In this study, the alpha coefficient of the scale was 0.608. $③$ The measurement instrument of cognitive load: Using the subjective measurement scale developed by Pass et al. (1994), which involves two dimensions of mental effort and task difficulty. The original two questions were modified to "how difficult do you think of interpreting topographical parts for learning in this lesson" and "how much effort did you put into learning the topographic parts of contour" according to the actual situation. The scale has been used in many studies and has high reliability and validity. Sun et al (2013) tested the reliability of the scale at 0.740. In this study, the alpha coefficient of the scale was 0.704.
### c) Materials
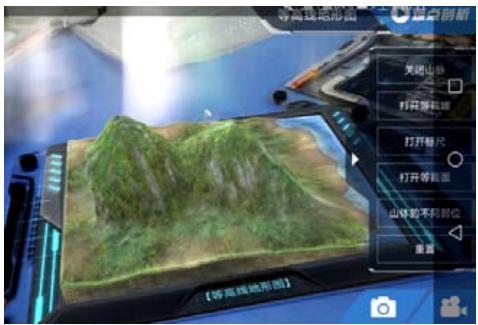
In this study, the contour content in the "A good understanding of middle school geography" APP based on AR technology was selected as the teaching experimental material. The teacher used the advantage of the three-dimensional display of the APP to realize the observation of each mountain part in the three-dimensional model of the contour map by changing the angle of the mobile phone, and used the mobile phone to record the whole process to obtain AR three-dimensional video. At the same time, the teacher prepared a traditional two-dimensional video explaining the characteristics of the contour line.
### d) Design
In order to reduce the contingency of the experiment, according to the geography mid-term scores of 431 students, the 8 classes were divided into 4 levels, and the 2 classes at the same level with similar scores were set as a group. They were divided into the experimental group and the control group respectively. A total of four groups were formed: Classes 7, 3, 1 and 5 of the grade 7 were used as experimental classes, and Classes 8, 2, 6 and 4 of the grade 7 were used as control classes. The mid-term scores of the experimental group and the control group are shown in Table 1. Table 1 shows that independent-samples t-test was conducted on the four groups of experimental classes and control classes, and the P values obtained are all greater than 0.05, indicating that the differences
between the experimental control classes are not significant, and the experimental control conditions meet the requirements.
Table 1: Design & Test of the experimental group and control group (N = 431).
<table><tr><td colspan="2">Group</td><td>Class</td><td>Number of Classes</td><td>Mid-term Average Score</td><td>t-test P-value*/ Significance of difference</td><td>Teaching Method</td></tr><tr><td rowspan="2">Group 1</td><td>Experimental class 1</td><td>Class 7, grade 7</td><td>53</td><td>67.02</td><td rowspan="2">0.657 Non-significant difference</td><td>Play AR three-dimensional video</td></tr><tr><td>Control class 1</td><td>Class 8, grade 7</td><td>55</td><td>65.96</td><td>Play traditional two-dimensional video</td></tr><tr><td rowspan="2">Group 2</td><td>Experimental class 2</td><td>Class 3, grade 7</td><td>54</td><td>62.04</td><td rowspan="2">0.090 Non-significant difference</td><td>Play AR three-dimensional video</td></tr><tr><td>Control class 2</td><td>Class 2, grade 7</td><td>54</td><td>57.56</td><td>Play traditional two-dimensional video</td></tr><tr><td rowspan="2">Group 3</td><td>Experimental class 3</td><td>Class 1, grade 7</td><td>53</td><td>55.17</td><td rowspan="2">0.941 Non-significant difference</td><td>Play AR three-dimensional video</td></tr><tr><td>Control class 3</td><td>Class 6, grade 7</td><td>54</td><td>55.37</td><td>Play traditional two-dimensional video</td></tr><tr><td rowspan="2">Group 4</td><td>Experimental class 4</td><td>Class 5, grade 7</td><td>55</td><td>51.09</td><td rowspan="2">0.833 Non-significant difference</td><td>Play AR three-dimensional video</td></tr><tr><td>Control class 4</td><td>Class 4, grade7</td><td>53</td><td>51.59</td><td>Play traditional two-dimensional video</td></tr><tr><td>Experimental classes of all</td><td>Experimental classes of 4 groups</td><td>Class 7, 3, 1, 5, grade 7</td><td>215</td><td>58.77</td><td rowspan="2">0.066 Non-significant difference</td><td>Play AR three-dimensional video</td></tr><tr><td>Control classes of all</td><td>Control classes of 4 groups</td><td>Class 8, 2, 6, 4, grade 7</td><td>216</td><td>57.69</td><td>Play traditional two-dimensional video</td></tr></table>
## III. EXPERIMENTAL TASK
### a) Procedure
The experiment was conducted from October 28 to November 1, 2019. Because the contour map has little relevance to prior knowledge, there is no need for a pre-test and the new lessons could be taught directly. In this experiment, in order to reduce the influence of other factors, the same teacher of Zhantan Middle School taught the new lesson to 8 classes, using the same instructional design and learning case, and presenting different video materials only in teaching methods. Before the lesson, we first created a situation in which five children lost their way in the process of climbing Heizhu Mountain. The teacher asked the students to contribute to the rescue, asking the students to mark the location points of the five children in distress on the topographic map of Heizhu Mountain according to the positioning data of the mobile phone. At the same time, they were also asked to name the topographic features near the location points. Then students evaluated and discussed the marking situation. In this process, students may have problems such as inaccurate marking of location points and disagreement on the discussion of topographic features. At this time, the teacher used video materials to teach contour knowledge and demonstrate contour lines and topographic landscape features of different topographic parts. The teacher conducted a live demonstration of AR in the experimental classes and played the recorded AR three-dimensional video in order to allow all students to see the demonstration process. The control classes played the traditional two-dimensional video (screenshots of the videos used in the experimental classes and the control classes are shown in Figure 2). The teacher closely follows the learning objectives to
teach the characteristics of five mountain parts and their corresponding contour lines, while guiding the students to observe the different forms of contour lines corresponding to the steepness of the topographic.

 Figure 2: Comparison of the experimental classes using AR three-dimensional video screenshots (left) and the control classes using traditional two-dimensional video screenshots (right).
After the end of the lesson, the teacher distributed questionnaires of geography learning interest, test questions of the contour line knowledge and skill, and scale of the cognitive load to measure the students' level of learning interest, achievement of learning goals, and cognitive load level.
and cognitive load level of the samples of experimental classes and control classes. The independent-samplest-test was used to analyze whether the difference between experimental classes and control classes reached a significant level. The results of the analysis are shown in Table 2.
### b) Data Analysis
The SPSS 23.0 tool was used to analyze the learning interest level, achievement of learning goals,
Table 2: Experimental data and analysis results of the control and experimental classes at Zhantan Middle School(N=427).
<table><tr><td rowspan="2" colspan="2">Classes Indexes</td><td>Class 7</td><td>Class 8</td><td>Class 3</td><td>Class 2</td><td>Class 5</td><td>Class 4</td><td>Class 1</td><td>Class 6</td><td rowspan="2">Experimental classes of 4 groups</td><td rowspan="2">Control classes of 4 groups</td></tr><tr><td>Experimental class 1</td><td>Control class 1</td><td>Experimental class 2</td><td>Control class 2</td><td>Experimental class 3</td><td>Control class 3</td><td>Experiment al class 4</td><td>Control class 4</td></tr><tr><td colspan="2">Valid experimental samples</td><td>53</td><td>54</td><td>54</td><td>54</td><td>53</td><td>55</td><td>52</td><td>52</td><td>212</td><td>215</td></tr><tr><td rowspan="4">Learning interest</td><td>Measurement level</td><td>91.39</td><td>87.50</td><td>90.86</td><td>80.44</td><td>87.26</td><td>78.52</td><td>87.98</td><td>82.33</td><td>89.39</td><td>82.18</td></tr><tr><td>Difference of mean</td><td colspan="2">3.89</td><td colspan="2">10.42</td><td colspan="2">8.74</td><td colspan="2">5.65</td><td colspan="2">7.21</td></tr><tr><td>T-value of mean comparison t-test</td><td colspan="2">1.441</td><td colspan="2">3.537</td><td colspan="2">2.552</td><td colspan="2">1.657</td><td colspan="2">4.580</td></tr><tr><td>P-value of mean comparison t-test</td><td colspan="2">0.153 Non-significant</td><td colspan="2">0.001 Extremely significant</td><td colspan="2">0.012 significant</td><td colspan="2">0.101 Non-significant</td><td colspan="2">0.000 Extremely significant</td></tr><tr><td rowspan="4">Achievement of learning goals</td><td>Measurement level</td><td>79.25</td><td>83.89</td><td>88.33</td><td>78.33</td><td>74.65</td><td>68.73</td><td>80.77</td><td>72.12</td><td>80.79</td><td>75.77</td></tr><tr><td>Difference of mean</td><td colspan="2">-4.64</td><td colspan="2">10.00</td><td colspan="2">5.92</td><td colspan="2">8.65</td><td colspan="2">5.02</td></tr><tr><td>T-value of mean comparison t-test</td><td colspan="2">-1.600</td><td colspan="2">3.649</td><td colspan="2">1.675</td><td colspan="2">2.273</td><td colspan="2">2.943</td></tr><tr><td>P-value of mean comparison t-test</td><td colspan="2">0.113 Non-significant</td><td colspan="2">0.000 Extremely significant</td><td colspan="2">0.097 Non-significant</td><td colspan="2">0.025 significant</td><td colspan="2">0.003 Extremely significant</td></tr><tr><td rowspan="4">Cognitive load</td><td>Measurement level</td><td>60.80</td><td>58.23</td><td>58.64</td><td>59.05</td><td>59.01</td><td>57.68</td><td>58.01</td><td>61.11</td><td>59.12</td><td>58.99</td></tr><tr><td>Difference of mean</td><td colspan="2">2.57</td><td colspan="2">-0.41</td><td colspan="2">1.33</td><td colspan="2">-3.10</td><td colspan="2">0.13</td></tr><tr><td>T-value of mean comparison t-test</td><td colspan="2">1.146</td><td colspan="2">-0.219</td><td colspan="2">0.518</td><td colspan="2">-1.104</td><td colspan="2">0.107</td></tr><tr><td>P-value of mean comparison t-test</td><td colspan="2">0.254 Non-significant</td><td colspan="2">0.827 Non-significant</td><td colspan="2">0.625 Non-significant</td><td colspan="2">0.272 Non-significant</td><td colspan="2">0.915 Non-significant</td></tr></table>
Comparing the level of learning interest between experimental classes and the control classes, the P value is 0.000, and the overall of all experimental classes (89.39 points) is significantly higher than that of all control classes (82.18 points), indicating that compared with the traditional two-dimensional video, AR technology is more effective in improving students' learning interest. Comparing the achievement of learning goals between experimental classes and control classes, the P value is 0.003, and the overall of all experimental classes (80.79 points) is significantly higher than that of all control classes (75.77 points), indicating that compared with the traditional two-dimensional video, AR technology is more effective in improving the achievement of learning goals. Comparing the level of cognitive load between experimental classes and control classes, the P value was 0.13. The overall of all experimental classes (59.12) was higher than that of all control classes (58.99), and the difference was not significant, indicating that compared with the traditional two-dimensional video, AR technology does not show the effect of reducing cognitive load. In general, the experiment confirms that AR technology is more conducive to improving learning interest and achievement of learning goals than traditional two-dimensional video, but it does not show the effect of reducing cognitive load.
## IV. RESULT AND DISCUSSION
### a) Result
Through the analysis of the experimental data, this study concludes that compared with traditional two-dimensional video, three-dimensional video based on AR technology can better improve students' learning interest and achievement of learning goals, but it does not show the effect of reducing cognitive load.
### b) Discussion
This paper analyzes the reasons why AR technology promotes students' learning interest and achievement of learning goals, which finds that AR technology has the characteristics of immersion, interactivity, three-dimensional display, etc. It immerses students and enhances their sense of presence and concentration. Students can also automatically adjust the angle and direction of the image to interact with the virtual image, which helps to improve the students' sense of experience. The characteristics of the three-dimensional display can turn abstraction into concrete, help students improve their ability of spatial imagination, and facilitate their understanding of knowledge, thus enhancing the achievement of learning goals. AR technology can provide an external learning environment of dynamic and highly interactive, which can promote interaction and collaboration between teachers and students, students and students, and students and the environment. At the same time, it can bring positive emotional experiences such as relaxation and pleasure to learners, so as to stimulate their internal learning motivation and improve their learning interest. Also, there are differences within the classes at different levels. When comparing each group of the experimental class and the control class individually, it was found that the highest-level classes were class 7 and class 8, and neither the learning interest nor achievement of learning goals in experimental class 7 was significantly higher than that in control class 8. This may be due to the students with the highest level having a good understanding. Both traditional videos and AR explanations allow this group of students to understand abstract knowledge like contour lines easily, so the difference is not significant. But as for the lower level of Class 5 and Class 4, Class 1 and Class 6, although achievement of learning goals and learning interest of experimental classes are higher than those of control classes, there is no significant difference in learning interest between Class 1 and Class 6, and there is no significant difference in achievement of learning goals between Class 5 and Class 4. This may be due to the fact that students in lower-level classes have poorer learning foundations, less seriousness in learning, relatively lower learning motivation, weaker learning ability, etc., which limit the effect of AR technology. Therefore, teachers should pay attention to the class students' learning situation when conducting teaching based on AR technology in general.
$②$ AR technology did not show the effect of reducing cognitive load, which is consistent with the research conclusion of Yang Jian (2020). Whether AR technology can reduce cognitive load depends on the content itself. The Cognitive load consists of three components: internal, external, and related cognitive load. The total cognitive load increases with the amount of information processed and the total number of memories. The case selected for this study, a contour map, is abstract and complex in content. It requires a large amount of information to be processed by students, and it need a high internal cognitive load of students. After adding AR technology demonstration, students should master the judgment of plane contour map, and process the 3D model, so that students' cognitive resources are used for useless information, which increases external cognitive load and produces negative effects such as information redundancy and distraction. This also inspires teachers to consider the characteristics of the teaching content itself adequately. When using AR technology to teach complex content, they should choose software with a simple interface, otherwise, it may increase students' cognitive load (Dunleavy M, Dede C & Mitchell R, 2009; Frederiksen J G, Srensen SMD, Konge L, et al., 2020).
## ACKNOWLEDGMENTS
The research was supported by the Ministry of Education of the People's Republic of China, Humanities and Social Sciences Research Project of the Year 2019 Funding Project (approval number: 19YJA880042). The authors would like to express their gratitude to the students who volunteered to participate in this study and to the teachers who helped with this study.
Generating HTML Viewer...
References
20 Cites in Article
Cai Su,Wang Pei-Wen,Yang Yang (2016). Review on augmented reality in education[J].
Zhang Si-Fang,Jiang Jia-Fa (2018). Augmented Reality (AR) in Education – A New Prospect.
Wang Guo-Hua,Zhang Li-Guo (2017). Augmented reality in education: themes, potentials and challenges.
Tosti Chiang,Stephen Yang,Chester Huang,Addison Su (2014). Cooperative Learning by Location-Based Augmented Reality for an Inquiry Learning Course.
C Carrera,C Perez,J L S Cantero,J D L T (2017). Teaching with AR as a tool for relief visualization: Usability and motivation study.
Z Turan,E Meral,I Sahin (2018). The impact of mobile augmented reality in geography education: Achievements, cognitive loads and views of university students[J].
C Carrera,C Asensio,L A B (2017). Augmented reality as a digital teaching environment to develop spatial thinking.
C Carrera,C Asensio,L A B (2017). Landscape interpretation with augmented reality and maps to improve spatial orientation skill.
Yuan Ling,Lu Xiao-Xu,Wu Cheng-Ling (2019). The influence of AR technology on middle school students' achievement scale of learning goal-taking the contour map teaching as an example.
Chen Liang-Ying,Zhao Jun-Min,Wang Guangshuai (2019). The application research of augmented reality technology in the intervention of children with autism--taking the lexical cognitive intervention as an example.
Hsien-Sheng Hsiao,Cheng-Sian Chang,Chien-Yu Lin,Yau-Zng Wang (2013). Weather observers: a manipulative augmented reality system for weather simulations at home, in the classroom, and at a museum.
Emin İbili (2018). Effect of augmented reality environments on cognitive load: pedagogical effect, instructional design, motivation and interaction interfaces.
Lu Xiao-Xu,Zhao Yuan,Zhu Hui (2011). The correlation of the presentation of classroom teaching aims of geography with teaching efficiency.
C X Wang,T Fang,Y Gu (2020). Learning performance and behavioral patterns of online collaborative learning: Impact of cognitive load and affordances of different multimedia.
Du Huang Wen-Qian,Sun Feng-Zhen,Yu-Yu (2019). Teaching Geography.
Fred Paas,Jeroen Van Merriënboer (1994). Instructional control of cognitive load in the training of complex cognitive tasks.
Sun Chong-Yong,Liu Dian-Zhi (2013). A comparison of several subjective rating scales of cognitive load [J].
Yang Jian (2020). Attitudes of Public Primary School Students in Jordan towards using Interactive Boards in Classroom: Empirical Study.
M Dunleavy,Dede Mitchell,R (2009). Affordances and limitations of immersive participatory augmented reality simulations for teaching and learning.
Joakim Frederiksen,Stine Sørensen,Lars Konge,Morten Svendsen,Morten Nobel-Jørgensen,Flemming Bjerrum,Steven Andersen (2020). Cognitive load and performance in immersive virtual reality versus conventional virtual reality simulation training of laparoscopic surgery: a randomized trial.
No ethics committee approval was required for this article type.
Data Availability
Not applicable for this article.
How to Cite This Article
Yuan Ling. 2026. \u201cThe Influence of Augmented Reality Technology on the Learning Interest, Achievement of Learning Goals and Cognitive Load of Middle School Students\u201d. Global Journal of Human-Social Science - G: Linguistics & Education GJHSS-G Volume 23 (GJHSS Volume 23 Issue G2): .
Explore published articles in an immersive Augmented Reality environment. Our platform converts research papers into interactive 3D books, allowing readers to view and interact with content using AR and VR compatible devices.
Your published article is automatically converted into a realistic 3D book. Flip through pages and read research papers in a more engaging and interactive format.
In order to test the influence of augmented reality technology on the learning interest, achievement of learning goals and cognitive load, an experimental study was conducted using the contour map teaching as an example. This paper selected 427 students from 8 classes in grade 7 of Zhantan Middle School in Xindu District of Chengdu as experimental samples, Classes with no significant difference in learning basic level were divided into experimental classes and control classes. The experimental classes adopted the AR three-dimensional video as teaching aids to give new lessons and the control classes adopted the traditional twodimensional video, and then the students’ learning interest level, achievement of learning goals and cognitive load were measured. The results showed that the application of augmented reality technology in teaching could improve students’ learning interest and achievement of learning goals, but had no effect on reducing cognitive load.
Our website is actively being updated, and changes may occur frequently. Please clear your browser cache if needed. For feedback or error reporting, please email [email protected]
Thank you for connecting with us. We will respond to you shortly.