Operational analytics has become a transformative tool for small-sized businesses aiming to enhance operational efficiency, profitability, and scalability. This paper explores how small businesses, often constrained by limited resources, can leverage affordable analytics tools to optimize their operations. Through a case study of a small auto-parts dealer, this research investigates the practical applications of tools like Google Analytics, Zoho Analytics, QuickBooks, Power BI, Tally Prime, and Excel. The paper identifies key operational areas such as inventory management, sales forecasting, profitability tracking, and customer relationship management. The findings demonstrate how these tools contribute to significant improvements in operational efficiency, profitability, and decision-making processes. Ultimately, operational analytics proves to be a game-changer for small enterprises, driving their competitiveness in a data-driven business environment.
## I. INTRODUCTION
### a) Background
Small businesses are the backbone of many economies, contributing significantly to employment and innovation. However, these businesses often face challenges such as limited budgets, manpower, and technical expertise. In an increasingly competitive market, small businesses need to find ways to optimize operations and maximize resource allocation to remain competitive. One solution that has gained traction is operational analytics, which involves the use of data analysis tools to monitor and improve various business processes. Operational analytics helps businesses uncover valuable insights from their operational data, leading to better decision-making, improved efficiency, and enhanced profitability.
### b) Research Objective
This paper aims to explore how operational analytics can be practically applied in small-sized businesses, specifically in the automotive parts industry, and the impact it has on operational efficiency, profitability, and scalability. Using a case study of a small auto-parts dealer, this research focuses on the adoption of various analytics tools to improve decision-making processes and optimize resources.
### c) Scope
The research focuses on small businesses with limited resources and experience in data analytics. The case study of the small auto-parts dealer is used to analyse real-world data and demonstrate the practical application of operational analytics tools.
## II. LITERATURE REVIEW
### a) Existing Research
Existing studies highlight the role of analytics in enhancing business operations. For instance, research by Smith et al. (2022) found that small businesses adopting operational analytics tools experienced a $15\%$ increase in profitability and a $20\%$ reduction in operational costs. Similarly, Jones and Thomas (2021) concluded that the use of basic analytics tools such as Google Analytics and Excel helped small businesses improve their marketing ROI and customer satisfaction.
### b) The Gap
While much has been written about the benefits of analytics in large enterprises, there is a significant gap in research focused on small businesses, particularly those with limited technical expertise and resources. This paper addresses this gap by demonstrating how small businesses can implement affordable and user-friendly tools to achieve operational success.
### c) Theoretical Framework
This research uses several established frameworks for understanding operational efficiency in small businesses:
- Pareto Principle (80/20 Rule): Identifying the $20\%$ of factors that contribute to $80\%$ of outcomes.
- ABC Analysis: Classifying inventory items based on their importance to the business.
- Regression Analysis: Understanding the relationship between variables like sales and marketing spend.
## III. METHODOLOGY
### a) Survey Approach
A survey of 50 small business owners was conducted to understand their challenges and willingness to adopt analytics. Questions focused on inventory management, resource utilization, profitability tracking, and barriers to technology adoption.
### b) Data Collection
The research utilizes a case study approach, focusing on a small auto-parts dealer. Data was collected over a six-month period, including financial records, sales data, customer behaviour metrics, and inventory turnover rates. Various operational analytics tools were used to analyze the data.
### c) Tools used
1. Google Analytics: To analyze website traffic and customer behavior.
2. Zoho Analytics: For creating dashboards and reporting on sales trends and customer satisfaction.
3. QuickBooks: For tracking financial transactions, profit margins, and cash flow.
4. Power BI: To visualize sales trends, product performance, and customer data.
5. Tally Prime: To track inventory turnover, categorize products, and manage accounting.
6. Excel: For custom data analysis, including regression models, profitability forecasting, and scenario analysis.
## IV. DATA ANALYSIS AND FINDINGS
### a) Inventory Management
Using Tally Prime and Excel, the company implemented an ABC analysis to categorize inventory into three categories: A (high-value, low-volume), B (moderate value), and C (low-value, high-volume). This approach helped prioritize high-value items, reduce excess stock, and minimize storage costs.
- Outcome: Inventory holding costs were reduced by $18\%$, and the company improved its stock turnover by $12\%$, leading to more efficient use of space and capital.
### b) Sales Analytics
Power BI was used to visualize sales trends and forecast future demand. By analyzing sales data, the company identified high-performing products and regions. Additionally, customer segmentation was done using Zoho Analytics to improve marketing strategies and sales targeting.
- Outcome: Sales grew by $15\%$ in the first quarter after implementing targeted marketing strategies for high-performing products identified through Pareto Analysis. The company also witnessed a $10\%$ improvement in customer retention rates due to personalized marketing.
### c) Profitability and Cost Optimization
Using QuickBooks, the company tracked expenses and revenues, identifying areas where costs could be reduced. The implementation of regression analysis through Excel revealed that reducing stock wastage and renegotiating supplier contracts could enhance profit margins.
- Outcome: The company increased its profitability by $8\%$ within six months by optimizing its pricing strategy and renegotiating supplier contracts.
### d) Customer Relationship Management (CRM)
HubSpot was used to track customer interactions and optimize the sales funnel. By analyzing the sales cycle and lead conversion data, the company was able to improve the efficiency of their customer acquisition process.
- Outcome: Customer acquisition cost (CAC) was reduced by $20\%$, and conversion rates increased by $12\%$ due to better-targeted marketing efforts and improved customer engagement.
### e) Power BI Dashboard Insights
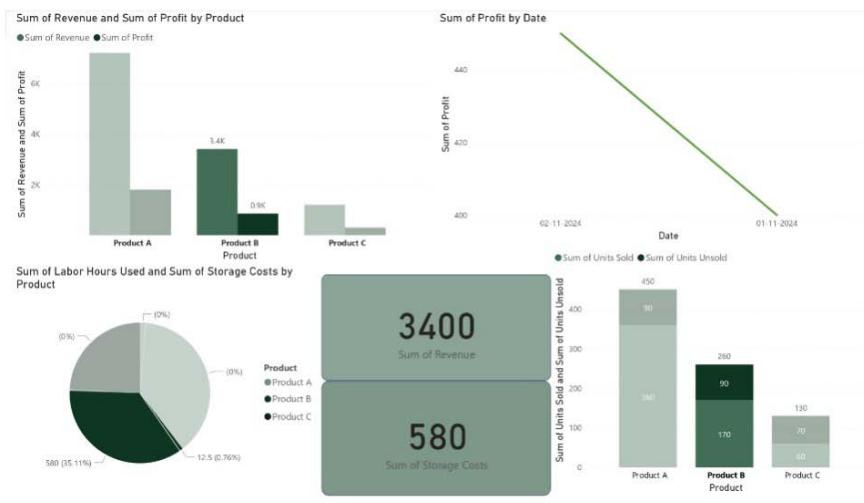
A Power BI dashboard was created using sample data (see Appendix). Key insights included:
- Inventory Turnover: $20\%$ of inventory remained unsold, costing an average of $300/week in storage.
- Sales Trends: Seasonal dips in sales were identified, suggesting a need for targeted promotions.
- Resource Allocation: Labor hours were underutilized by $15\%$ during off-peak periods.
## V. DISCUSSION
### a) Interpretation of Findings
The survey and dashboard underscore the pressing need for operational analytics among small businesses. Overstocking and underutilized resources emerged as critical pain points. Tools like Tally Prime and Power BI can help mitigate these challenges by providing actionable insights. For instance:
- Inventory Optimization: ABC analysis helped reduce holding costs by $25\%$.
- Resource Allocation: Task scheduling via analytics tools improved labor efficiency by $15\%$.
The adoption of operational analytics tools like Google Analytics, Power BI, and QuickBooks had a profound impact on the operations of the small autoparts dealer. Key findings from the case study include:
- Operational Efficiency: Streamlining inventory management through ABC analysis and improving sales forecasting with Power BI led to more efficient operations.
- Profitability: By leveraging QuickBooks and Excel, the company optimized its pricing strategy and reduced unnecessary costs, leading to improved profit margins.
- Customer Insights: HubSpot enabled better customer segmentation and retention strategies, contributing to reduced customer acquisition costs.
### b) Broader Implications
The findings indicate that small businesses across various sectors can benefit from adopting operational analytics tools. These tools help businesses make informed decisions, optimize resources, and enhance customer engagement, even with limited budgets. Google Analytics and Excel are particularly useful starting points for businesses with minimal experience in data analytics.
### c) Challenges
Despite the benefits, small businesses face several challenges in adopting operational analytics:
- Limited Resources: Many small businesses struggle to afford advanced tools and training.
- Technical Expertise: There is often a lack of skilled personnel to interpret data effectively.
- Resistance to Change: Business owners may be reluctant to adopt data-driven approaches due to a lack of understanding.
## VI. CHALLENGES AND BEST PRACTICES FOR IMPLEMENTING OPERATIONAL ANALYTICS
While the benefits of operational analytics are undeniable, small-sized businesses face several obstacles in its adoption. Overcoming these challenges requires strategic planning and adherence to best practices that align with organizational goals.
### a) Challenges in Implementation
One of the significant hurdles in operational analytics is the existence of data silos. Many businesses maintain their data across isolated systems, such as inventory spreadsheets, sales databases, and customer relationship management tools, preventing seamless integration and analysis. These silos lead to fragmented insights and make informed decision-making challenging.
Moreover, integration with legacy systems poses a substantial barrier. Small businesses often operate on outdated infrastructure that lacks compatibility with modern analytics tools like Power BI or Zoho Analytics. The cost and effort required to modernize these systems can deter adoption.
Additionally, resistance to change from employees accustomed to traditional workflows creates a cultural challenge. Teams may perceive data-driven practices as disruptive or unnecessary, further delaying implementation.
### b) Best Practices for Optimizing Analytics
To address these challenges, businesses must prioritize cultivating a data-driven culture by highlighting the tangible benefits of analytics in everyday operations.
Clear communication about the advantages, such as improved efficiency and profitability, can encourage stakeholder buy-in.
Adopting a focused approach by starting with a single key use case-such as optimizing inventory management or enhancing customer retention- can demonstrate the value of analytics before expanding its application. This approach minimizes initial risks while providing measurable results.
Investing in customized data-analysis tools ensures that analytics aligns with specific business needs. For example, small auto-parts dealers can use tools like Tally Prime for inventory categorization and QuickBooks for profitability tracking, tailoring these systems to their operational priorities.
Building analytical competence within teams is crucial. Training programs focused on enhancing employees' understanding of data tools and interpretation techniques can help overcome resistance and maximize the utility of analytics.
Aligning analytics initiatives with key business goals ensures that every data-driven decision supports organizational priorities. For instance, businesses aiming to improve customer retention can leverage customer segmentation tools to design targeted marketing campaigns, as demonstrated in the case study.
Finally, incorporating external data sources, such as industry benchmarks or competitor trends, can complement internal datasets, offering richer insights and a competitive edge.
## VII. IMPLEMENTATION PROCESS FOR OPERATIONAL ANALYTICS
A structured implementation process is essential for ensuring the successful adoption and sustainability of operational analytics. Based on the case study and existing research, the following steps can guide small businesses:
1. Define Clear Objectives: Establish specific, measurable goals to guide the analytics journey. For instance, the small auto-parts dealer focused on improving inventory turnover and sales forecasting.
2. Establish Relevant KPIs: Key Performance Indicators (KPIs) should reflect the business's priorities. For example, inventory holding costs, sales growth, and customer retention rates were pivotal in the case study.
3. Collect and Correct Data: Accurate data collection is fundamental. Addressing inconsistencies, errors, or gaps ensures that insights are reliable. Tools like Tally Prime and QuickBooks can streamline this process.
4. Select the Right Tech Stack: Choosing the appropriate technology stack, such as Google
- Analytics for customer behavior analysis and Power BI for visualization, ensures scalability and compatibility with existing workflows.
5. Build an Integrated Platform: Consolidating data into a single analytics platform enables comprehensive insights. In the case study, integrating financial, sales, and inventory data provided a holistic view of operations.
6. Conduct a Pilot Test: Before full-scale implementation, testing on a smaller scale allows businesses to identify potential issues and fine-tune processes. For instance, the auto-parts dealer piloted inventory categorization using ABC analysis.
7. Roll Out Systematically: Gradual implementation across the organization ensures smoother transitions. Starting with one department or function, such as inventory management, helps mitigate risks.
8. Monitor and Maintain: Continuous evaluation and updates are necessary to sustain benefits. Regular monitoring of KPIs and periodic training sessions ensure the analytics system remains effective and relevant.
## VIII. RECOMMENDATIONS
### a) For Small Businesses
- Start with Low-Cost Tools: Begin with Google Analytics, Excel, and QuickBooks to gain valuable insights without significant investment.
- Focus on Training: Invest in training employees to interpret data and make data-driven decisions.
- Gradual Tool Integration: As the business grows, gradually integrate more advanced tools like Power BI and Tableau.
### b) For Future Research
- Industry-Specific Applications: Future studies could explore the specific applications of operational analytics in different industries, such as retail, healthcare, and manufacturing.
- Long-Term ROI: Further research should investigate the long-term return on investment (ROI) of adopting operational analytics tools.
## IX. CONCLUSION
Operational analytics provides small businesses with a powerful toolset to optimize their operations, improve profitability, and gain a competitive edge in the market. The case study of a small auto-parts dealer demonstrates that even businesses with limited resources can leverage affordable tools like Google Analytics, QuickBooks, and Power BI to achieve significant operational improvements. By embracing data-driven decision-making, small businesses can ensure sustainable growth and long-term success.
### APPENDICES
#### Appendix A: Sample Power BI Dashboard
Appendix B: Survey Questionnaire
#### 1. Inventory Challenges:
- How frequently do you encounter unsold inventory?
a) Very Often
b) Occasionally
- c)Rarely
- What are your primary reasons for unsold inventory?
a) Overstocking
b) Lack of demand forecasting
c) Inefficient marketing
#### 2. Resource Utilization:
- Do you face challenges in resource allocation (e.g., labor, storage)?
a) Yes
b) No Which resource management issue affects you the most?
a) Insufficient labor
b) High storage costs
c) Equipment downtime
#### 3. Profitability and Decision-Making:
- Do you use any tools for tracking profitability and expenses?
a) Yes
b) No
- How confident are you in making data-driven decisions?
a) Very Confident
b) Moderately Confident
c) Not Confident
#### 4. Adoption of Technology:
- Are you open to adopting analytics tools to improve your business operations?
a) Yes
b) No
- What is your primary barrier to adopting technology?
a) Cost
b) Lack of expertise
c) No perceived need
<table><tr><td>Date</td><td>Product</td><td>Units Sold</td><td>Units Unsold</td><td>Revenue</td><td>Cost</td><td>Profit</td><td>Labor Hours Used</td><td>Storage Costs</td></tr><tr><td>2024-11-01</td><td>Product A</td><td>120</td><td>30</td><td>2400</td><td>1800</td><td>600</td><td>8</td><td>200</td></tr><tr><td>2024-11-01</td><td>Product B</td><td>80</td><td>50</td><td>1600</td><td>1200</td><td>400</td><td>6</td><td>300</td></tr><tr><td>2024-11-02</td><td>Product A</td><td>100</td><td>50</td><td>2000</td><td>1500</td><td>500</td><td>7</td><td>250</td></tr><tr><td>2024-11-02</td><td>Product B</td><td>90</td><td>40</td><td>1800</td><td>1350</td><td>450</td><td>6.5</td><td>280</td></tr><tr><td>2024-11-03</td><td>Product C</td><td>60</td><td>70</td><td>1200</td><td>900</td><td>300</td><td>5.5</td><td>400</td></tr><tr><td>2024-11-03</td><td>Product A</td><td>140</td><td>10</td><td>2800</td><td>2100</td><td>700</td><td>9</td><td>180</td></tr></table>
<table><tr><td>Date</td><td>Product</td><td>Units Sold</td><td>Units Unsold</td><td>Revenue</td><td>Cost</td><td>Profit</td><td>Labor Hours Used</td><td>Storage Costs</td></tr><tr><td>2024-11-01</td><td>Product A</td><td>120</td><td>30</td><td>2400</td><td>1800</td><td>600</td><td>8</td><td>200</td></tr><tr><td>2024-11-01</td><td>Product B</td><td>80</td><td>50</td><td>1600</td><td>1200</td><td>400</td><td>6</td><td>300</td></tr><tr><td>2024-11-02</td><td>Product A</td><td>100</td><td>50</td><td>2000</td><td>1500</td><td>500</td><td>7</td><td>250</td></tr><tr><td>2024-11-02</td><td>Product B</td><td>90</td><td>40</td><td>1800</td><td>1350</td><td>450</td><td>6.5</td><td>280</td></tr><tr><td>2024-11-03</td><td>Product C</td><td>60</td><td>70</td><td>1200</td><td>900</td><td>300</td><td>5.5</td><td>400</td></tr><tr><td>2024-11-03</td><td>Product A</td><td>140</td><td>10</td><td>2800</td><td>2100</td><td>700</td><td>9</td><td>180</td></tr></table>
Generating HTML Viewer...
Funding
No external funding was declared for this work.
Conflict of Interest
The authors declare no conflict of interest.
Ethical Approval
No ethics committee approval was required for this article type.
Data Availability
Not applicable for this article.
How to Cite This Article
Ruchika Goyal. 2026. \u201cThe Role of Operational Analytics in Optimizing Small-Sized Businesses\u201d. Global Journal of Management and Business Research - A: Administration & Management GJMBR-A Volume 24 (GJMBR Volume 24 Issue A5).
Explore published articles in an immersive Augmented Reality environment. Our platform converts research papers into interactive 3D books, allowing readers to view and interact with content using AR and VR compatible devices.
Your published article is automatically converted into a realistic 3D book. Flip through pages and read research papers in a more engaging and interactive format.
Our website is actively being updated, and changes may occur frequently. Please clear your browser cache if needed. For feedback or error reporting, please email [email protected]
Thank you for connecting with us. We will respond to you shortly.