Rice mill workers can be considered as the lifeline to maintain the country’s food security. More than half of them were female. However, a few studies focused on socioeconomic conditions and well-being of rice mill workers. The present study aimed to assess the social well-being of female rice mill workers in Bangladesh and socio-economic factors affecting it. The data were collected from a sample of 398 female rice mill workers (age mean = 31.82 years, SD = 8.39 years) who were selected through mixed sampling method. The data were collected using face-to-face interview with a structured questionnaire. The questionnaire included questions about personal information, education, income, living environment, health, violence, belongingness, equality, working environment, and social well-being. Results showed that there was a lower household income, a lower standard of living environment, lack of health and recreational facilities, unhealthy working environment, and a lower social well-being of female rice mill workers.
## I. INTRODUCTION
The participation of both males and females in economic activities is essential for any economy. It is assumed that women's entry into the labor market or the sphere of non-household activities is an important route to development [1]. In rural Bangladesh, poverty mitigation is hardly achieved unless women are encouraged to participate in income-generating activities outside the homestead [2].
Bangladesh is a developing country, and agriculture is the most important sector of our economy.
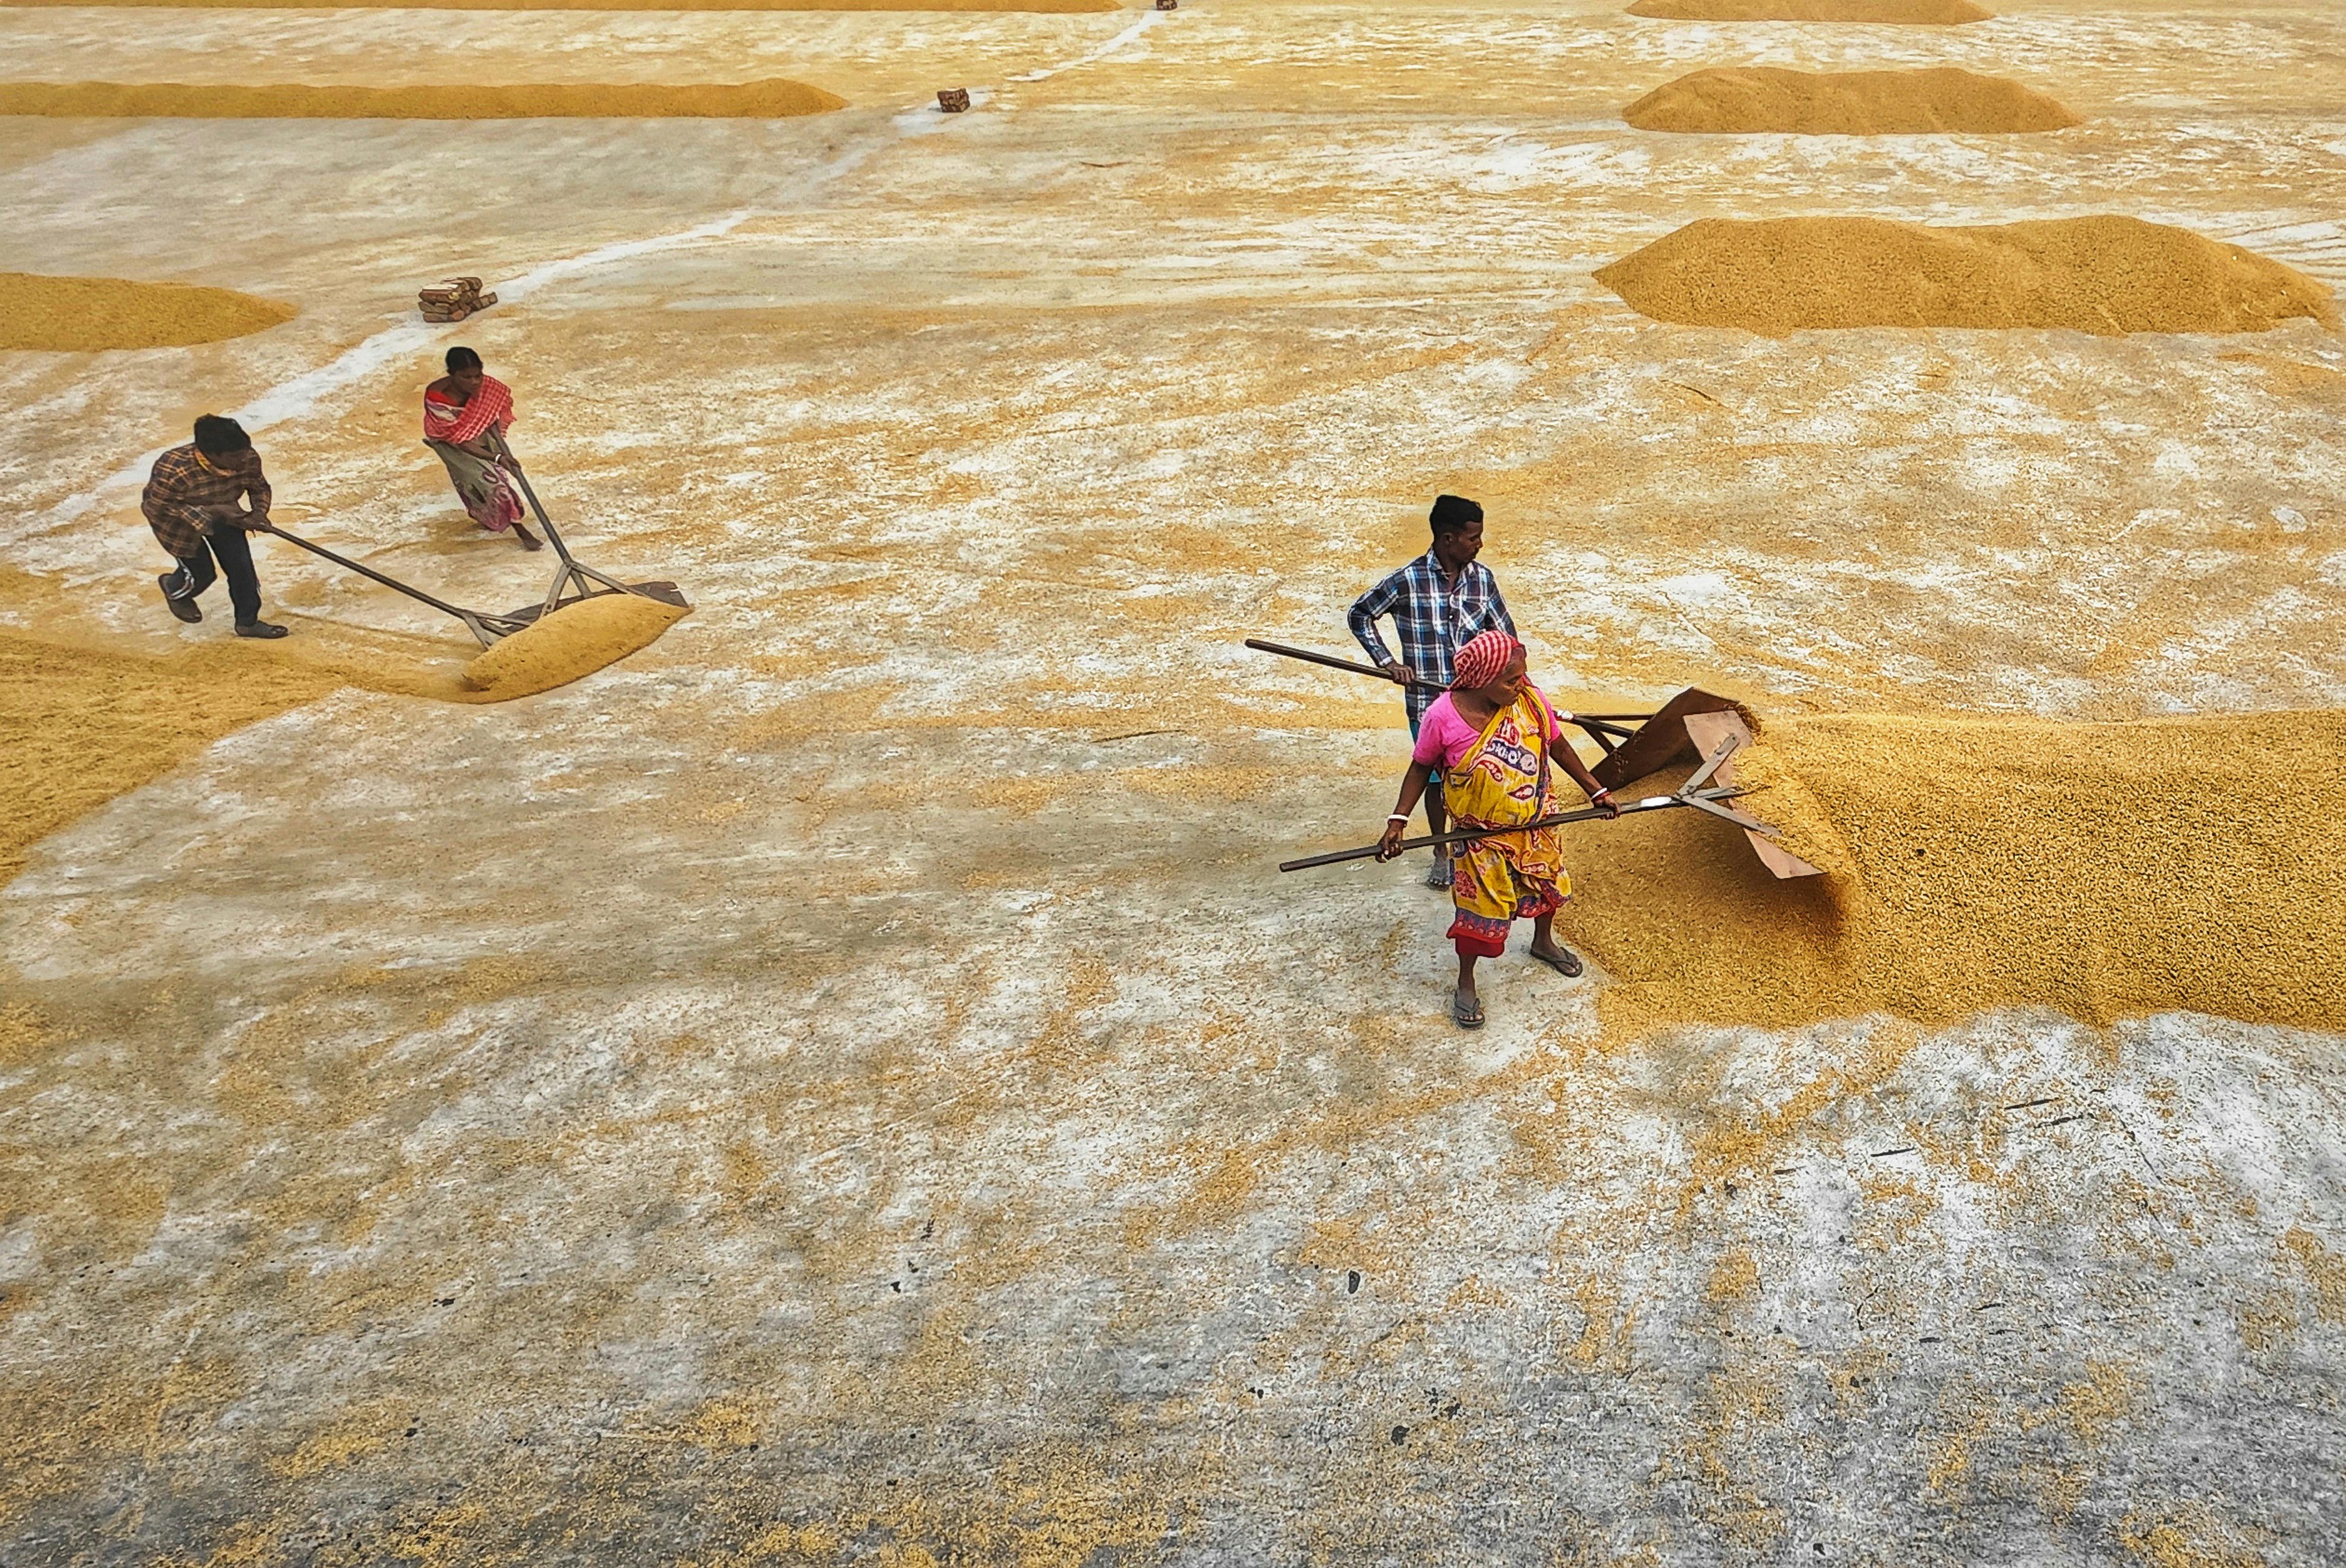
It contributed $11.2\%$ of the GDP in the 2022-23 fiscal year [3]. This sector employs around $44\%$ of the total workforce of the country [4], a significant portion of which comprises women. Rice is the primary agricultural crop which is the $85.7\%$ of food grains produced in Bangladesh [3] and a major focus of agriculture revolves around rice production and processing. There are a total of 20,295 government-enlisted rice mills for rice processing in Bangladesh [5]. Although rice mills are becoming automated day by day [6], traditional rice processing system is dominating till now [5, 7]. Rice mills heavily rely on human labor, employing nearly 5 million workers across various rice mills.
Rice mill workers' living standard and socioeconomic condition is not good as like other 'pink collar job'. Their average monthly income is below the poverty line by income [8]. Majority of the workers did not have any formal education [9, 10]. They spent the largest portion their income for food (80%) and a little for treatment (3%), clothing (4%), and recreation (3%) [2]. They had no job security, paid leave, and other financial benefits other than salary [2, 11]. Non-friendly working environment, health hazard like dust pollution, noise pollution, etc. are common scenarios in rice mills [12-14]. Roy et al. [15] found the musculoskeletal discomfort, hypertension, and chronic respiratory morbidity as the commonest morbidities among rice mill workers in West Bengal, India. Although there is information about living standards and socio-economic conditions of the rice mill workers, none of the studies assessed the social well-being of this group of working people.
Social well-being is one's evaluation of one's social relationships and interaction with social institutions and communities [16]. Earlier, it was viewed as an objective and social level indicator (e.g., gross domestic product) [17, 18]. Next, it was expanded to behavioral measures (e.g., community or group membership) [19] and now it is delved deeper to individual-level forms like perceived social support [20]. Social well-being has various dimensions such as the level of living, the quality of life, social satisfaction, the standard of living, etc., [21]. Smith [22] outlines several general criteria for assessing social well-being: income, wealth, and employment, living environment, health, education, social order, social belonging, and recreation and leisure.
Best to the authors knowledge, none of the previous studies assessed the social well-being of the female rice mill workers. Therefore, the present study aimed to assess the social well-being of female rice mill workers in Bangladesh. In rice mills, more than $60\%$ were female rice mill workers [23]. Especially, $90\%$ of the laborers are female in husking rice mills (small rice mills) [9]. Khatun et al. [11] found that female rice mill workers paid less than male rice mill workers in $95\%$ cases. In addition, culturally women in Bangladesh have longer working hours and are doing household activities in addition their work outside the home, Therefore, the present study aimed to investigate the social well-being of female rice mill workers in Bangladesh and provide insight into their contextual circumstances. Additionally, this study also aimed to identify the socio-economic factors influencing their social well-being.
## II. METHOD
### a) Participants
Among the 64 administrative districts, 60 had the enlisted rice mills [5]. Among these 60 administrative districts, BrahmanBaria administrative district was chosen using convenience sampling technique. The largest number of rice mill in the eastern part of Bangladesh were in BrahmanBaira. In BrahmanBaria, all rice mills were located in three areas (Ashuganj, Sarail, and BrahmanBaria Sadar). In the next stage, 15 rice mills were selected randomly. In the final stage, 400 female workers from these 15 selected rice mills were invited (selected using the convenience sampling technique) to take part in this study and all of them provided consent to participate. Based on priori power calculation (small-to-medium effect size $(r =.20)$, $\alpha =.05$, $80\%$ power, minimum sample size $(N) = 194$ [24]. The total number of participants was above the minimum required participants. The data from these participants were collected through face-to-face interviews using a structured questionnaire. Before conducting the interview, study objectives, benefits and risks, the confidentiality of their responses, and time and process of data collection were communicated with the participants. As the majority of the participants had no formal education, completion of the interview is considered as the informed consent, although verbal consent was taken before starting the interview. Participants received a token gift worth USD1.00 for participating in this study. After excluding missing data, the number of participants were 398 (age mean = 31.82 years, SD = 8.39 years).
### b) Measures
The study questionnaire included questions about personal information, and questions about education, income, living environment, health, violence, belongingness, equality, and working environment, and the Social Well-being Scale Short Form [25].
## i. Questions about personal information
This part of the questionnaire included questions about the participants' district of the permanent residents, marital status, family type, number of family members, number of children, whether children go to school, and types of schools that children are studying.
## ii. Questions about education, income, living environment, health, violence, belongingness, equality, and working environment
In this part of the questionnaire, the participants were asked to report their educational level, yearly household and personal income, the number of earning members, whether they took advance from the rice mill authority, amount of advance, purposes of using the advance, their mode of payment wage, how many years they work here, do they get extra payment during the season, etc.
About their living environment, they were asked to report where they live, number of rooms where they are living, number of bathrooms there, number of families use these bathrooms, and whether these are hygienic or not. Regarding health, they were asked where they take treatment, whether mill authority provides treatment facilities, financial help, and grant leave while sick. Additionally, they were asked whether they suffer from long-run physical illnesses after starting to work here and whether they feel frustrated or not. They were also asked to report whether there were any entrainment facilities for them and also for their children.
Regarding violence, the participants were asked whether they faced problems working as female worker, whether they were the victim of sexual harassment, and whether they victims of beating and mocking while working. About belongingness, they were asked whether they get help from other co-workers to complete their tasks. Questions about equality contained questions about perceived discrimination in wages, working hours, and bonuses due to being a female worker. About the working environment, they were asked to rate their working environment on a five-point scale (ranging from very good to very bad).
## iii. Social Well-being Scale Short Form
The Social Well-being Scale Short Form [25] assesses five dimensions of social well-being (i.e., social integration, social acceptance, social actualization, social coherence, and social contribution). The Bangla version of the Social Well-being Scale Short Form [26] was utilized in this study. Participants responded on this scale using a Five-point Likert-type scale, ranging from strongly disagree (1) to strongly agree (5). The mean score was utilized in this study. Total scores ranged between 1 and 5. Scores above 3 suggest better social well-being and scores below 3 suggest worse social well-being. The confirmatory factor analysis results of the five-factor correlated model had an acceptable model fit $(\chi^2 /\mathrm{df} = 4.319$, CFI $=.942$ GFI $=.949$, RMSEA $=.095$
### c) Statistical analysis
In this study, IBM SPSS v26 was utilized for data management and data analysis. Descriptive statistics (frequency, percentages, range, mean, and standard deviation) and multiple linear regression were run to analyze the data. In multiple linear regression, social well-being was the outcome variable and socio- demographic variables, education, income, living environment, health, violence, belongingness, equality, and working environment were predictor variables.
### d) Ethics
The present study was approved by the Animal Ethics Review Board (AERB), Faculty of Biological Sciences, University of Chittagong, Chattogram-4331 (AERB-FBSCU-20230905). This AERB is authorized to approve research with human samples.
## III. RESULTS AND DISCUSSION
Table 1: Distribution of the demographic information of the study participants
<table><tr><td></td><td>Categories</td><td>Percentage/ Range/Mean</td></tr><tr><td rowspan="6">Permanent resident</td><td>Netrokona</td><td>26.9%</td></tr><tr><td>Sunamganj</td><td>15.8%</td></tr><tr><td>Kishoreganj</td><td>12.2%</td></tr><tr><td>Mymensingh</td><td>11.1%</td></tr><tr><td>BrahmanBaria</td><td>9.5%</td></tr><tr><td>Others</td><td>24.5%</td></tr><tr><td>Marital status</td><td>Married</td><td>100%</td></tr><tr><td rowspan="2">Family type</td><td>Nuclear</td><td>91.8%</td></tr><tr><td>Extended</td><td>8.2%</td></tr><tr><td>Number of family members</td><td></td><td>1-12</td></tr><tr><td>Having children</td><td>Yes</td><td>98.4%</td></tr><tr><td>Number of children (n=362)</td><td></td><td>1-6</td></tr><tr><td rowspan="2">Education</td><td>No formal education</td><td>87.8%</td></tr><tr><td>Primary</td><td>12.2%</td></tr><tr><td>Do your children go to school? (n=362)</td><td>Yes</td><td>24.5%</td></tr><tr><td rowspan="4">Type of school that children studying (n=90)</td><td>Govt.</td><td>65.6%</td></tr><tr><td>Non-govt.</td><td>31.1%</td></tr><tr><td>Semi-govt.</td><td>1.1%</td></tr><tr><td>Run by NGO</td><td>2.2%</td></tr><tr><td>Household income (Yearly)</td><td></td><td>USD 820.76 (SD = 547.97)</td></tr><tr><td>Personal income (Yearly)</td><td></td><td>USD 181.23 (SD = 11.92)</td></tr></table>
Table 1 demonstrates the participants' demographic information. Most of the participants (90%) were from outside of the working district (Brahman Baria). All of them are married and 91.8% were living in a nuclear family. Regarding education, 87.8% have no formal education. Consequently, they are in the dark about the current situation of the country and the world due to a lack of formal education. Their consciousness about their rights in the workplace is also related to their education. Among participants (98.4%) who reported that they have children, 24.5% informed that their children go to school. The yearly household income average is USD 820.76 (SD = USD 547.97) and personal yearly income average is USD 181.23 (SD = USD 12). Their household income is much lower than the national household income reported in the Household Income and Expenditure Survey 2022 [27]. According to this report, the average monthly household income is USD 294.96 (National Level). Compared to the national household income statistics, the rice mill workers' household income is less than half. This lower household income reflects their poverty level.
Table 2 demonstrates information about participants' wages. Almost all the participants (99.5%) took advance (M = USD1518.43, SD= USD 996.12) from the mill authority before starting to work there. This advance would be taken for one to three years (based on personal observation). Among the participants, $89.1\%$ spent the advance to pay loans from NGO or local 'Mahajons' (who lend money at a high-interest rate to village people), $64.9\%$ spent on medical expenses, $19.8\%$ spent as daily expenses, $11.4\%$ spent on repairing their house in the village, $10.1\%$ spent on marriage expenses, $9\%$ spent to buy cattle, and $5.4\%$ to buy land. They make the payment of the advance they had taken by installment from their wages. The mill owners pay wages after deducting the installment amount. Almost all of them receive rice $(99.2\%)$ as their wages. Their working duration in the mill ranged between 1 and 36 years. From the authors' observation, they are bound to pay the advances by working in the rice mill. Due to the lower amount of wage, they have to take advances more from the mill owners to meet sudden crisis like severe illness, marriage, etc. Therefore, they have been working here for a long time. Their poverty is the reason to be working here for a long time.
Table 2: Information about wages
<table><tr><td></td><td>Categories</td><td>Percentage/ Range/Mean</td></tr><tr><td>Did you take advance from the mill owner as wage/ loan?</td><td>Yes</td><td>99.5%</td></tr><tr><td>Amount of advance</td><td></td><td>USD 1518.43 (USD 996.12)</td></tr><tr><td rowspan="7">Usage of advance (Multiple responses)</td><td>Loan payment</td><td>89.1%</td></tr><tr><td>Meet medical expenses</td><td>64.9%</td></tr><tr><td>Meet daily expenses</td><td>19.8%</td></tr><tr><td>Repairing house</td><td>11.4%</td></tr><tr><td>Meet marriage expenses</td><td>10.1%</td></tr><tr><td>Buy cattle</td><td>9.0%</td></tr><tr><td>Buy land</td><td>5.4%</td></tr><tr><td rowspan="2">Medium of wage payment</td><td>Rice</td><td>99.2%</td></tr><tr><td>Rice and money</td><td>0.8%</td></tr><tr><td>How many years have you been working here?</td><td></td><td>1-36 years</td></tr></table>
Table 3: Information about basic needs
<table><tr><td></td><td>Categories</td><td>Percentage/ Range/ Mean</td></tr><tr><td>Where do you live?</td><td>In Mill</td><td>100%</td></tr><tr><td rowspan="3">How many rooms for your family members?</td><td>One room</td><td>80.7%</td></tr><tr><td>Two rooms</td><td>15.2%</td></tr><tr><td>Three rooms</td><td>3.8%</td></tr><tr><td rowspan="3">How many bathrooms in the mill</td><td>Two</td><td>66.0%</td></tr><tr><td>Three</td><td>29.6%</td></tr><tr><td>Four</td><td>4.3%</td></tr><tr><td rowspan="3">How many families use these bathrooms</td><td>4-8 families</td><td>4.0%</td></tr><tr><td>10-12 families</td><td>56.5%</td></tr><tr><td>>12 families</td><td>39.2%</td></tr><tr><td>Are these bathrooms hygienic?</td><td>No</td><td>99.7%</td></tr><tr><td rowspan="2">From where do you and your family members take health services? (Multiple response)</td><td>Pharmacy</td><td>95.4%</td></tr><tr><td>Hospital</td><td>68.8%</td></tr><tr><td>Does the mill authority provide health facilities?</td><td>No</td><td>100%</td></tr><tr><td>Does the mill authority provide financial help, if get sick?</td><td>No</td><td>99.7%</td></tr><tr><td>Does the mill authority grant leave, if get sick?</td><td>No</td><td>100%</td></tr><tr><td>Do you have any physical problem after starting to work here?</td><td>Yes</td><td>99.5%</td></tr><tr><td rowspan="4">Physical problems (multiple response)</td><td>Fever</td><td>98.6%</td></tr><tr><td>Body aches</td><td>82.3%</td></tr><tr><td>Sick due to cold</td><td>58.7%</td></tr><tr><td>Breathing problem</td><td>45.1%</td></tr><tr><td>Is there any entertainment facility at the mill?</td><td>No</td><td>99.7%</td></tr><tr><td>Is there any entertainment facility for your children at the mill?</td><td>No</td><td>99.7%</td></tr></table>
Table 3 demonstrates the information about basic needs. All the participants were living in the houses adjacent to the rice mills. Four-fifths of them were living in a single room provided by mill owners. Regarding bathroom facilities, $66.0\%$ of them reported that there were two bathrooms, $29.6\%$ reported three bathrooms and $4.3\%$ reported four bathrooms only. Regarding the number of families that use these bathrooms, $56.5\%$ of participants informed that 10-12 families were using these and $39.2\%$ informed that more than 12 families were using these. Almost all the participants reported that these bathrooms were unhygienic. Regarding treatment, $99.7\%$ of the participants took treatment from the local pharmacy, and $68.8\%$ went to the hospital. Participants also reported that mill authorities did not provide health facilities $(100\%)$, financial help $(99.7\%)$, or even did not grant leave to them $(100\%)$ while they were sick. Almost all the participants were suffering from long-run physical illnesses after starting to work here (i.e., fever [98.6%], body aches [82.3%], sickness due to cold [58.7%], and breathing problems [45.1%]). Similar results were
reported in previous studies on rice mill workers that conducted in Bangladesh and India [13, 14, 28]. There was an absence of entertainment facilities for the participants and also for their children.
Table 4: Information about the working environment
<table><tr><td></td><td>Categories</td><td>Percentage/ Range/Mean</td></tr><tr><td>As a female worker, do you face problem to work here</td><td>No</td><td>98.6%</td></tr><tr><td>Do you victim of sexual harassment in the mill</td><td>No</td><td>99.5%</td></tr><tr><td rowspan="4">Do you victim of beating and mocking while working here</td><td>Often</td><td>15.5%</td></tr><tr><td>Sometimes</td><td>21.2%</td></tr><tr><td>Hardly</td><td>59.6%</td></tr><tr><td>Never</td><td>3.8%</td></tr><tr><td rowspan="4">Do you get help from co-workers to complete your task</td><td>Always</td><td>4.9%</td></tr><tr><td>Often</td><td>63.9%</td></tr><tr><td>Sometimes</td><td>17.4%</td></tr><tr><td>Hardly</td><td>13.9%</td></tr><tr><td>Do you feel frustrated to work here?</td><td>Yes</td><td>98.6%</td></tr><tr><td>Is there discrimination in wage due to be a female worker?</td><td>Yes</td><td>99.7%</td></tr><tr><td>Is there discrimination in working hours due to be a female worker?</td><td>No</td><td>99.7%</td></tr><tr><td>Is there discrimination in bonus due to be a female worker?</td><td>Yes</td><td>99.2%</td></tr><tr><td>Do you have same workload throughout the year?</td><td>No</td><td>99.2%</td></tr><tr><td rowspan="3">How you rate the working environment at the mill?</td><td>Not good, not bad</td><td>2.7%</td></tr><tr><td>Bad</td><td>75.5%</td></tr><tr><td>Very bad</td><td>21.7%</td></tr></table>
Table 5: Regression results of predicting the social well-being of the female rice mill workers
<table><tr><td></td><td colspan="3">Unstandardized
Coefficients</td><td colspan="3">95.0% CI for B</td></tr><tr><td></td><td>B</td><td>Std. Error</td><td>Standardized beta</td><td>p-value</td><td>Lower</td><td>Upper</td></tr><tr><td>(Constant)</td><td>5.830</td><td>3.072</td><td></td><td>.059</td><td>-.213</td><td>11.873</td></tr><tr><td>Number of family member</td><td>.018</td><td>.021</td><td>.053</td><td>.386</td><td>-.023</td><td>.060</td></tr><tr><td>Education</td><td>-.118</td><td>.027</td><td>-.212</td><td><.001</td><td>-.171</td><td>-.064</td></tr><tr><td>Household income (yearly)</td><td><.001</td><td>.000</td><td>-.088</td><td>.088</td><td>.000</td><td>.000</td></tr><tr><td>Personal income (yearly)</td><td><.001</td><td>.000</td><td>-.008</td><td>.873</td><td>.000</td><td>.000</td></tr><tr><td>Number of earning members</td><td>.102</td><td>.056</td><td>.144</td><td>.072</td><td>-.009</td><td>.213</td></tr><tr><td>Amount of advance</td><td><.001</td><td>.000</td><td>-.240</td><td><.001</td><td>.000</td><td>.000</td></tr><tr><td>Number of rooms for living</td><td>-.178</td><td>.089</td><td>-.153</td><td>.046</td><td>-.352</td><td>-.003</td></tr><tr><td>Number of bathrooms</td><td>-.015</td><td>.077</td><td>-.014</td><td>.843</td><td>-.166</td><td>.136</td></tr><tr><td>Number families use these bathroom</td><td>-.029</td><td>.013</td><td>-.159</td><td>.029</td><td>-.056</td><td>-.003</td></tr><tr><td>Bathroom – hygienic</td><td>-1.170</td><td>.585</td><td>-.100</td><td>.046</td><td>-2.321</td><td>-.019</td></tr><tr><td>Financial help from mill authority, while sick</td><td>.205</td><td>.530</td><td>.018</td><td>.700</td><td>-.839</td><td>1.248</td></tr><tr><td>Grant leave, while sick</td><td>-1.038</td><td>.294</td><td>-.198</td><td><.001</td><td>-1.615</td><td>-.460</td></tr><tr><td>Faced problem as female workers to work</td><td>.974</td><td>.409</td><td>.118</td><td>.018</td><td>.169</td><td>1.778</td></tr><tr><td>Victim of sexual harassment</td><td>.191</td><td>.050</td><td>.251</td><td><.001</td><td>.094</td><td>.289</td></tr><tr><td>Help form co-workers</td><td>.021</td><td>.050</td><td>.028</td><td>.671</td><td>-.078</td><td>.121</td></tr><tr><td>Feeling frustrated</td><td>-.085</td><td>.239</td><td>-.016</td><td>.724</td><td>-.554</td><td>.385</td></tr><tr><td>Discrimination – wage</td><td>-.372</td><td>.793</td><td>-.032</td><td>.640</td><td>-1.932</td><td>1.189</td></tr><tr><td>Discrimination – working hour</td><td>-1.791</td><td>.758</td><td>-.153</td><td>.019</td><td>-3.283</td><td>-.299</td></tr><tr><td>Discrimination – bonus</td><td>.173</td><td>.529</td><td>.026</td><td>.744</td><td>-.868</td><td>1.214</td></tr><tr><td>Entertainment facilities</td><td>.273</td><td>.529</td><td>.023</td><td>.607</td><td>-.769</td><td>1.314</td></tr><tr><td>Entertainment facilities for children</td><td>.400</td><td>.529</td><td>.034</td><td>.450</td><td>-.641</td><td>1.441</td></tr><tr><td>Mill environment</td><td>.130</td><td>.065</td><td>.098</td><td>.046</td><td>.002</td><td>.258</td></tr><tr><td>Extra wage</td><td>.202</td><td>.526</td><td>.017</td><td>.702</td><td>-.834</td><td>1.237</td></tr><tr><td>Duration of works</td><td>-.010</td><td>.006</td><td>-.097</td><td>.086</td><td>-.022</td><td>.001</td></tr></table>
Table 4 demonstrates the information about the working environment. Most participants did not face any problems working as female workers (98.6%) and almost none of them experienced sexual harassment in the mill. However, 15.5% of the participants often, 21.2% of the participants sometimes, and 59.6% of participants were hardly victims of beating and mocking while working. There are some findings that need to get attention from all relevant stakeholders. Almost two-thirds of participants reported that their co-workers often help them to complete their tasks. Almost all the participants feel frustrated with working here and feel discrimination in wages and bonuses due to being female workers. Among them, 75.5% rated their working environment as bad and 21.7% as very bad. Living facilities, health facilities, and leave and recreation facilities in the mills would be the reasons for rating as the bad working environment. Besides, rice husk, bran, effluents from fuel, used water, sound pollution, etc., are also present in working environments in rice mills. Overall, the working environment in rice mills is not worker friendly.
The mean social well-being score is 2.142 (SD =.608) that suggested that their social well-being condition is below average. Results in Table 5 show that participants' income, education, and current socio-environmental conditions contribute to $31.4\%$ variability $(F = 6.544, p < 0.001)$ of their social well-being. Among factors, education $(\beta = -0.212, p < 0.001)$, amount of advance $(\beta = -0.240, p < 0.001)$, number of rooms for living $(\beta = -0.153, p = 0.046)$, number families use bathrooms $(\beta = -0.159, p = 0.029)$, bathroom-hygiene $(\beta = -0.100, p = 0.046)$, grant leave $(\beta = -0.198, p < 0.001)$, discrimination - working hour $(\beta = -0.153, p = 0.019)$ are negatively associated with social wellbeing. Perceiving problem as female worker to work $(\beta = 0.118, p = 0.018)$, victim of sexual harassment $(\beta = 0.251, p < 0.001)$, and mill environment $(\beta = 0.098, p = 0.046)$ are positively associated with social well-being. Weech-Maldonado et al [29] have found perceived income and health as significant predictors of happiness. They reported that perceived health mediated the association between perceived income and happiness. Taghavi et al [30] explored possible predictors of Iranian industrial workers' health and quality of life and opined that "work-related factors including unhealthy working conditions, unsafe working environments, long working hours, irregular working schedules, and the lack of occupational training may negatively influence the HRQOL of workers." In this study, none of the conditions (e.g., financial, housing, health, hygiene, working environment, etc.) are favorable to female rice mill workers. The impact of these conditions is reflected in the poor social well-being of female rice mill workers.
### a) Recommendations
The study findings suggested poor livelihood and social well-being among female rice mill workers. Based on these findings, there are several recommendations as follows:
i) Wages: The wages of female rice mill workers are very low to maintain daily needs. Therefore, wages should be increased considering the present market prices of goods. ii) Housing Facilities: As housing facilities are provided by mill owners, quality housing facilities including sufficient number of rooms for living and number of hygienic bathrooms should be ensured. iii) Health Facilities: As the rice mill workers has limited access to health facilities, the mill owner should ensure access to health facilities by contributing the cost of medication, doctor consultancy fees, etc. iv) Leave Facilities: The rice mill owner should introduce paid leave facilities for female workers in addition to annual festival leave.
v) Recreation Facilities: The rice mill owners should increase recreation facilities for workers (i.e., television with dish antenna connection in the mill, yearly picnic, etc.). It will ensure the female rice mill workers' productivity. vi) *Eradication of Harassment against Female Workers*: Results showed that a significant number of the participants were victims of beating and mocking while working. The rice mill owners should ensure women's rights not to be victims of harassment at workplace. Government bodies and NGOs can run a campaign to make aware the rice mill workers and mill authorities also.
## IV. CONCLUSION
Lower household income, limited access to treatment and recreational facilities, absence of paid leave, poor working environment, and lower social well-being depicted the hardships faced by the female rice mill workers in Bangladesh. Rice mill owners, the government, and non-governmental organizations should come forward to enhance the living standards and well-being of these workers. Improved living standards and social well-being, in turn, result in greater productivity from the workers.
The present study has several limitations. Firstly, the data was collected from rice mills located in the Brahmanbaria administrative district. Potential users should be cautious while attempting to generalize these findings to female rice mill workers working in rice mills located in other districts of Bangladesh. Secondly, self-reported data was utilized in this study, which may be subject to social desirability bias.
Generating HTML Viewer...
References
30 Cites in Article
T Choudhuri (2014). Women and Urban Informal Sector: The Case of Rice Mill Workers in Burdwan, West Bengal.
M Rahman,M Hasan (2011). Poverty reduction through women employment in farms and rice mills in an area of Dinajpur district.
Tasruzzaman Babu,Morium Akter (2023). Areas of green tribology: A review.
(2022). District-wise Govt. enlisted the number of rice mills and their fortnightly capacity of Boro milling: Boro season 2021.
Arifur Rahman,Al Mamun,Nabihatul Afrooz,Subrata Howlader,A. B. M. Qudrot- E-Khuda (2017). Rice Processing Industry of Bangladesh: An Economic Analysis.
M Islam (2014). Rice Milling in Bangladesh: Staging Spectacular Rise.
H Kabir,M Maple,M Islam,K Usher (2021). A qualitative study of the working conditions in the readymade garment industry and the impact on workers' health and wellbeing.
M Kabir (2017). Development of Rice Milling Industry and Employment Generation: Policy Options for the Betterment of Rice Mill Workers in Bangladesh.
N Sultana,M Afrad (2014). Women"s Participation in Rice Mills in Sherpur Sadar Upazila of Bangladesh.
M Khatun,A Sayed,M Sakib,M Awal,M Rahman (2015). Impact of the Working Environment on Women Workers in Rice Mills in Sherpur District of Bangladesh.
M Desai,S Ghosh (2003). Aflatoxin Related Occupational Hazards Among Rice Mill Workers.
P Eshwaramma,Sudeena Sudeena,K Subhakar,D Chaladevi (2016). A study of Respiratory disorders in rice mill workers of the Mahaboobnagar and to compare with the control group from same district.
G Kumar,K Dewangan,A Sarkar,A Kumari,B Kar (2008). Occupational Noise in Rice Mills.
Soumit Roy,Aparajita Dasgupta,Lina Bandyopadhyay,Bobby Paul,Sayanti Bandyopadhyay,Mukesh Kumar (2020). Morbidities of rice mill workers and associated factors in a block of West Bengal: A matter of concern.
A Mcdowell,C Newell,Ian Mcdowell (2006). Measuring Health.
Frank Andrews,Stephen Withey (1976). Social Indicators of Well-Being.
Ross Mitchell,John Parkins (2011). The Challenge of Developing Social Indicators for Cumulative Effects Assessment and Land Use Planning.
Jennifer Robinette,Susan Charles,Jacqueline Mogle,David Almeida (2013). Neighborhood cohesion and daily well-being: Results from a diary study.
J Cramm,H Van Dijk,A Nieboer (2013). The Importance of Neighborhood Social Cohesion and Social Capital for the Well Being of Older Adults in the Community.
P Palit (2017). A Study on the Social Well Being of Rice Mill Workers in Burdwan City and Adjoining Areas, West Bengal, India.
D Smith (1973). Cohen, Dorothy,<i>Advertising</i>. New York: John Wiley & Sons. Inc., 1972.
R Tama,L Yng,F Happy,M Hoque (2018). An empirical study on socio-economic status of women labor in rice husking mill of Bangladesh.
S Hulley,S Cummings,W Browner,D Grady,T Newman (2013). Designing clinical research: an epidemiologic approach.
Corey Keyes (1998). Social Well-Being.
M Khan (2022). The Bangla translation of the Social Well-being Scale.
A Siddque (2007). Impact of Rice Mill on Human Health and Environment at Some Selected District of Bangladesh.
R Weech-Maldonado,M Miller,J Lord (2017). The Relationships among Socio-Demographics, Perceived Health, and Happiness.
Sayed Taghavi,Hamidreza Mokarami,Morteza Nazifi,Alireza Choobineh,Hossein Marioryad,Mehdi Kujerdi (2014). The Influence of Socio-Demographic, Health and Work-Related Factors on Health-Related Quality of Life among Iranian Industrial Workers.
Dr. Rahman (2024). Strategies of Subjective Well-Being: Experiences of Married Female Garment Workers in Bangladesh.
No ethics committee approval was required for this article type.
Data Availability
Not applicable for this article.
How to Cite This Article
Md. Arif Uddin Khan. 2026. \u201cThe Social Well-Being Status of Female Rice Mill Workers in Bangladesh: An Empirical Study\u201d. Unknown Journal GJHSS-C Volume 24 (GJHSS Volume 24 Issue C6): .
Explore published articles in an immersive Augmented Reality environment. Our platform converts research papers into interactive 3D books, allowing readers to view and interact with content using AR and VR compatible devices.
Your published article is automatically converted into a realistic 3D book. Flip through pages and read research papers in a more engaging and interactive format.
Rice mill workers can be considered as the lifeline to maintain the country’s food security. More than half of them were female. However, a few studies focused on socioeconomic conditions and well-being of rice mill workers. The present study aimed to assess the social well-being of female rice mill workers in Bangladesh and socio-economic factors affecting it. The data were collected from a sample of 398 female rice mill workers (age mean = 31.82 years, SD = 8.39 years) who were selected through mixed sampling method. The data were collected using face-to-face interview with a structured questionnaire. The questionnaire included questions about personal information, education, income, living environment, health, violence, belongingness, equality, working environment, and social well-being. Results showed that there was a lower household income, a lower standard of living environment, lack of health and recreational facilities, unhealthy working environment, and a lower social well-being of female rice mill workers.
Our website is actively being updated, and changes may occur frequently. Please clear your browser cache if needed. For feedback or error reporting, please email [email protected]
Thank you for connecting with us. We will respond to you shortly.