Day by day, the number of confirmed Covid-19 cases significantly increases all over the world. In India, the second wave of coronavirus has come back and created a disastrous impact. On April 3rd, India continuously recorded the highest number of daily cases globally, according to Financial Times, there was a scarcity of crematoriums and burial grounds due to the high number of corpses. The outbreak of death cases was an unprecedented circumstance, hence, there was a shortage of medical necessities. Prediction of death cases could help the government to manage the medical facilities such as beds and oxygen supply for the hospital. Machine learning could be used to analyze and predict fatality cases. PySpark library is used to process raw data and update new data each day, as the library allows the processing of a large amount of raw data efficiently. By using the Naïve Bayes algorithm available in PySpark, the prediction accuracy has increased to 81.3%.
## I. INTRODUCTION
The world has spent to the heart-reading day when fatalities passed 4 million people while the crisis becoming the race between vaccinating and new dangerous variants. Prediction is another way to control the Covid-19 situation and propose a new method to face the new stage of devastation coronavirus [18{21} In paper [1], they used linear regression and polynomial regression to predict the results of fatalities. These two algorithms were applied to find the best fit line to estimate the average values of the two variables. These algorithms are dependent on the variation and dispersion of the data. The best fit line will divide the data into two parts with the same distance between the values of data from the best fit line. They also used root mean square error to estimate the accuracy of prediction. Root mean square error is a kind of metric to calculate the error when analyzing the data using regression algorithms. Root mean the square error will be calculated as the mean of the values and ensure the distances are the same as the points. The root means square error measures the variation and the concentration of the values around the mean. Many kinds of data could be expressed in Fig 1, the exactness belongs to the distribution of data.
In paper [2], they predicted the outbreak of Covid-19 in Ethiopia by comparing the Support Vector Machine (SVM) model and the Polynomial Regression (PR) model in the ScikitLearn library. The paper showed that SVM gets better performance than PR banked on evaluating graph performance and metric Mean Square Error (MSE), Mean Absolute Error (MAE) [3{7, 9]. With the same evaluation in paper [1], the results were also depending on the distribution of the data and this evaluation is just counted on the mean of the values that if the data is dense on the prediction, the mean of the values will be closed to the mean of prediction. This calculation usually makes the approximate values instead of exact values.
Table 1: Random Correlation Example for Data
<table><tr><td></td><td>Total_cases</td><td>new_cases</td><td>new Cases_smothed</td><td>total_deathse</td><td>new_deathse</td><td>new_deaths</td></tr><tr><td>Totalcases</td><td>1.000000</td><td>0.862925</td><td>0.879309</td><td>0.984957</td><td>0.845896</td><td>0.871108</td></tr><tr><td>newcases</td><td>0.862925</td><td>1.000000</td><td>0.989568</td><td>0.864804</td><td>0.928043</td><td>0.922668</td></tr><tr><td>_cases_smoothe</td><td>0.879309</td><td>0.989568</td><td>1.000000</td><td>0.879013</td><td>0.921921</td><td>0.937985</td></tr><tr><td>total_deaths</td><td>0.984957</td><td>0.864804</td><td>0.879013</td><td>1.000000</td><td>0.872722</td><td>0.898039</td></tr><tr><td>new_deaths</td><td>0.845896</td><td>0.928043</td><td>0.921921</td><td>0.872722</td><td>1.000000</td><td>0.976566</td></tr><tr><td>new_deaths_smoothe</td><td>0.871108</td><td>0.922668</td><td>0.937985</td><td>0.898039</td><td>0.976566</td><td>1.000000</td></tr></table>
In this paper, we considered the unformed data with the information in Fig 1. We calculated the correlation between the attributes of data and applied an accuracy metric to evaluate the exact values. We proposed the algorithms could solve with discrete and unformed data by calculating the correlation shown in Table 1. We defined very strong positive correlation when values are greater than or equal to 0.8, strong positive correlation when values are greater than or equal to 0.6 and smaller than 0.8, weak positive correlation when values are greater than or equal to 0.4, and smaller than 0.6. We omitted no correlation (values are in the interval of -0.4 to 0.4), weak negative correlation (Values are
smaller than or equal to -0.4 and greater than -0.6), strong negative correlation (Values are greater than -0.8 to values smaller than or equal to -0.6) and very strong negative correlation (Values are smaller or equal to -0.8). We tried models and chose the metric accuracy to calculate the true prediction and the percentage of the prediction. With this metric, we could evaluate exactly the number of predictions and depicted the records related to prediction. PySpark is one of the branches of Hadoop structure becoming strongly and easily in analyzing the data. With the powerful libraries, PySpark supplies the structure for direct and indirect processing, graph environment with ease of use, short time analyzing the big data. PySpark sponsors many sections with many kinds of functions such as Spark SQL, DataFrame, Streaming, MLlib, and Spark Core. PySpark could solve with big data and costs less time to analyze the classification problems. Table 2 shows details of the sections and functions in the PySpark library. The steps for analyzing data could not follow the sections but could form the data before applying the sections and functions (Fig 1). The data will be extracted feature and applied to the model to transform to right form data by choosing basic statistics. After that, we could confirm and make the kinds of problems such as classification, regression, or clustering problems. Finally, we applied evaluation metrics to estimate the models (Equations 1-4).
$$
A c c u r a c y = \frac {\sum_ {i = 1} ^ {n} T _ {i V}}{\sum_ {i = 1} ^ {n} T _ {i V} + \sum_ {j = 1} ^ {m} F _ {j V}} \tag {1}
$$
Where n; m are numbers of classes, TiV is a true value of prediction at class i; FjV is a false value of label at class j.
$$
P r e c i s i o n = \frac {\sum_ {i = 1} ^ {n} T _ {i P}}{\sum_ {i = 1} ^ {n} T _ {i P} + \sum_ {j = 1} ^ {m} F _ {j P}} \tag {2}
$$
Where $T_{iP}$ is the true positive at class $i$ and $F_{iP}$ is false positive at class $i$. $F_{jN}$ is false negative at class $j$.
$$
\text{Recall} = \frac{\sum_ {i = 1} ^ {n} T _ {i P}}{\sum_ {i = 1} ^ {n} T _ {i P} + \sum_ {j = 1} ^ {m} F _ {j N}} \tag{3}
$$
$$
F _ {1} - S c o r e = 2 \times \frac{\text{Precision} \times \text{Recall}}{\text{Precision} + \text{Recall}} \tag{4}
$$
## II. LITERATURE REVIEW
Nowadays, machine learning is becoming an essential part of computer science. PySpark is a strong application for analyzing the data with open-source libraries where we can run R, Python, Java, and Scala. PySpark is free for users and easy to use. PySpark supports two strong libraries with Spark MLlib and Spark ML packages where they can solve big data and analyze it in a very short time [17]. However, the processing for analyzing data could follow as Fig 2 shown. We summarized the algorithms used in the PySpark library shown the detail in Table 2.
## III. EXPERIMENTS
In this paper, we got data downloaded on June 10th, 2022 from the website https://ourworldindata.org/covid-deaths and updated every day (Table 2). The data totally consists of 59 attributes and we also chose the attribute with the
Table 2: Library support in PySpark
<table><tr><td>MLlib</td><td>Sections</td><td>Features</td></tr><tr><td rowspan="3">Data types</td><td>Local vector</td><td>The vector is formed by an integer or double or zero-based type. The data can be distributed densely or sparsely.</td></tr><tr><td>Labeled point</td><td>A kind of local vector using supervised machine learning algorithms with data is labeled. Labels sometimes are 0 and 1 or start from 0, 1,2,... The data can be established in dense or sparse distribution.</td></tr><tr><td>Distributed matrix</td><td>A kind of local matrix with long rows and columns. It is so difficult that we can't turn the matrix into another format matrix.</td></tr><tr><td rowspan="2">Basic Statistics</td><td>Summary Statistic</td><td>Giving the information of the instance consists of mean, max, min, variance, and nonzeros.</td></tr><tr><td>Correlations</td><td>Depend on the input data, the output could be formed double or matrix.</td></tr><tr><td rowspan="4">Classification and Regression</td><td>Linear Models</td><td>Replied to the input data, the output could be formed double or matrix.MLib supports the classification and regression algorithms. The classification consists of linear support vector and logistic regression. Regression consists of Lasso, and Ridge regression.</td></tr><tr><td>Decision Trees</td><td>Solving any kind of classification problems, this ease of use and handle complicated tasks.</td></tr><tr><td>Random Forest</td><td>Using the same model with Decision Trees, Random Forest uses the average of the values to improve the exact predictions but sometimes cost more time than Decision Trees</td></tr><tr><td>Naïve Bayes Isotonic regression</td><td>Very strongly applied in labeled data and solving classification problems efficiently. It can be usually applied in sparse vectors conveniently.</td></tr><tr><td rowspan="3">Feature</td><td>StringIndexer</td><td>To turn string attributes into label attributes. If the column is a string, we could change it to a string column and label the string column.</td></tr><tr><td>OneHotEncoder</td><td>Change a label column to binary column vectors</td></tr><tr><td>VectorAssembler</td><td>Combining all kinds of categorical columns to build a vector column for model prediction.</td></tr><tr><td rowspan="2">Evaluation metrics</td><td>Classification model evaluation</td><td>Applied for binary and multiclass classification, the output could show the confusion matrix, accuracy, precision, recall, and F1-measure.</td></tr><tr><td>Regression model evaluation</td><td>Applied for predicting continuous values with Mean Square Error, Root Mean Square Error, Mean Absolute Error, and Coefficient of Determinant.</td></tr></table>
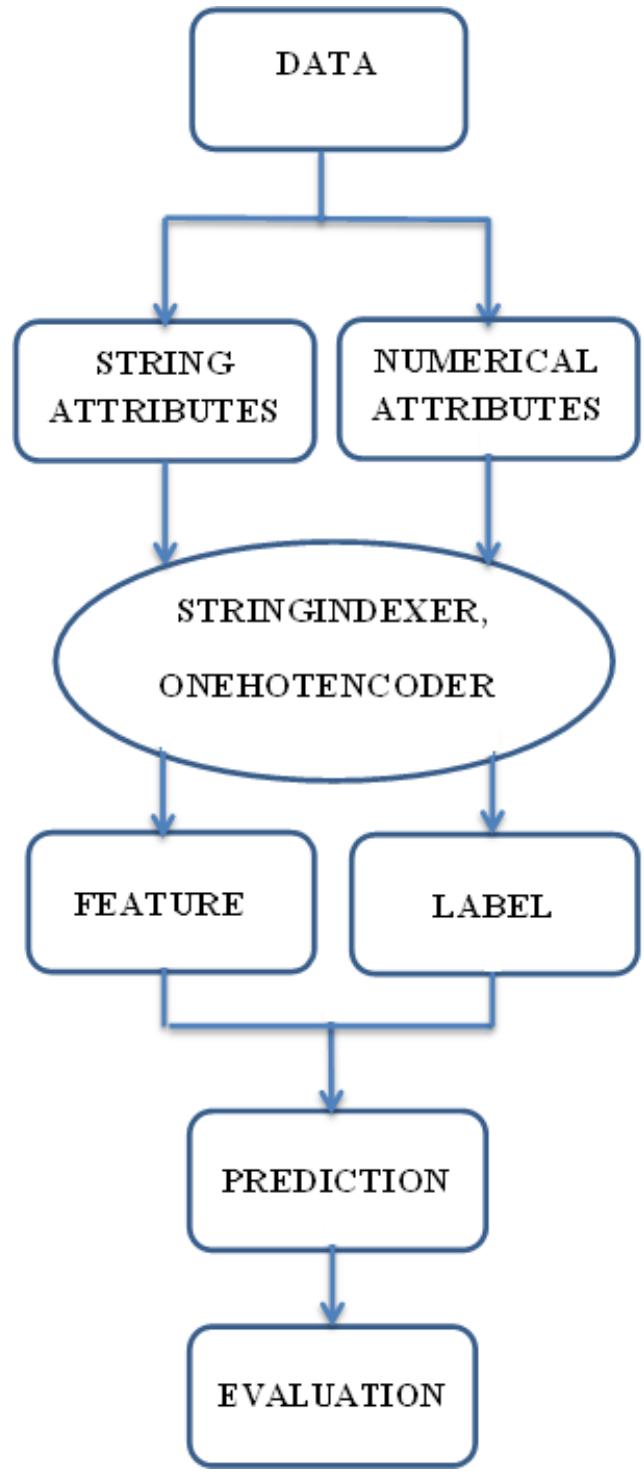 Fig. 1: Steps to Process Data
greatest correlation values in the set of very strong correlation values for building features combining location and total deaths is chosen as labels. The raw data chosen comprises about 208,111 instances and is cleaned by keeping specific character contributes.
As Fig 1 shown, we need to process the data in the right format by using PySpark libraries. The columns selected will be divided into two parts: One part for features and another for labels. We applied StringIndexer to change to the column labeled and applied OneHotEncoder to established binary vector and after that, we applied VectorAssembler to combine with total cases column to make column features for prediction. We also applied StringIndexer to turn total deaths into a label column for target prediction (see Table 2). Besides metrics accuracy to evaluate the ratio of right targets and total targets, we considered evaluating by Precision, Recall, and F1-score occupied great important units in the medical aspect. Precision is confirmed the rightly positive cases while Recall is to confirm rightly negative cases to decide the right method for curing. F1-score, calculated as the average
of Recall and Precision, is applied to confirm how much Recall is more important than Precision. In the medical branch, it is used to decide prior Recall or Precision to choose an appropriate patients' situation.
Compared to deep machine learning, we also analyze the data when trying with deep learning [8{13} such as LSTM, and GRU but get the worse results prediction shown such as the time costs too much time (5,435s/step), accuracy for the first step is 0.138 and the second step is 0.1384. The parameters for solving this data are a total of 202,878,594 parameters and the batch size is 1,318 parameters. PySpark has shown better performance with the best accuracy and least time to evaluate.
## IV. RESULTS
In this paper, we tried the models in PySpark and choose the models that could analyze the data. After trying the models in Spark.MLib and Spark.ML, we got the results in Table 3. The results showed that Naïve Bayes has the best performance in predicting fatalities with an accuracy of 0.813. Following that was the Decision Tree model with an accuracy is 0.621. Table 4 shows some example prediction results with the models. Fig 2-3 showed the screen of prediction using Naïve Bayes and Random Forest.
Table 3: Prediction Results for All Models
<table><tr><td>Models</td><td>Accuracy</td><td>Precision</td><td>Recall</td><td>F1-Score</td></tr><tr><td>Naïve Bayes</td><td>0.813</td><td>0.571</td><td>0.381</td><td>0.457</td></tr><tr><td>Random Forest</td><td>0.139</td><td>0.632</td><td>0.003</td><td>0.005</td></tr><tr><td>Decision Tree</td><td>0.621</td><td>0.824</td><td>0.013</td><td>0.026</td></tr></table>
Table 4: Example Results for Naïve Bayes Prediction
<table><tr><td>Label</td><td>Naïve Bayes</td><td>Random Forest</td><td>Decision Trees</td></tr><tr><td>8.0</td><td>5</td><td>4</td><td>3</td></tr><tr><td>20.0</td><td>32</td><td>3</td><td>16</td></tr><tr><td>23.0</td><td>16</td><td>1</td><td>8</td></tr><tr><td>38.0</td><td>28</td><td>31</td><td>12</td></tr><tr><td>43.0</td><td>46</td><td>3</td><td>41</td></tr></table>
## V. CONCLUSION
To aim with getting the best prediction for Covid-19 fatalities, we applied Spark.MLib and Spark.ml to get the best result in Naive Bayes model [14{16]. We also try with deep machine learning like LSTM, GRU but get no better answers. With this paper, we hope to have a good prediction in India and other countries getting the Covid-19 cases increasing every day. With this result, we hope we and other researchers could get more information to continue facing the Covid-19 tornado. This result is also the basic report supplied for the government in repairing the utilities for Covid-19 cases. This also proposes a way to solve big data in the new technology era with unformed data.
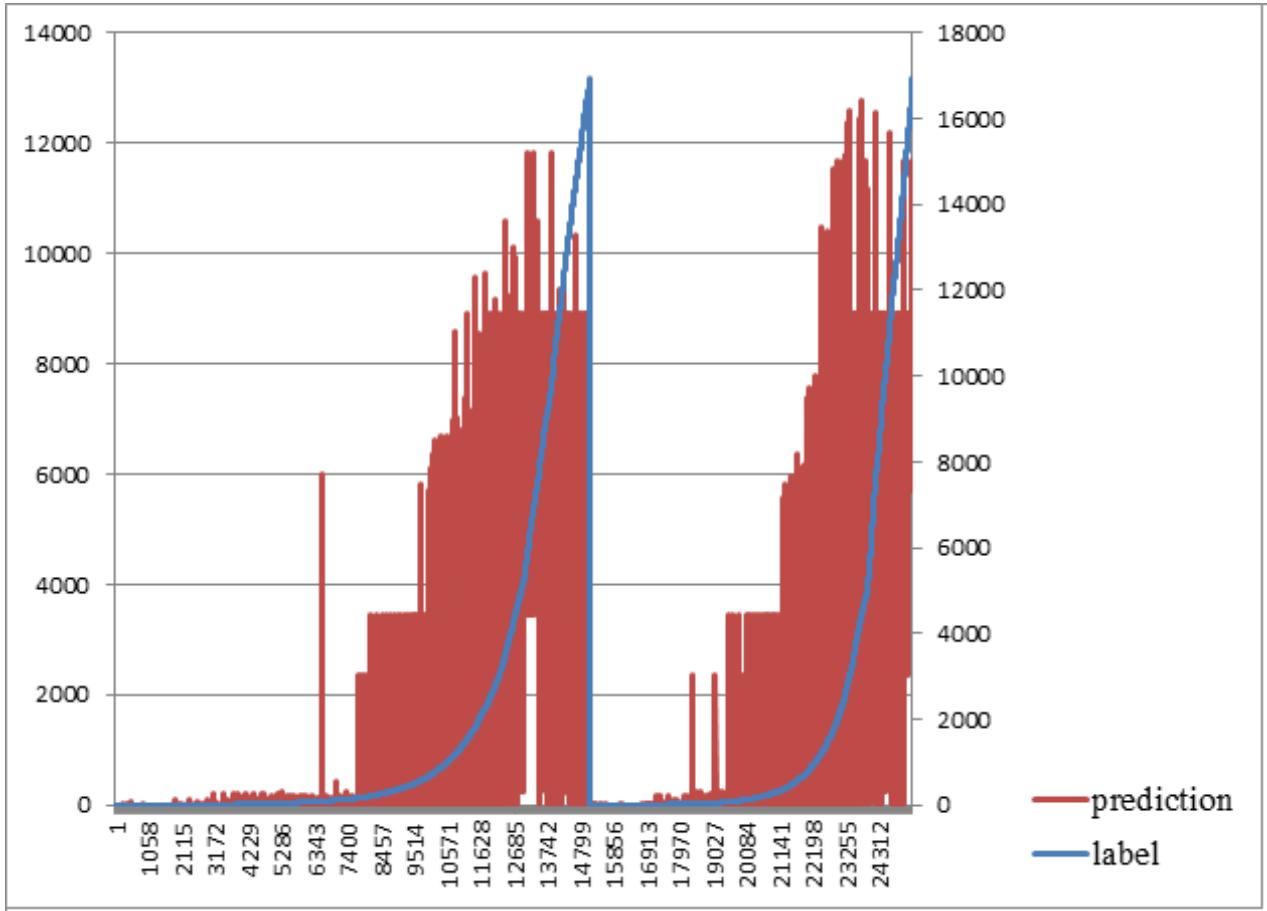
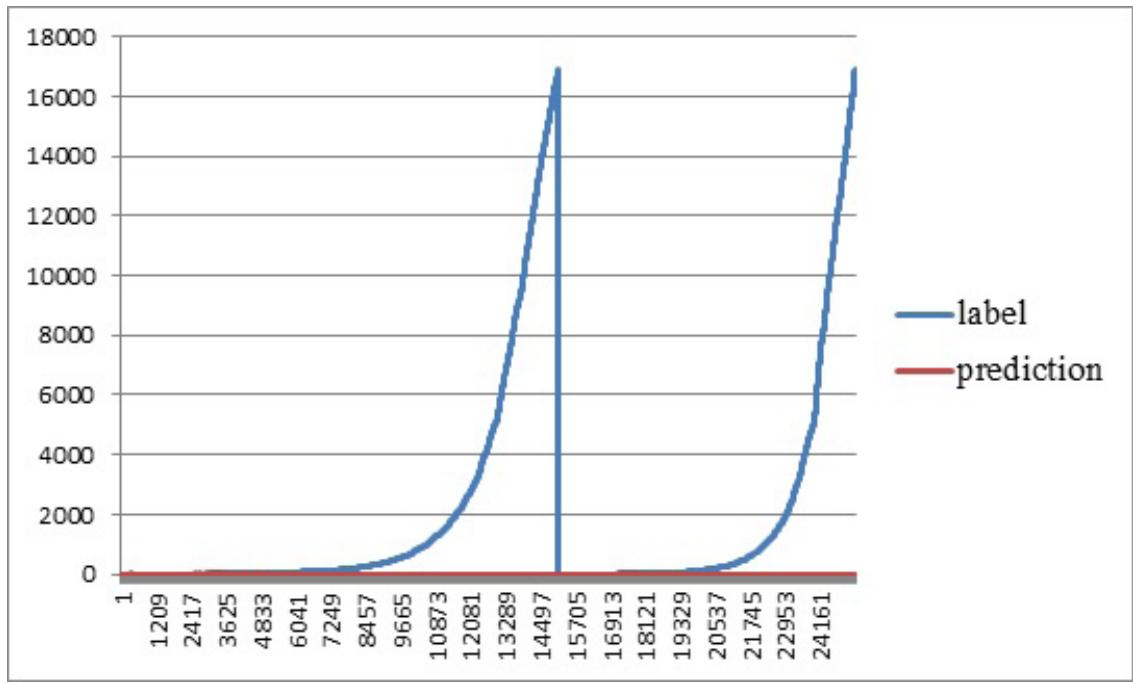 Fig. 2: A Prediction using Naïve Bayes Fig. 3: A Prediction using Random Forest
Generating HTML Viewer...
References
20 Cites in Article
Manpinder Singh,Saiba Dalmia (2020). Prediction of number of fatalities due to Covid-19 using Machine Learning.
Sirage Zeynu,Ahmed Analysis and forcasting the outbreak of Covid-19 in Ethiopia using machine learning.
Tamer Sh,Roseline Mazen,Ogundokun Oluwaseun,Joseph Bamidele,Awotunde (2020). A novel machine learning based model for COVID-19 prediction.
Sudhir Bhandari,Ajit Shaktawat,Amit Tak,Bhoopendra Patel,Jyotsna Shukla,Sanjay Singhal,Kapil Gupta,Jitendra Gupta,Shivankan Kakkar,Amitabh Dube (2020). Logistic regression analysis to predict mortality risk in COVID-19 patients from routine hematologic parameters.
Arjun Yadaw,Yan-Chak Li,Sonali Bose,Ravi Iyengar,Supinda Bunyavanich,Gaurav Pandey (2020). Clinical features of COVID-19 mortality: development and validation of a clinical prediction model.
Shreshth Tuli,Shikhar Tuli,Rakesh Tuli,Sukhpal Gill (2020). Predicting the Growth and Trend of COVID-19 Pandemic using Machine Learning and Cloud Computing.
Mohammad Behdad Jamshidi,Ali Lalbakhsh,Jakub Talla,Zden_Ek Peroutka,Farimah Hadjilooei,Pedram Lalbakhsh,Morteza Jamshidi,Luigi Spada,Mirhamed Mirmozafari,Mojgan Dehghani,Asal Sabet,Saeed Roshani,Sobhan Roshani,Nima Bayat-Makou,Bahare Mohamadzade,Zahra Malek,Alireza Jamshidi,Sarah Kiani,Hamed Hashemi-Dezaki,Wahab Mohyuddin (2020). Artificial Intelligence and COVID-19: Deep Learning Approaches for Diagnosis and Treatment.
Sina Ardabili,Amir Mosavi,Pedram Ghamisi,Filip Ferdinand,Annamaria Varkonyi-Koczy,Uwe Reuter,Timon Rabczuk,Peter Atkinson (2020). COVID-19 Outbreak Prediction with Machine Learning.
Mohammadreza Nemati,Jamal Ansary,Nazafarin Nemati (2020). Machine-Learning Approaches in COVID-19 Survival Analysis and Discharge-Time Likelihood Prediction Using Clinical Data.
Afm Batista,J Miraglia,Thr Donato,Chiavegatto Filho,Adp (2020). COVID-19 diagnosis prediction in emergency care patients: a machine learning approach.
Hongwei Zhao,Naveed Merchant,Alyssa Mcnulty,Tiffany Radcliff,Murray Cote,Rebecca Fischer,Huiyan Sang,Marcia Ory (2021). COVID-19: Short term prediction model using daily incidence data.
Rajan Gupta,Gaurav Pandey,Poonam Chaudhary,Saibal Pal (2020). Machine Learning Models for Government to Predict COVID-19 Outbreak.
Anthony Kelly,Marc Johnson,Anthony (2021). Investigating the Statistical Assumptions of Naïve Bayes Classifiers.
B S; Sharmila,Rohini Nagapadma (2019). Intrusion Detection System using Naive Bayes algorithm.
B S Sharmila,Rohini Nagapadma (2019). Intrusion Detection System using Naive Bayes algorithm.
Tuan Nguyen,M Meesad,P,Nguyen Ha,H (2021). English-Vietnamese Machine Translation Using Deep Learning, Recent Advances in Information and Communication Technology.
Maleerat Maliyaem,Nguyen Minh Tuan,Demontray Lockhart,Supattra Muenthong (2022). A Study of Using Machine Learning in Predicting COVID-19 Cases.
Tuan Nguyen,M,Phayung Meesad (2021). A Study of Predicting the Sincerity of a Question Asked Using Machine Learning.
Tuan Nguyen,M (2022). Machine Learning Performance on Predicting Banking Term Deposit.
Mohamad Siti Nurhidayahsharin,Khairilradzali,Shirwan Muhamad,Abdullah-Sani (2022). A network analysis and support vector regression approaches for visualizing and predicting the COVID-19 outbreak in Malaysia.
Explore published articles in an immersive Augmented Reality environment. Our platform converts research papers into interactive 3D books, allowing readers to view and interact with content using AR and VR compatible devices.
Your published article is automatically converted into a realistic 3D book. Flip through pages and read research papers in a more engaging and interactive format.
Our website is actively being updated, and changes may occur frequently. Please clear your browser cache if needed. For feedback or error reporting, please email [email protected]
Thank you for connecting with us. We will respond to you shortly.