Businesses are increasingly challenged by increasing competition, changing customer preferences and, industry dynamics. Moreover, the proliferation of channels and customer touchpoints has added to the complexity of keeping up with these constant changes. Only organizations that are agile enough to understand, evaluate and react to these dynamic requirements can drive innovation and growth. Therefore, organizations must be creative in their consumer engagement strategy across the marketing funnel to enhance overall customer experience, measure the performance, and establish the loopback to refine the strategy. The following paper outlines concepts to help consumer businesses accelerate customer experience management. The objective of the paper is to lay out guiding principles that organizations can use as part of their business processes to create, deliver, and measure personalized customer experiences and drive growth, loyalty, and satisfaction. The paper will dive into the three most important pillars of building successful customer experiences -Design a Customer Experience Management Model, Activate across touchpoints, and Measure performance across touchpoints.
## I. INTRODUCTION
Moreover, research by Amplify shows that $49\%$ of consumers have left a brand in the past year due to poor customer experience, and $86\%$ would leave a brand after as few as two poor experiences. As a result, there is immense pressure on organizations to deliver engaging customer experiences and emphasizes the importance of delivering excellent customer experiences.
### Three critical components of a holistic customer experience management process

Design customer experience management model
- Define top-line growth objective
- Align on metrics linked to the objective
- Prioritize key customer journeys to drive the desired outcome

Activate the model across touchpoints
- Gather cross-journey insights & create target segments
- Streamline content creation tied to channels, devices and segments
- Automate content assembly and delivery across channels

Measure model performance across touchpoints
- Design executive-level and journey-based reports and dashboards
- Democratize data and insights across organization
- Create a feedback loop from measurement back to strategy & planning
Figure 1: Overview of Customer Experience Management Model
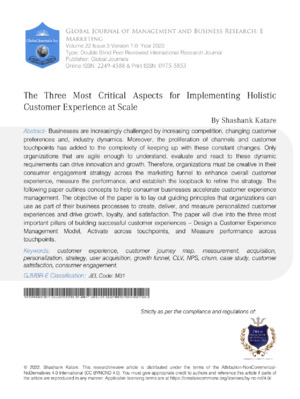
Customer experience management is a tricky thing to accomplish as it requires investment in technology, resources, and processes. But brands who undergo this journey have seen tremendous benefits in terms of revenue, customer retention, and employee satisfaction. Investment in these capabilities increases their digital maturity, make the brands more customer centric and elevate the customer experience from batch and blast to an individual level.
 Customer experience maturity from batch and blast to individual-specific targeting Figure 2: Customer Experience Maturity Model
## II. THREE KEY CUSTOMER EXPERIENCE MANAGEMENT PILLARS
### a) Design Customer Experience Management Model
Customer experience is increasingly becoming a pivotal vector to differentiate against the competition. Gone are the days when price or product was enough to win customers. In today's dynamic market, it is crucial for companies to develop and nurture relationships with their customers. As a result, customer experience (CX) strategy has been the focus of businesses. A customer experience strategy defines an approach to elevate customer experience to meet business objectives. Defining, planning, and executing a good customer strategy requires brands to understand customer needs, behaviors, and preferences, generate insights, and deliver exceptional experiences to meet those expectations.
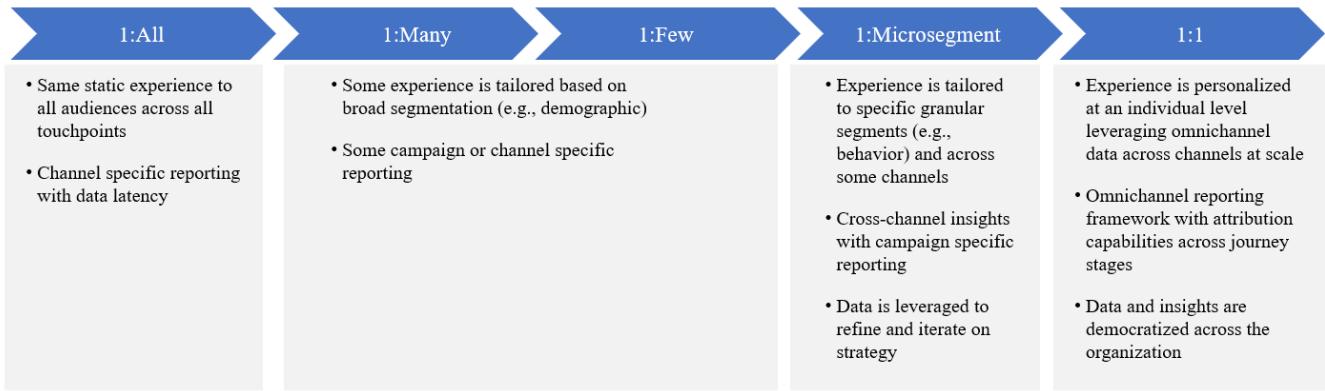
Marketers should not design customer experience in silo, but should consider every interaction across channel, device, and touchpoints. Therefore, the customer experience management should design must include with every interaction throughout the journey funnel: Attract, Engage, Convert, Retain, and Nurture.
- Attract - How are customers becoming aware of the business and its products or services?
- Engage - How are customers engaging and evaluating multiple offerings that would cater to their needs?
- Convert - How many customers are taking the action tied to business objective? (e.g., sign-ups, app installs, purchase, etc.)
- Retain - How many return customers does the business get? How many customers churn?
- Advocate - How many customers are advocating for the business to other people?[^50]
The customer buying process has evolved significantly over a period. It is non-linear, involves multiple touchpoints (online and offline), and has become extremely complex. Customers interact with the brand across multiple touchpoints, channels, and devices throughout the journey stages. In fact, due to the proliferation of digital channels and touchpoints, a typical customer gets exposed to a brand or product across multiple points in the buying lifecycle. Therefore, it has become imperative for brands to engage and nurture customers seamlessly across touchpoints.
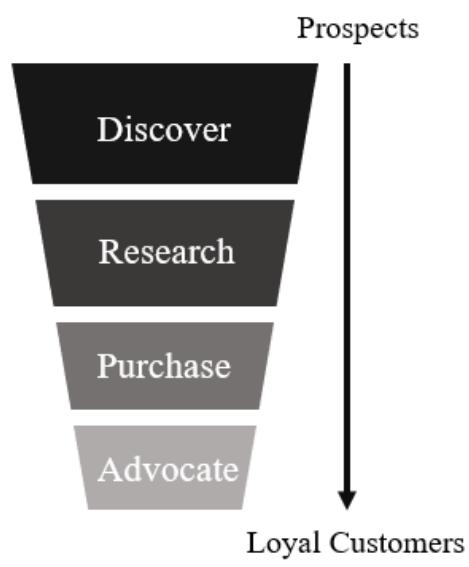 Linear Customer Journey
 Non-Linear Customer Journey Figure 3: Comparison of Linear/Traditional Customer Journey to a Non-Linear Customer Journey
Customers are taking over control of their buying journey and expect brands to meet their needs and preferences. Brands must be prepared to meet customers where they are, provide the next-best offer and next-best action, and deliver a personalized experience that is unique to an individual. Consumers expect the companies they interact with to know them and anticipate their needs. Meeting these expectations can be challenging because it requires combining data from multiple solutions within their tech stacks to get a clear picture of an individual customer and act on those real-time insights to deliver a truly connected experience.
Therefore, marketers should consider customer needs, preferences, and behavior across various journey stages while designing customer experience management model.
Customer Experience Management model must encompass various stages of the customer journey
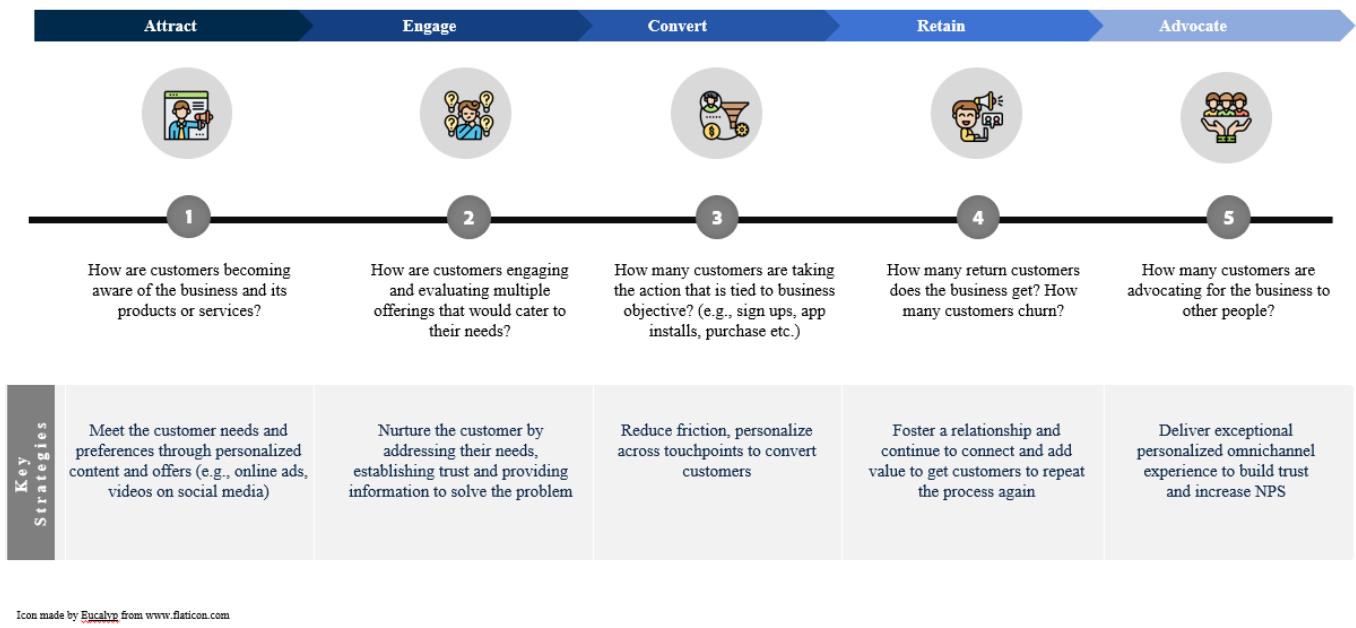 Figure 4: Key Questions and Strategies to Consider while Creating a Customer Experience Strategy
### b) Activate Customer Experience Across Touchpoints at Scale
A customer interacts with the brand or products across various touchpoints. The interactions can be a result of marketing campaigns or through word of mouth and is not the same for each customer. Some customers learn about the brand through paid media channels, e.g., social media, while others might learn about it through organic search or see a store on their way to work. Therefore, it is critical that different cross-functional teams collaborate to provide the best experience a customer can have across these touchpoints.
Activating customer experience across touchpoints at scale is providing consistent and seamless experience to your customers across different touchpoints. It involves understanding customer personas and journeys and leveraging data and real-time insights to tailor experiences at an individual level. It also requires organizations to democratize data and, align KPIs across different teams, and take a customer centric approach to provide the best possible experience to the customer based on their needs, preferences, and behaviors. Customer Journey Orchestration is the next level of optimization and personalization strategies, and tactics companies usually deploy. It is all about leveraging data across the journey touchpoints, channels, and sources to personalize every moment in the entire experience across the journey funnel.
This is a challenging task to accomplish since it involves organizational shift in mindset, adopting agile ways of working, and pushing the boundaries to achieve a unified goal. A lot of time, companies have siloed systems and functions that inhibit activating consistent and seamless experiences across touchpoints, channels, and devices. For example, marketing, channels, customer experience, testing and personalization teams have different objectives, measure different KPIs, and use data from disparate systems. Moreover, these teams sometimes fall under different orgs and departments (e.g., CMO, CDO) leading to different objectives. As a result, the customer experience is disjointed, leading to low customer satisfaction.
#### Holistic omnichannel orchestration
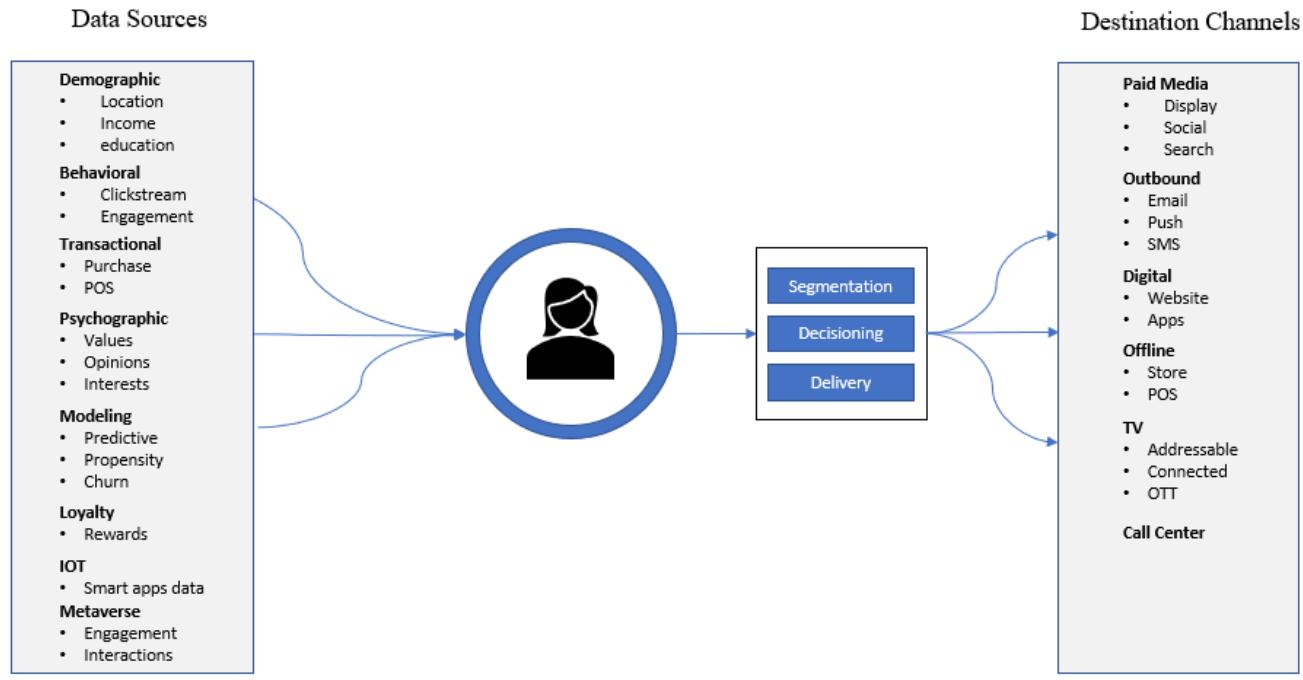 Figure 5: Overview of Campaign Orchestration with Key Components Required
Case Study: Let us look at a case study to understand how a mortgage provider improved customer experience using journey orchestration.
- Challenge: A leading mortgage provider noticed increased mortgage journey costs while a low self-service percentage.
- Solution: the CX team analyzed the journeys and identified issues within the refinancing journey. They noticed that first call resolution (CFR) had fallen from $65\%$ to $30\%$, and call volume had increased significantly. Root cause analysis indicated that most of the calls were while someone was uploading documents using the iOS mobile app. The CX team worked with IT to fix the app and with marketing to create audiences of segments who are facing the issue and are in the refinance journey to send automated notifications with a workaround and update on the resolution.
- Impact: As a result, the company increased the mobile refinancing journey completion rate and reduced the call center volume.
c) Measure Customer Experience Effectiveness Across Touchpoints
Organizations have understood that customer experience is essential in engaging customers and driving loyalty. However, research has shown a direct correlation between customer experience and business growth. As organizations focus on improving customer experience and move on the maturity curve, they will start seeing revenue growth and a significant improvement on other metrics.
Typically, organizations look at increasing revenue as they advance (go further to the right) on the customer experience maturity. As a result, measuring the performance is extremely critical because:
- Companies usually start small, and realizing value keeps the team motivated
- Measuring success helps with the business case and getting buy-in or securing budget
- Drives adoption across the organization
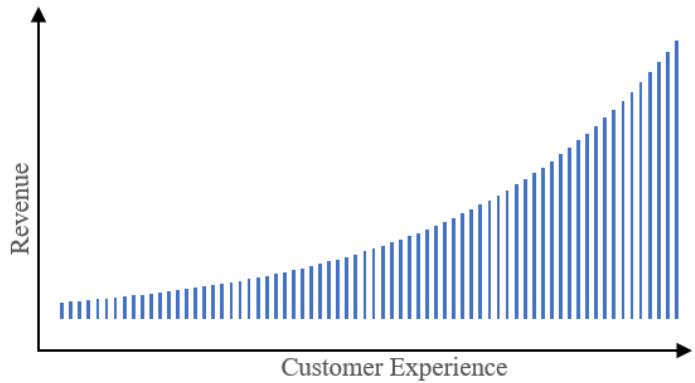 Figure 6: Customer Experience vs Revenue
Exceptional customer experience performance measurement systems and processes are rooted in key metrics that help with not only understanding the overall impact on revenue but also with evaluating other areas, such as customer satisfaction and campaign performance across journey touchpoints.
Although there are a lot of metrics that you can track to evaluate performance, there are seven key metrics that organizations can start with to measure customer experience. Usually, brands will use these in conjunction to measure insights from different points of journey touchpoints and have a holistic view of the overall customer experience.
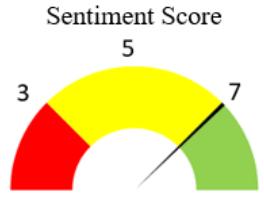
#### 1. Net Promoter Score (NPS)
This is one of the most widely accepted metrics to measure the success of campaigns. Most brands will use NPS to understand and measure customers' overall perception of the products and brand.
Methodology: The NPS is calculated by gathering direct inputs from customers, such as a survey.
Question: The key question to ask is:
"How likely are you to recommend the product/service/brand to friend or colleague?"
The customer is asked to score on a scale from 0-10, where $0 =$ "Unlikely" and $10 =$ "Definitely".
Analysis: The customers are then divided into three groups based on their response:
- Promoters (9-10): these are primarily loyal customers who are passionate and enthusiastic about the product/service/brand and will continue to promote the company. They will continue to shop with the company and will share their experiences with others and encourage them to do the same.
- Passive or Neutral (7-8): These are tricky customers. They are mostly satisfied but are not passionate or enthusiastic about spreading the good word about the product/service/brand. These customers won't talk negatively about the company but can be motivated to shop with competitive brands depending on offer, product, or experience.
- Detractors/Critics (0-6): These are unsatisfied customers and may be vocal about sharing negative experiences. These can harm the brand and can impede growth through their negative opinions.
Calculation: To calculate the NPS, we will subtract the percentage of Detractors/Critics from the percentage of promoters. We don't consider Passives/Neutral in the formula.
NPS can be calculated as% Promoters -% Detractors as shown below
$$
\text{NetPromoterScore} = \left[ \frac{\text{NumberofPromoters - NumberofDetractors}}{\text{NumberofSurveyRespondents}} \right] \times 1 0 0
$$
Example: To put this in context, let's take an example where a company surveyed 100 customers and received below responses:
After taking percentages, we get, $50\%$ are Promoters, $20\%$ are Passives and $30\%$ are Detractors. Using the above formula, $\mathrm{NPS} = 50 - 30 = 20$.
NPS may vary from -100 (all Detractors) to 100 (all Promoters) and can change over time.
Although, there is not a defined set of guidelines for what is a good NPS score, here is a general approach to follow. It will differ based on the organization's goals and specific objectives.
- 70+: exceptional NPS
- 50 to 69: strong NPS with room to improve
- 49 or less: should be actively improved
- Below 0: needs immediate attention
#### 2. Customer Effort Score (CES)
This metric corresponds to the level of effort a customer must go through to solve their problem e.g., find a product, take an action on the site, or get a question answered. CES often indicates how much effort customers are putting into interacting with the brand, service, or product and has a significant impact on driving loyalty and satisfaction. In fact, Harvard research has shown that level of effort a customer puts into finding a solution to their problem is a better indicator of customer loyalty than delighting the customer. Reducing friction points can reduce customer service costs and attrition. Therefore, measuring the ease of a customer's experience can help improve customer service.
Methodology: Typically, this can be measured with a post-interaction survey to the customers asking about their recent experience. The response will be on a scale of low to high effort, and the calculation will be around average and score distribution.
Question: To get the score, the survey must have a question
"The company made it easy for me to find the answer to my problem"
The customers are asked to score from 1 to 5 or 1 to 7 depending on the objective. The company also can decide to set the score as 1 – strongly disagree and 5 or 7 – strongly agree.
Analysis: The responses can be collected in numerical value or emoticons. Based on the emoticons, the company can assign a numerical value and calculate the score.
Calculation: CES can be calculated with a simple formula
$$
C u s t o m e r E f f o r t S c o r e = \frac{\text{SumofCustomerEffortRatings}}{\text{Totalnumberofsurveyresponses}}
$$
Although there are multiple types of survey questions, a company can formulate, here are a few sample questions to ask in the survey:
- How fast were you able to find a solution to your problem? Here the company can decide the numerical scale to use.
- How much effort did you put in to find the solution to the problem? Here the company can assign a numerical number to the level of effort. e.g., a lower score for less effort and a higher score for more effort. Alternatively, the company can also use emoticons for low, medium, and high-level effort and assign values to each for calculation.
- How easy was it to take a specific action related to an event, e.g., adding to cart, finding a product, or signing up.
#### 3. Customer Satisfaction (CSAT)
This metric helps measure customer satisfaction with the product, service, or brand. It also indicates whether the customer will churn and steps to take to retain the customer. However, companies should not use CSAT alone to make churn and retention decisions. In fact, they should use the customer satisfaction data to understand at a more granular level which parts of the product or service customer is satisfied or unsatisfied with and can be improved. For example, a customer can help with indicating satisfaction with a particular product feature by opening a support ticket or returning a product for a particular reason that can be used by the business to optimize the experience.
Methodology: To calculate CSAT, a company can send a short survey with a targeted question to the customers after their interaction with the product, or service. The question is around asking the customers about their satisfaction on a scale of 1-10.
Question: To get the score, the survey must have a question
"How satisfied were you with your recent interaction with your company?"
Here the customers can score on a scale of 1-10 or from very dissatisfied to very satisfied or can be star ratings from 1-5.
Analysis: The responses collected can all be converted into a quantitative score no matter what method was used.
Calculation: CSAT can be calculated with a simple formula
$$
C u s t o m e r S a t i s f a c t i o n S c o r e (C S A T) = \frac {S u m o f S c o r e s}{T o t a l n u m b e r o f s u r v e y r e s p o n s e s}
$$
#### 4. Customer Lifetime Value (CLV)
This is a key metric to track as part of the overall customer experience management program. Companies can use CLV to measure the value of a customer over a period, not just based on purchase but on the overall relationship. CLV represents the net present value of the profit that a customer generates across the relationship with the business.
$$
C L V = \sum_ {k = 1} ^ {n} \frac {\left(C R _ {k} - C _ {k}\right) \times R ^ {k}}{(1 + d) ^ {k}} - A C
$$
- CR - customer revenue
- C - customer costs
- R - retention rate
- d - discount rate
- AC - Customer Acquisition Costs
#### 5. Customer Retention Rate (CRR)
This metric tells you how many customers stay with the company over a period of time. It is relevant and connected to the churn rate. Retention is helpful because you know when the customers are more likely to stop using or paying for the product or service. This can also be modeled and applied to different audience cohorts and used to create specific tactics for these cohorts.
The Customer Retention Rate can be calculated as follows:
$$
= \left[ \frac{\# \text{of customers at the end of the period} - \# \text{of customers acquired during the period}}{\# \text{of customers at the start of the period}} \right] \times 100
$$
#### 6. Customer Churn Rate (CCR)
Businesses usually spend a lot more on acquiring new customers than retaining them. Therefore, it is imperative for firms to keep an eye out on the churn rate. The lower the churn rate, the more loyal the customers are. Retention rate and churn rate go hand in hand since you can see where the retention rate is dropping off, which users are churning, and how can you retain them.
$$
= \left[ \frac{\text{Customer Churn Rate (CCR)}}{\text{# of customers at the start of the period} - \text{# of customers at the end during the period}} \right] \times 100
$$
#### 7. Repeat Customer Rate (RCR)
This is a metric that can be applied to most businesses, especially that are not SaaS. Usually, companies spend a lot of money on acquiring customers and spend a lot of time on making sure that they are driving repeat purchases. Therefore, repeat customer rate becomes important, especially because you do not want the customer to go to a competitor. More and more retailers are now introducing new tactics to keep the customers coming back returning to them, such as save and subscribe, auto-replenishment, etc. They are also encouraging users to sign up for the app since app users have higher clv than non-app users and the app has a better link to loyalty.
$$
\text{ReepatCustomerRate} (R C R) = \frac{\text{Numberofreturncustomers}}{\text{Totalnumberofcustomers}}
$$
### d) Reporting and Dashboards
Customer Experience Performance Dashboard
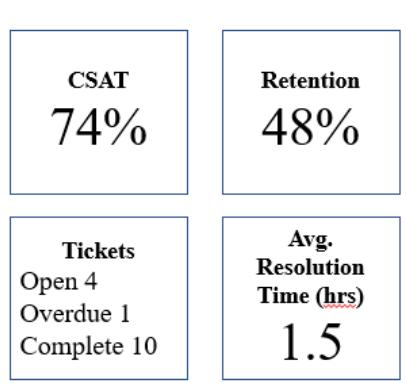
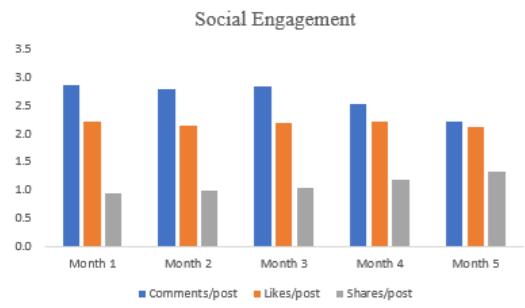
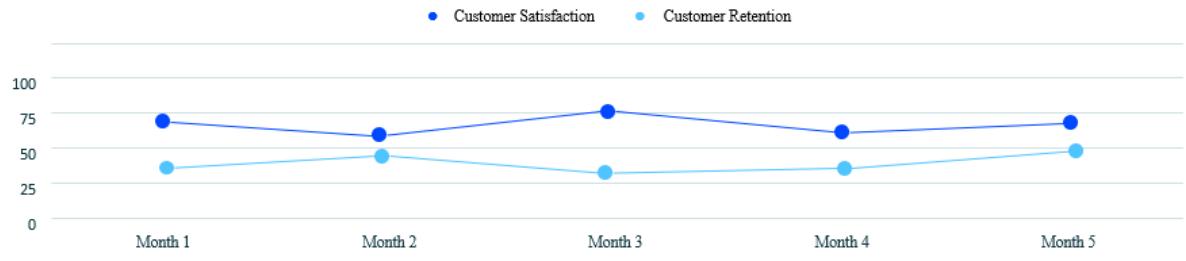 Performance over time (5 months) Figure 7: Example Reporting Dashboard Across Key Metrics
## III. FINDINGS AND DISCUSSION
### a) Case Study
Companies can leverage all the methodologies and frameworks to evaluate and elevate the customer experience. Let us look at real-life examples of how firms across different industries have adopted these techniques into their customer experience management program.
Case Study 1 Focused on Customer Lifetime Value
Challenge: a suburban bank was facing a challenge with effectively allocating budgets across the east and west coasts. They were spending marketing dollars evenly across the coasts but were not getting the best value for the spend.
Solution: the bank analyzed data and gathered insights that most of their customers belonged to two specific postal codes, one from the east and one from the west. Upon calculating the Customer Lifetime Value (CLV), they also found that customers on the east had $30\%$ of the customer base but were spending 4x that of customers on the west. This insight led to a change in the allocation of media spend effectively.
Impact: by updating the spend allocation, they got more value for the same spend.
Case Study 2 focused on Customer Churn
Challenge: US telecom operator could not accurately identify customers who are likely to churn for the company to be effective with targeting efforts.
Solution: The telecom company created a series of predictive algorithms based on customer behavior, and demographics to create churn prediction models.
Impact: As a result, the company not only increased accuracy of predicting customers who are about to churn but also was able to save over $60\%$ on acquisition costs through targeted marketing efforts.
Case Study 3 focused on Net Promoter Score
Challenge: Hotel Tonight did not have insights into a customer who had a terrible experience since such customers rarely take the time to write to the company.
Solution: The company decided to collect feedback from the customers using the NPS survey and used it to prioritize future feature enhancements. They also supplemented it with industry trends and other insights with the NPS survey to enhance the experience.
Impact: As a result, Hotel Tonight was able to overtime increase the NPS score to 75
### b) Benefits of Improving Customer Experience
Enhancing customer experience leads to business growth, customer retention, and loyalty. Below are a few key advantages of focusing on customer experience management and measurement:
- Increased customer acquisition: excellent customer experience leads to satisfied customers willing to recommend the brand to their friends and families. Therefore, companies are focusing on enhancing customer experience to build trust and encourage
customers to share the experience through word of mouth. This, coupled with media targeting, is an effective way to drive customer acquisition.
- Elevated engagement and increased conversions: improved experience drives better engagement rates and increased conversions. A happy customer is more likely to engage and buy from the brand than a prospect or a new customer. Therefore, it is important for the company to build long-lasting relationships and trust with the customers.
- Effective media spend: capturing data from customers leads to insights into what is working and what is not working. This helps the company to identify and reduce friction points and be more targeted with the media spend. As a result, the company can drive better results with the media spend and have a significant impact.
- Reduced cost of serving: overall better understanding of the customers leads to effective targeting, enhanced cross-sell and up sell opportunities that drive the overall cost down.
c) Key Considerations while Starting with Customer Experience Management
Customer experience is a key driver of value and growth for an organization. When getting started with customer experience management there are a few things to consider:
- Know your customers: Every business needs to gather data and insights to understand the needs and preferences of the customers. This is a critical step in developing the strategy keeping in mind what would resonate with your customers. Right data can help build right segments and targeting campaigns to deliver personalized experiences.
- Define objectives and KPIs: Extremely important to define goals relevant to the company, business model, and maturity and support with right KPIs and achievable and measurable targets.
- Outline customer journey map: Based on the understanding of the customer, define a customer journey map. This will include different touchpoints, strategies and experiences based on actions, needs and preferences.
- Define a roadmap of capabilities: analyze existing capabilities, identify gaps and supplement with new capabilities aligned to the objectives. Define a roadmap on how these capabilities will be rolled out to deliver the targeted experiences.
- Measure Impact: Capture feedback, and performance data to evaluate the impact of the tests and course correct if needed. Companies can learn and iterate as well as influence the strategy through ideating new tests.
## IV. CONCLUSION
The concepts around strategy, orchestration, and measurement of customer experience management can be applied to any organization irrespective of the business model, size, and maturity. Organizations can readily adopt the framework, and apply the different measurement strategies based on their objectives to evaluate performance across various stages of the customer experience funnel to drive business growth and profitability. The findings will be of tremendous value to marketers and practitioners looking to plan and implement a customer experience management program. They can use this as a guide and plan out their program from strategy to orchestration and measurement. The frameworks, practices, and methodologies highlighted will advance the knowledge and understanding of marketers on which measurement strategies to implement based on their strategy and objectives.
There are various ways to get started, but the companies can consider the points highlighted in this study to begin gradually, test and learn throughout the process and adopt and evolve as needed before driving adoption throughout the organization.
### a) Limitations and Scope for Future Research
This study consists of excellent theoretical and conceptual frameworks and techniques that organizations can adopt and implement. However, there is still scope for further research, addressing ideas not touched in this study.
The measurement techniques and key metrics are not comprehensive. Further study can highlight additional metrics, such as active users, free to paid subscribers, etc., that can be included in the customer experience management framework.
Further studies could also leverage additional data from organizations on how they have implemented these frameworks and outline detailed strategies and outcomes.
Finally, more research is needed to understand how different metrics, such as NPS, CSAT, CLV, Retention, etc., work in tandem and what is the effect of improvement in one or more metrics on overall customer experience management.
[^30]: respondents rated from 0 to 6. These are classified as Detractors. _(p.6)_
[^50]: respondents rated among 9 and 10. These are classified as Promoters. - • 20 respondents rated among 7 and 8. These are classified as Passives/Neutral. _(p.6)_
Generating HTML Viewer...
References
16 Cites in Article
P Assent (2022). Top 35+ customer experience statistics to know in.
S Offsey (2022). Chapter 18: Marketing Automation, Multichannel Personalization, and Journey Orchestration.
Adam Ramshaw Customer Experience Measurement: The Right CX Metrics to Use.
M Dixon,K Freeman,N Toman (2010). Unknown Title.
N Gautam (2017). A Practical Guide to Customer Experience Measurement.
Shashank Katare (2022). Agile Marketing as a Key Driver to Increasing Operational Efficiencies and Speed to Market.
M Osman (2016). Customer Experience and Revenue Growth.
Katie Lucero (2022). Net Promoter Score (NPS): What Does Net Promoter Score Offer in the Evaluation of Continuing Medical Education?.
What is customer effort score (CES) & how do I measure it?.
M Lerner (2022). 10 Best Customer Experience Metrics (According to the Experts).
A Birkett (2021). What is Customer Effort Score (CES)?.
O Staubli (2016). Predictive Customer Lifetime Value.
Bala Krishnan (2021). Churn Analysis: How to Retain Customers.
No ethics committee approval was required for this article type.
Data Availability
Not applicable for this article.
How to Cite This Article
Shashank Katare. 2026. \u201cThe Three Most Critical Aspects for Implementing Holistic Customer Experience at Scale\u201d. Global Journal of Management and Business Research - E: Marketing GJMBR-E Volume 22 (GJMBR Volume 22 Issue E3).
Explore published articles in an immersive Augmented Reality environment. Our platform converts research papers into interactive 3D books, allowing readers to view and interact with content using AR and VR compatible devices.
Your published article is automatically converted into a realistic 3D book. Flip through pages and read research papers in a more engaging and interactive format.
Our website is actively being updated, and changes may occur frequently. Please clear your browser cache if needed. For feedback or error reporting, please email [email protected]
Thank you for connecting with us. We will respond to you shortly.