This interdisciplinary quantitative study examines the influence of visits to Civil War shelters in Alicante on the perception of memory-based cultural heritage within an urban context. Through the analysis of 407 visitors from August 2023 to January 2024, it investigates how the rehabilitation and opening of these spaces contribute to sustainable urban development and historical understanding. Preliminary results show an increase in interest and awareness of the historical importance of the shelters, indicating a positive impact on the valuation of memory heritage. The study highlights the correlation between the provision of cultural and educational activities and the increase in visitors, underscoring the need for differentiated communication and management strategies to attract diverse visitor profiles. This analysis provides key insights for the management of cultural heritage and suggests improved approaches for the promotion of historical legacy.
## I. INTRODUCTION
This study explores the impact of visits to Civil War shelters in Alicante, Spain, and their influence on the legacy of cultural memory heritage in the city (Rosser & Soler, 2024; Rosser, 2023). The research is part of a broader discussion on the role that historical sites play as effective means to educate, reflect upon, and preserve collective memory (Atabay et al., 2022; Laderman, 2009; Wöhs et al., 2018), framed under the Operational Programme FEDER "Sustainable Growth 2014-2020," to highlight the importance of merging the recovery of historical and cultural heritages with the progress of sustainable cities.
Through restoration and public opening, the shelters provide a direct link to the tumultuous past of the Civil War in Spain, facilitating direct contact with visitors' experiences of the time. Beyond preserving these sites, the aim is to promote a greater understanding of history and its repercussions on today's society, under the approach of mnemohistory (Tamm, 2013, 2015; Wagner-Pacifici, 2010).
The purpose of this research is to determine how visits to these shelters impact the perception and appreciation of cultural memory heritage. It will analyze who the visitors are, what motivates them to visit, and how these visits contribute to both historical education and the recognition of cultural heritage, identifying trends in visits that may optimize the management of these historical sites (Cheng et al., 2016; Gounden et al., 2020; Rodgers et al., 2023).
The hypotheses suggest a positive effect of the rehabilitation and opening of the shelters on the heritage of cultural memory, attracting a diversity of visitors and deepening the understanding of the Spanish Civil War. The findings are expected to contribute to the management of cultural memory heritage and promote effective methods of communication and education (Toji, 2023).
Incorporating previous references, the study positions itself at the confluence of cultural heritage management, historical pedagogy, and cultural tourism (Boyd & Timothy, 2002; McKercher & Du Cros, 2012; Nesbitt, 2013; Richards, 2013). Through the review of similar research and the implementation of verified methodologies, a new perspective on the value of the Civil War shelters in Alicante as tools for historical remembrance and advancement toward sustainable urban development is proposed.
### a) Research Objectives
This study focuses on evaluating the impact of visits to Civil War shelters in Alicante on the preservation and understanding of memory heritage within an urban context. It seeks to determine how the restoration and opening of these spaces enhance the appreciation and understanding of the historical past in contemporary society. The objectives include analyzing the profile of the visitors, investigating patterns of visits, assessing prior knowledge and motivations, and forecasting future trends to improve the management and promotion of these sites. It also examines the effectiveness of different visit formats in conveying historical memory.
### b) Research Hypotheses
This study posits that the restoration and public opening of Civil War shelters in Alicante significantly enhance the local cultural memory heritage, increasing citizen interest and understanding of the commemorated historical events. A direct correlation is suggested between the variety of cultural and educational activities offered and the increase in visitors, which in turn, enriches the appreciation of the historical legacy. Furthermore, it is anticipated that the demographic characteristics of the visitors vary, requiring tailored management and communication strategies. To validate these hypotheses, a statistical analysis of data collected between August 2023 and January 2024 will be employed, utilizing a quantitative approach.
## II. METHODOLOGY
This quantitative study explores the impact on the cultural memory heritage of Alicante following the restoration and public opening of six Civil War air-raid shelters. The research is framed within the DUSI Strategy Alicante "Área Las Cigareras," part of the Operational Programme FEDER "Sustainable Growth 2014-2020," promoted by the City Council of Alicante with support from the European Commission. This project aims to foster sustainable urban development and the valorization of the city's industrial, religious, and military heritage, integrating restored shelters as vital elements of its historical and tourist legacy.
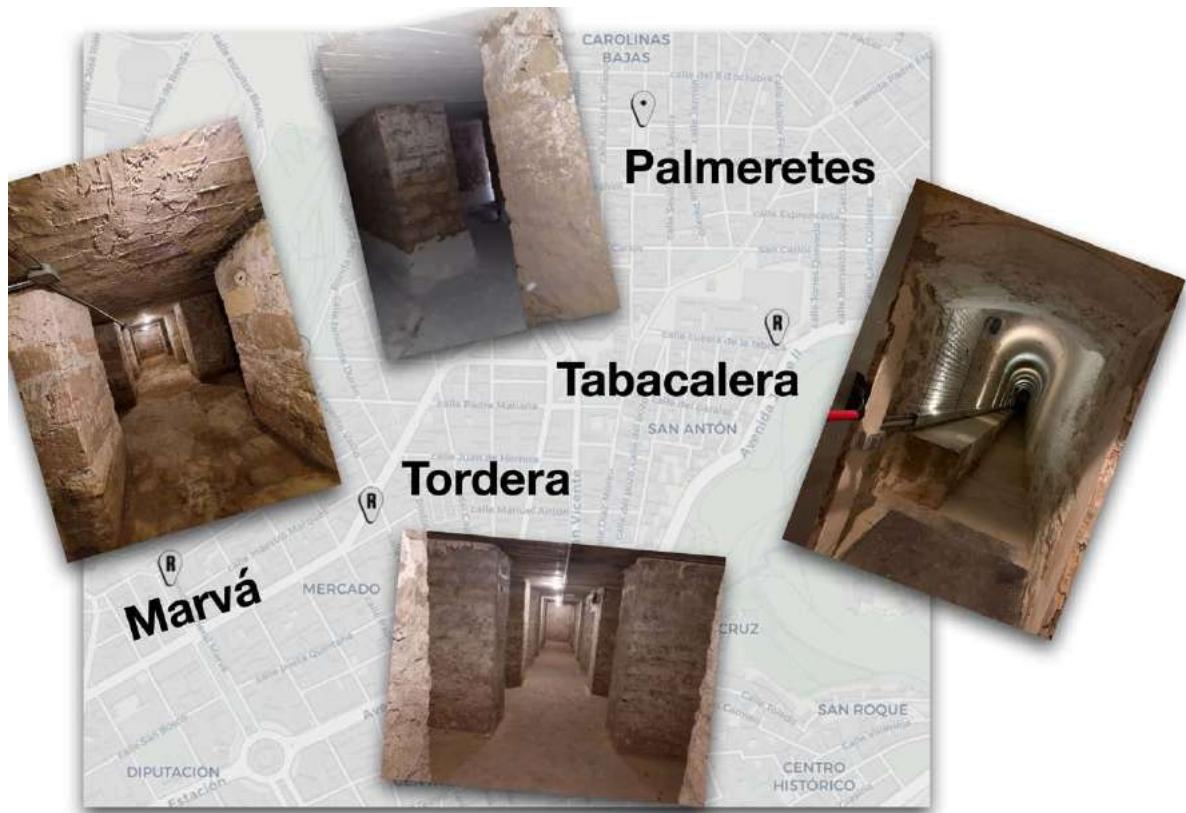 Figure 1: DUSI area of the city of Alicante with the Civil War air-raid shelters that have been restored in the project.
This longitudinal quantitative analysis focuses on evaluating the impact and profile of visitors to Civil War air-raid shelters in Alicante, reopened to the public with activities such as guided tours and cultural events. Between 2022 and early 2023, 5,229 visitors were recorded, with notable participation in the various activities offered. Subsequently, the hiring of a specialized company and the resumption of activities allowed for a detailed review of the effects of these initiatives, analyzing data from August 2023 to January 2024 to discern trends and patterns in visits.
The study focused on two main groups: the general public and school groups, documenting their demographic characteristics and booking patterns. Data on the date of visit, type of group, origin of visitors, and their motivations were collected, using advanced quantitative methods (SPSS, R Studio, Python) to analyze and predict visitation trends. The research, covering from the end of summer to winter, offers a perspective on seasonal preferences, though it does not provide a complete annual picture.
The methodological approach included descriptive analyses, correlations, ANOVA, and cluster analysis, among others, to interpret the collected data. This study adhered to ethical principles, ensuring informed consent and the confidentiality of participants. Through this framework, the aim is to better understand how cultural and educational activities at these historical sites influence public perception and the valuation of cultural memory heritage, with implications for the future management and promotion of these heritage spaces.
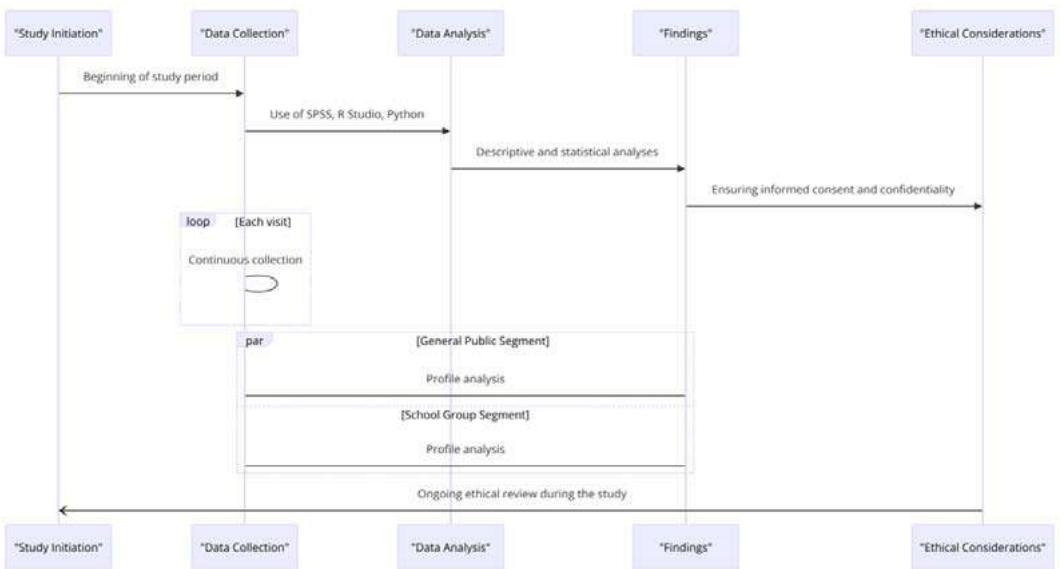 Figure 2: Flowchart of the research conducted.
## III. RESULTS
This study analyzes the distribution and characteristics of visits to certain sites, highlighting significant variations in the number of visitors by date, with December 9, 2023, recording the highest influx $(4.4\%)$. The visits are predominantly classified as "General Public" $(85.7\%)$, while "School" visits constitute $14.3\%$. There is a predominance of small groups, with $36.9\%$ of visits consisting of two people, though records of exceptionally large groups (90 or 98 visitors) are attributable to specific organizations.
The distribution of the number of visitors per group is asymmetric, evidenced by an average of
8.4791 visitors per group and a median of 3, indicating a tendency towards smaller groups but with the presence of some significantly large groups that skew the average. This asymmetry is reflected in a high standard deviation (14.08661) and variance, signaling a wide dispersion in group size.
The data suggest that visits by the "General Public" are the predominant modality, reflecting a broader preference for this option over "School" visits. Moreover, specific dates with peaks in attendance are identified, possibly associated with organized events or holidays, indicating visitation patterns influenced by programming and the type of audience.
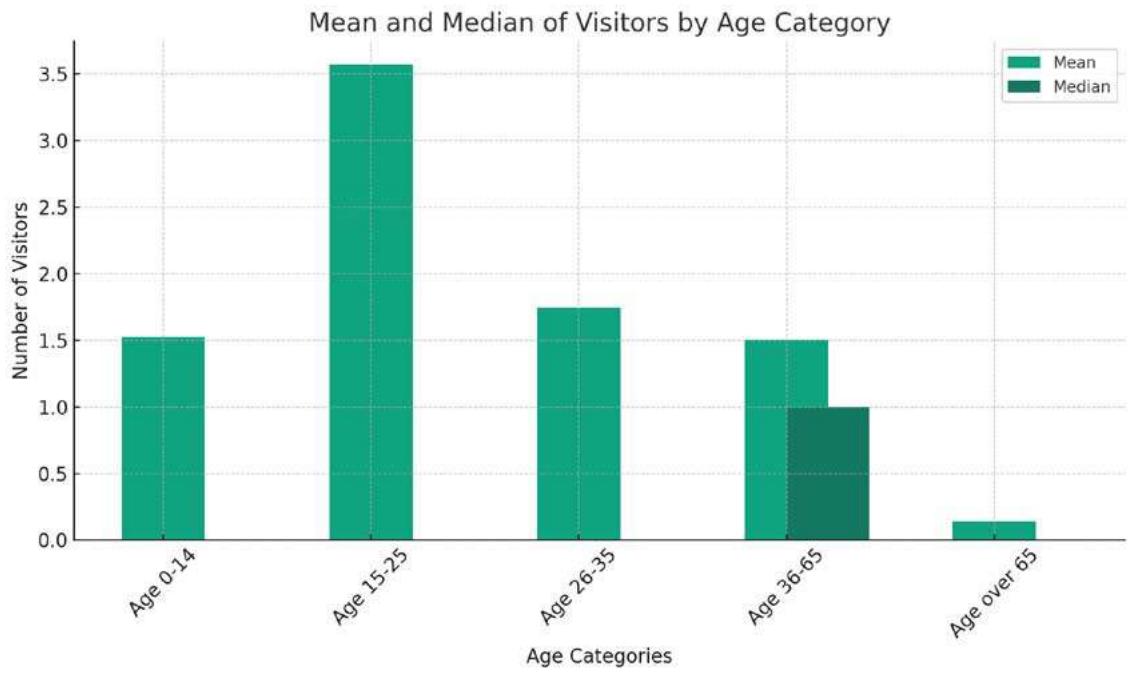 Figure 3: Bar chart showing the average and median number of visitors by age category.
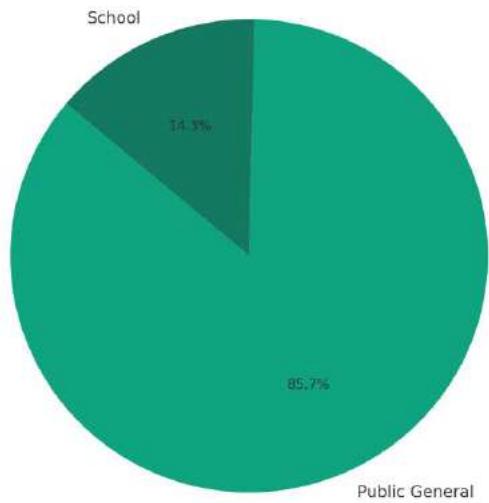 Distribution of Type of Visit Figure 4: Pie chart showing the distribution of visit types.
The analysis of the monthly distribution of visitors to the Civil War shelters in Alicante, from August 2023 to January 2024, reveals significant variations in attendance. Figure 5 illustrates these trends, highlighting differences in the volume of visitors that can be attributed to seasonality, the organization of large groups, or coincidences with holiday periods. This temporal pattern supports the research objectives by providing a detailed understanding of the dynamics of visits to these historical memory sites.
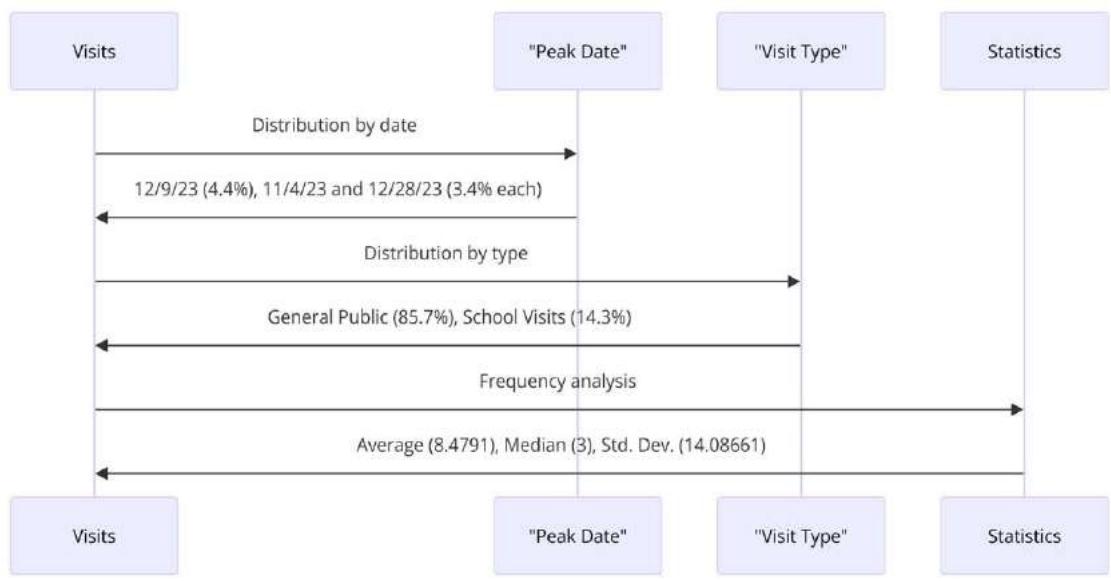 Figure 5: Sequence diagram illustrating the timing and distribution of visits.
The analysis of visits to the Civil War shelters in Alicante reveals that $85.7\%$ correspond to the General Public (Type 1), underscoring the accessibility and universal appeal of these historical sites. The predominance of this group suggests a management approach oriented towards satisfying a diversity of interests and knowledge about the site's history. School Visits (Type 2) represent $14.3\%$, highlighting the educational value of the shelters and the opportunity to intensify educational programs and collaborations with academic institutions, requiring specific resources and educational materials.
The profile of the visits shows low variability, with a majority identified as "General Public". The composition of the groups varies significantly, with an average of 8.4791 visitors per group and a high standard deviation, indicating a diverse configuration of groups from individuals and couples to larger groups.
Small Groups (1-2 Visitors) constitute $45.3\%$, possibly reflecting a preference for a more intimate visiting experience. Medium Groups (3-5 Visitors) account for $26.5\%$, evidencing attendance by families and friends, while Large Groups (more than 5 Visitors), though less frequent, demand specialized resources such as guides for large groups or specific activities.
These data inform strategic decisions for the shelters' management, emphasizing the need for a balanced approach that considers both the general public and educational needs, along with the preparation to efficiently cater to large groups, optimizing the visitor experience and ensuring the conservation of cultural heritage.
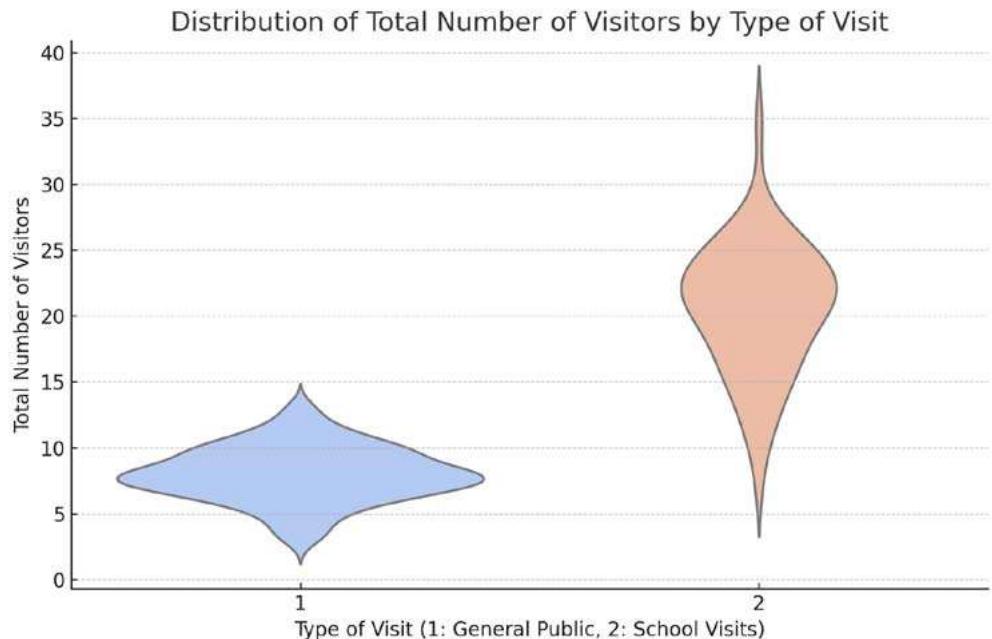 Figure 6: Violin chart combined with scatter points, showing the distribution of the total number of visitors by visit type to the Civil War shelters in Alicante.
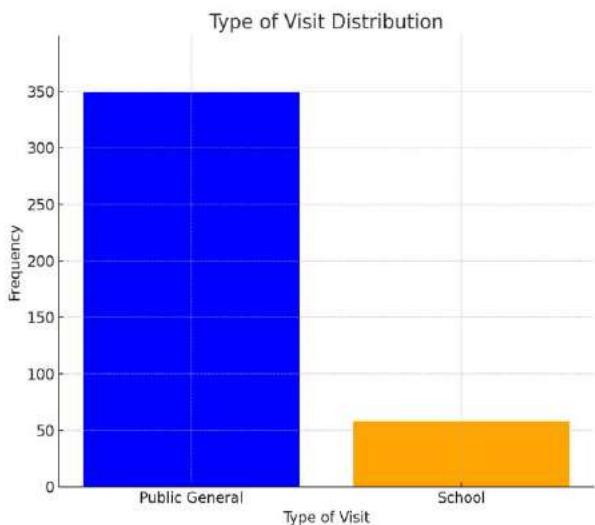
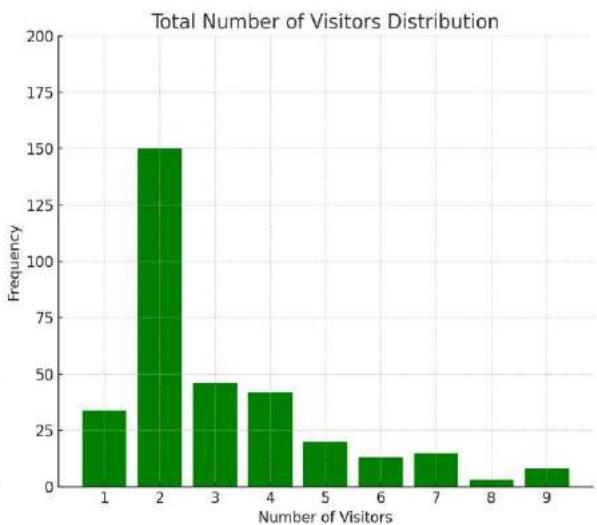 Figure 7: Charts representing the distribution of visit types and the distribution of the total number of visitors.
The Pearson correlation between the type of visit and the total number of visitors shows a strong positive correlation of 0.809, significant at the 0.01 level (Table 1). This indicates a direct and significant relationship between the type of visit and the number of visitors, demonstrating that certain types of visits attract larger groups.
Table 1: Correlations
<table><tr><td colspan="2"></td><td>Type of Visit</td><td>Total Number of
Visitors</td></tr><tr><td rowspan="5">Type of Visit</td><td>Pearson Correlation</td><td>1</td><td>,809</td></tr><tr><td>Significance (2-tailed)</td><td></td><td><.001</td></tr><tr><td>Sum of Squares and Products</td><td>49,735</td><td>1619,211</td></tr><tr><td>Covariance</td><td>,122</td><td>3,988</td></tr><tr><td>N</td><td>407</td><td>407</td></tr><tr><td rowspan="5">Total Number of Visitors</td><td>Pearson Correlation</td><td>,809</td><td>1</td></tr><tr><td>Significance (2-tailed)</td><td><.001</td><td></td></tr><tr><td>Sum of Squares and Products</td><td>1619,211</td><td>80563,572</td></tr><tr><td>Covariance</td><td>3,988</td><td>198,432</td></tr><tr><td>N</td><td>407</td><td>407</td></tr></table>
Furthermore, the Kendall Tau-b and Spearman Rho tests (Table 2) also show significant positive correlations between the type of visit and the total number of visitors (0.533 and 0.610, respectively), confirming the relationship observed in the Pearson correlation, but from an approach that does not assume a normal distribution of the data.
Table 2: Non-parametric Correlations
<table><tr><td></td><td></td><td></td><td>Type of Visit</td><td>Total Number of Visitors</td></tr><tr><td rowspan="6">Kendall's Tau-b</td><td rowspan="3">Type of Visit</td><td>Correlation Coefficient</td><td>1,000</td><td>,533</td></tr><tr><td>Significance (2-tailed)</td><td>.</td><td><,001</td></tr><tr><td>N</td><td>407</td><td>407</td></tr><tr><td rowspan="3">Total Number of Visitors</td><td>Correlation Coefficient</td><td>,533</td><td>1,000</td></tr><tr><td>Significance (2-tailed)</td><td><,001</td><td>.</td></tr><tr><td>N</td><td>407</td><td>407</td></tr><tr><td rowspan="6">Spearman's Rho</td><td rowspan="3">Type of Visit</td><td>Correlation Coefficient</td><td>1,000</td><td>,610</td></tr><tr><td>Significance (2-tailed)</td><td>.</td><td><,001</td></tr><tr><td>N</td><td>407</td><td>407</td></tr><tr><td rowspan="3">Total Number of Visitors</td><td>Correlation Coefficient</td><td>,610</td><td>1,000</td></tr><tr><td>Significance (2-tailed)</td><td><,001</td><td>.</td></tr><tr><td>N</td><td>407</td><td>407</td></tr></table>
The Pearson correlation of 0.809 between the type of visit and the number of visitors indicates a strong positive relationship; as the type of visit changes from general public (Type 1) to school (Type 2), the number of visitors increases proportionally. This coefficient, close to +1, shows a high correlation, suggesting that school visits attract more participants per group compared to the general public visits. The two-tailed statistical significance of less than 0.01 confirms the robustness of this correlation, indicating a less than $1\%$ probability that the result is due to chance, which underscores the significant influence of the type of visit on the number of visitors.
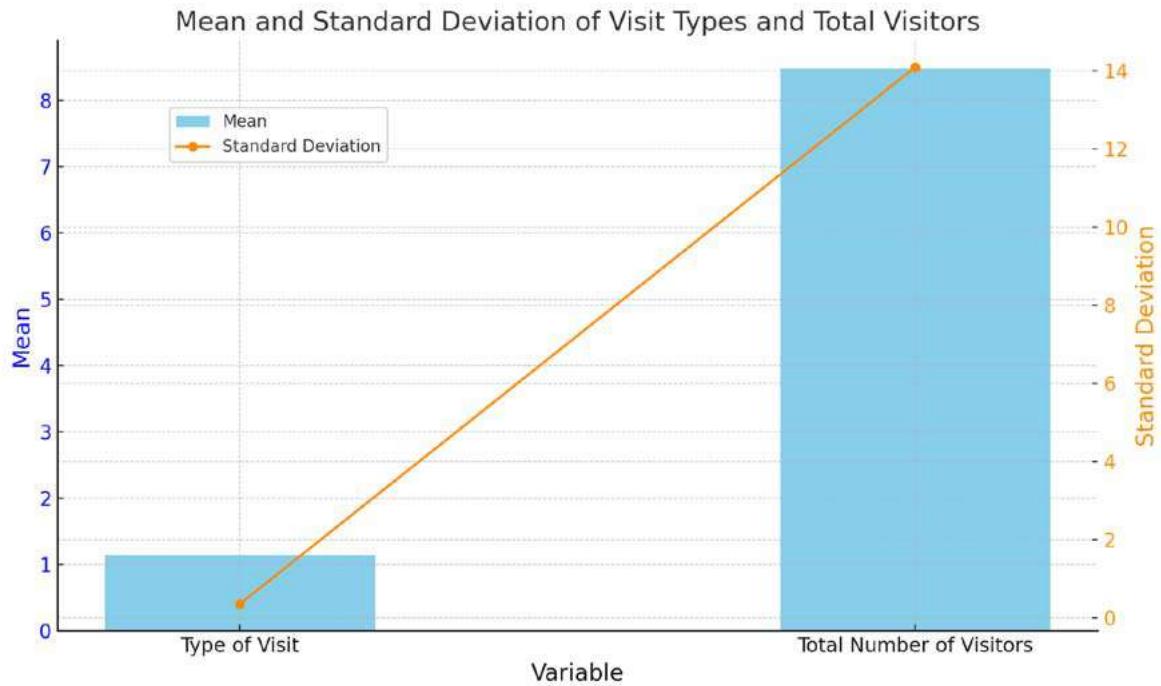 Figure 8: Chart showing the mean and standard deviation for both the type of visit and the total number of visitors.
The T-test for independent samples and the Levene's test reveal significant differences between types of visits, with an F-value of 286.351 ( $p < 0.001$ ), indicating distinct variances. The t-value of -27.689 (405 degrees of freedom, $p < 0.001$ ) underscores a pronounced difference in the number of visitors between the two types, confirmed under the assumption of unequal variances (t = -12.565, 57.820 degrees of freedom, p < 0.001). The effect size, measured by Cohen's d (8.29203), Hedges' g correction (8.30743), and Glass's $\Delta$ (19.66290), demonstrates an extreme discrepancy between the groups, evidencing the significant impact of the type of visit on visitor influx.
Table 3: Effect Sizes for Independent Samples
<table><tr><td rowspan="2" colspan="2"></td><td rowspan="2">Standardized</td><td rowspan="2">Estimation of Points</td><td colspan="2">95% Confidence Interval</td></tr><tr><td>Lower</td><td>Upper</td></tr><tr><td rowspan="3">Total Number of
Visitors</td><td>Cohen's d</td><td>8,29203</td><td>-3,926</td><td>-4,313</td><td>-3,537</td></tr><tr><td>Hedges' g</td><td>8,30743</td><td>-3,919</td><td>-4,305</td><td>-3,531</td></tr><tr><td>Glass's Δ</td><td>19,66290</td><td>-1,656</td><td>-2,064</td><td>-1,241</td></tr></table>
Therefore, the T-test reveals a statistically significant difference in the total number of visitors between the two types of visits, with Visit Type 2 being significantly more popular in terms of the number of visitors. The large difference in means and effect sizes underlines the magnitude of this difference.
This notable difference in the number of visitors between the two types indicates that Visit Type 2 has characteristics that make it more appealing to an organized and larger audience.
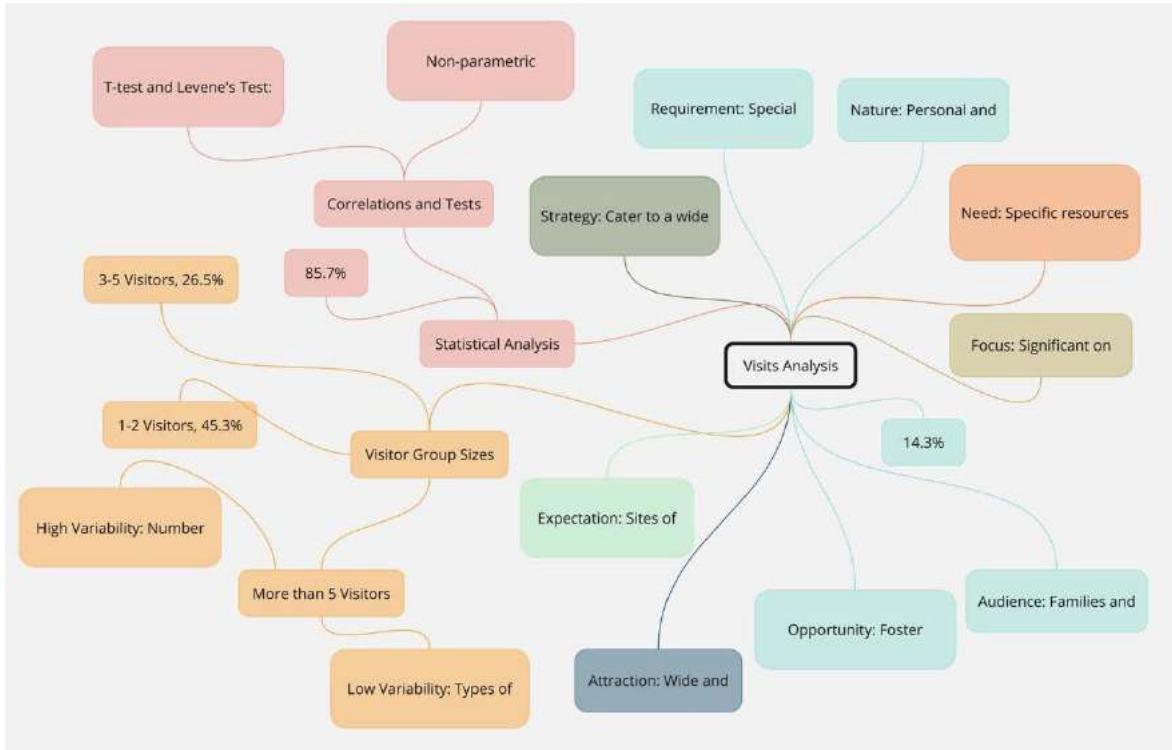 Figure 9: Mindmap diagram illustrating the analysis of types of visits and the total number of visitors.
The prevalence of larger groups in school visits (Type 2) highlights the tendency of these visits to include entire classes, usually transported by school buses, which increases the number of visitors per group. In response, the management of the shelters has implemented strategies to efficiently handle the high influx of school groups, such as assigning additional guides and opening wider spaces. Specifically, the War Interpretation Center in Alicante was constructed next to the Sénéca Square shelter to facilitate educational and interactive visits for large groups. This strategic approach has also guided the development of programs and educational materials designed to attract and effectively manage the volume and dynamics of large school groups, as evidenced in the visualization of the sequence diagram (Figure 10), which illustrates the flow from identifying the needs of school visits to the implementation of tailored solutions.
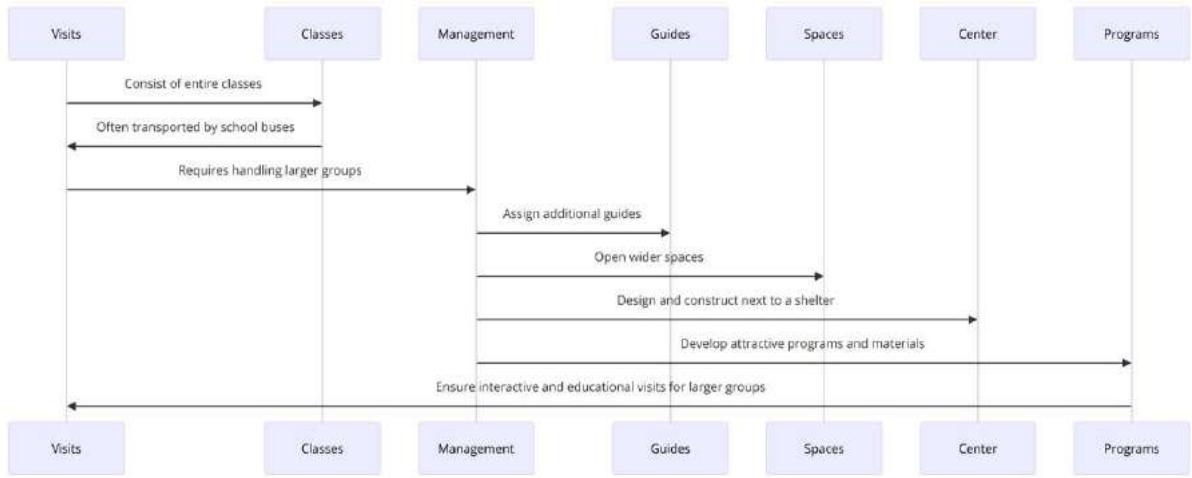 Figure 10: Flow from the identification of school visits as larger groups
The descriptive analysis reveals that the ways in which visitors discover the Civil War shelters vary widely, with an average of 11.9853 and a standard deviation of 5.00687 across 407 observations. The most frequent method is through "Internet" (24.3%), highlighting the importance of an effective online presence to attract visitors. However, $22.6\%$ of the responses were classified as "Unknown", suggesting a diversity in discovery methods not specifically identified by respondents. This underscores the relevance of digital strategies and the existence of various communication channels.
Table 4: How did you hear about the shelter visits?
<table><tr><td></td><td>N</td><td>%</td></tr><tr><td>1,00</td><td>13</td><td>3,2%</td></tr><tr><td>2,00</td><td>4</td><td>1,0%</td></tr><tr><td>3,00</td><td>34</td><td>8,4%</td></tr><tr><td>4,00</td><td>2</td><td>0,5%</td></tr><tr><td>5,00</td><td>1</td><td>0,2%</td></tr><tr><td>6,00</td><td>1</td><td>0,2%</td></tr><tr><td>7,00</td><td>37</td><td>9,1%</td></tr><tr><td>8,00</td><td>9</td><td>2,2%</td></tr><tr><td>9,00</td><td>7</td><td>1,7%</td></tr><tr><td>10,00</td><td>18</td><td>4,4%</td></tr><tr><td>11,00</td><td>6</td><td>1,5%</td></tr><tr><td>12,00</td><td>38</td><td>9,3%</td></tr><tr><td>13,00</td><td>92</td><td>22,6%</td></tr><tr><td>14,00</td><td>2</td><td>0,5%</td></tr><tr><td>15,00</td><td>5</td><td>1,2%</td></tr><tr><td>16,00</td><td>99</td><td>24,3%</td></tr><tr><td>17,00</td><td>3</td><td>0,7%</td></tr><tr><td>18,00</td><td>15</td><td>3,7%</td></tr><tr><td>19,00</td><td>9</td><td>2,2%</td></tr><tr><td>20,00</td><td>2</td><td>0,5%</td></tr><tr><td>21,00</td><td>1</td><td>0,2%</td></tr><tr><td>22,00</td><td>6</td><td>1,5%</td></tr><tr><td>23,00</td><td>1</td><td>0,2%</td></tr><tr><td>24,00</td><td>1</td><td>0,2%</td></tr><tr><td>25,00</td><td>1</td><td>0,2%</td></tr></table>
The tourist office (9.3%) and previous visits (9.1%) emerge as significant methods for discovering the shelters, highlighting the impact of recommendations and visitor loyalty. Recommendations from friends or family account for 8.4%, evidencing the influence of word-of-mouth. Although less prevalent, social media $(4.4\%)$ plays a crucial role, emphasizing the importance of attractive profiles on these platforms to inform potential visitors.
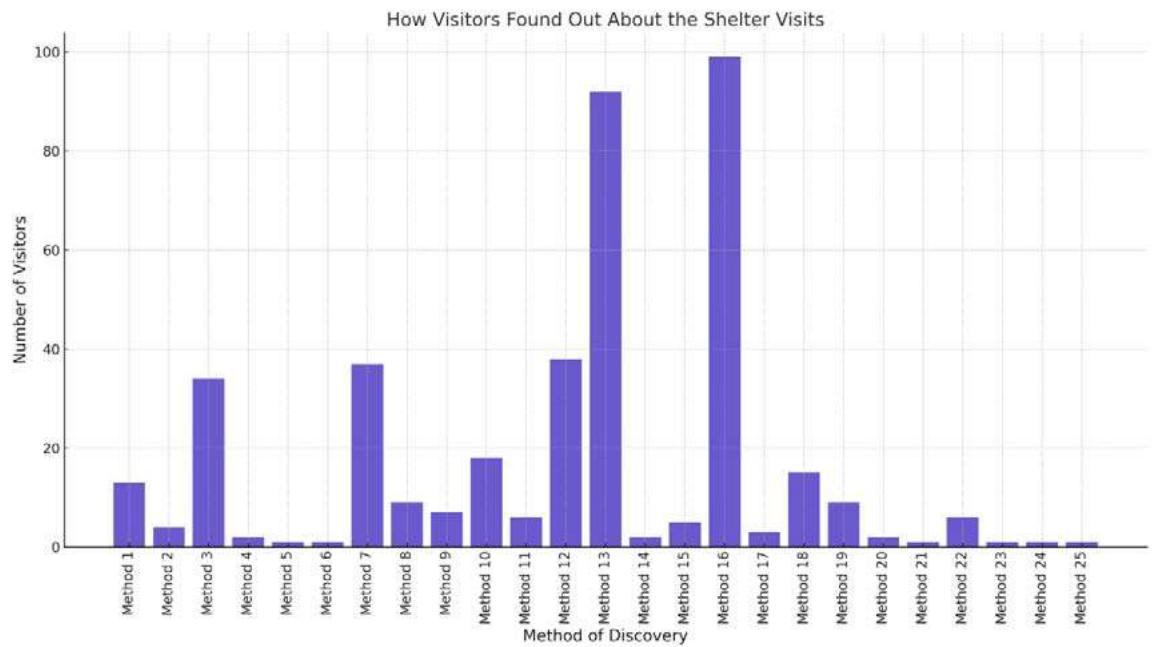 Figure 11: Bar chart showing how visitors learned about the shelter visits, using codes to represent the different methods.
The correlation analysis reveals a moderate type of visit to the shelters and how visitors find out positive relationship (Pearson = 0.296) between the about them, significant at the 0.01 level. This suggests that the means of discovery varies with the type of visit, though not markedly so. For instance, school visits might be discovered through educational channels,
while the general public might find out via the internet or advertising, indicating trends but not absolute rules.
Table 5: Correlations
<table><tr><td></td><td></td><td>Type of Visit</td><td>How did you hear about the shelter visits?</td></tr><tr><td rowspan="5">Type of Visit</td><td>Pearson Correlation</td><td>1</td><td>,296</td></tr><tr><td>Significance (2-tailed)</td><td></td><td><,001</td></tr><tr><td>Sum of Squares and Products</td><td>49,735</td><td>210,855</td></tr><tr><td>Covariance</td><td>,122</td><td>,519</td></tr><tr><td>N</td><td>407</td><td>407</td></tr><tr><td rowspan="5">How did you hear about the shelter visits?</td><td>Pearson Correlation</td><td>,296</td><td>1</td></tr><tr><td>Significance (2-tailed)</td><td><,001</td><td></td></tr><tr><td>Sum of Squares and Products</td><td>210,855</td><td>10177,912</td></tr><tr><td>Covariance</td><td>,519</td><td>25,069</td></tr><tr><td>N</td><td>407</td><td>407</td></tr></table>
The Kendall Tau-b and Spearman Rho tests, with coefficients of 0.256 and 0.295 respectively and significance at the 0.01 level, corroborate the moderate positive correlation identified by Pearson. This finding, which does not presuppose normality in the data distribution, suggests that marketing and communication strategies can be specifically tailored for each type of visit, optimizing educational channels for school visits and focusing on social media and online advertising for the general public. However, since the correlation is not strong, a diversified communication strategy addressing multiple channels is recommended.
Table 6: Non-parametric Correlations
<table><tr><td colspan="3"></td><td>Type of Visit</td><td>How did you hear about the shelter visits?</td></tr><tr><td rowspan="6">Kendall's Tau-b</td><td rowspan="3">Type of Visit</td><td>Correlation Coefficient</td><td>1,000</td><td>,256</td></tr><tr><td>Significance (2-tailed)</td><td>.</td><td><,001</td></tr><tr><td>N</td><td>407</td><td>407</td></tr><tr><td rowspan="3">How did you hear about the shelter visits</td><td>Correlation Coefficient</td><td>,256</td><td>1,000</td></tr><tr><td>Significance (2-tailed)</td><td><,001</td><td>.</td></tr><tr><td>N</td><td>407</td><td>407</td></tr><tr><td rowspan="6">Spearman's Rho</td><td rowspan="3">Type of Visit</td><td>Correlation Coefficient</td><td>1,000</td><td>,295</td></tr><tr><td>Significance (2-tailed)</td><td>.</td><td><,001</td></tr><tr><td>N</td><td>407</td><td>407</td></tr><tr><td rowspan="3">How did you hear about the shelter visits</td><td>Correlation Coefficient</td><td>,295</td><td>1,000</td></tr><tr><td>Significance (2-tailed)</td><td><,001</td><td>.</td></tr><tr><td>N</td><td>407</td><td>407</td></tr></table>
Correlations between visitors' ages and how they found out about the shelters show specific trends. The 26 to 35 age group has a weak positive correlation (Tau-b: 0.123; Spearman: 0.149), suggesting a slight relationship between their age and the methods of discovery used. In contrast, those over 65 years of age exhibit a weak negative correlation (Tau-b: -0.090; Spearman: -0.105), indicating differences in how this age group learns about the visits. These findings underscore the importance of tailoring communication strategies to different age groups, valuing both online presence and word-of-mouth.
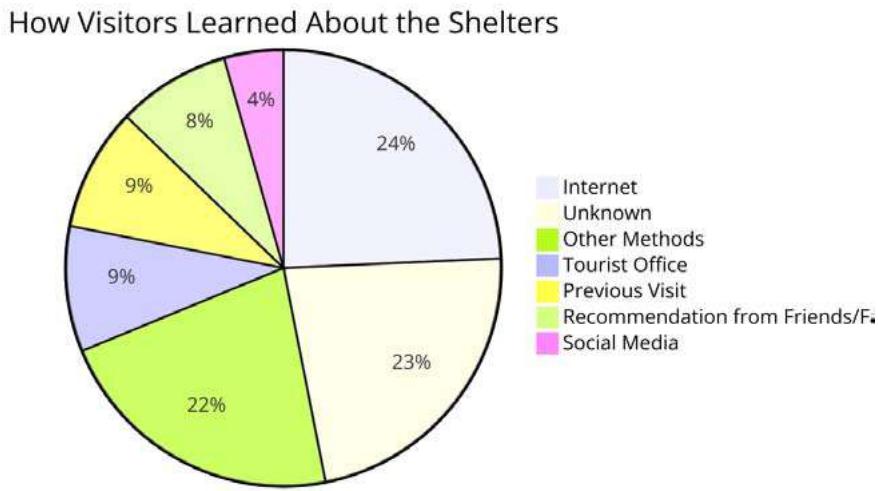 Figure 12: Pie-chart diagram illustrating how visitors learned about the shelters, showing the distribution of discovery methods among visitors.
We have developed a network graph that illustrates the main methods of discovery (Internet, Unknown, Tourist Office, Previous Visit, Recommendation from Friends or Family, and social media) as nodes, interconnecting them with types of visits (General Public vs. School Visits) through correlations. This conceptual approach emphasizes the relevance of each method and its link to the types of visits, facilitating understanding of how visitors combine various channels to obtain information about the shelters, highlighting the interconnection between different means of discovery.
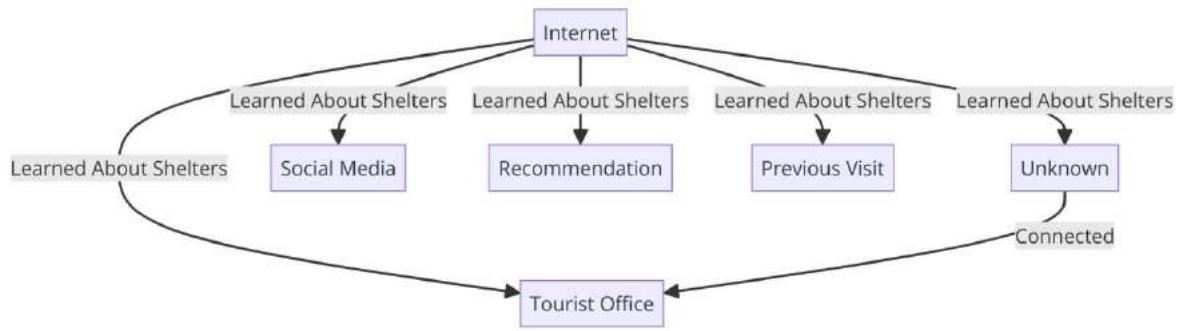 Figure 13: Network graph or connection map, showing the methods of discovery for visits to the shelters as nodes and the interrelations between them as connections.
The analysis of age group participation among visitors to the shelters reveals that children (0 to 14 years) participate minimally, with an $88.7\%$ absence in these groups, suggesting that the content of the Spanish Civil War might not be considered attractive or appropriate for them. The percentages of children's participation significantly decrease in groups, from $3.2\%$ for one child to $0.2\%$ in groups with 72 children, typically school groups.
Non-parametric correlations show a moderate positive relationship between the total number of visitors and age, with Tau-b (0.278) and Rho (0.315) coefficients, indicating that larger groups tend to include children of this age range. A One-Way ANOVA confirms statistically significant differences in the number of visitors among age groups of 0 to 14 years, with an F value of 8.414 and significance less than 0.001, demonstrating that variation in the number of visitors by age group is not random and highlights specific patterns of participation in these visits.
Table 7: ANOVA
<table><tr><td rowspan="2"></td><td colspan="5">Total Number of Visitors</td></tr><tr><td>Sum of Squares</td><td>df</td><td>Mean Square</td><td>F</td><td>Significance</td></tr><tr><td>Between Groups</td><td>23551,288</td><td>19</td><td>1239,541</td><td>8,414</td><td><.001</td></tr><tr><td>Within Groups</td><td>57012,284</td><td>387</td><td>147,319</td><td></td><td></td></tr><tr><td>Total</td><td>80563,572</td><td>406</td><td></td><td></td><td></td></tr></table>
Furthermore, the fixed-effect Eta squared and Omega squared are relatively high (approximately 0.29 and 0.25 respectively), indicating that a considerable proportion of the variability in the total number of visitors can be attributed to differences among the 0 to 14-year-old age groups.
Table 8: ANOVA Effect Sizesa
<table><tr><td></td><td></td><td></td><td rowspan="2">Point Estimate</td><td colspan="2">95% Confidence Interval</td></tr><tr><td></td><td></td><td></td><td>Lower</td><td>Upper</td></tr><tr><td>Total Number of Visitors</td><td>Eta Squared</td><td></td><td>,292</td><td>,186</td><td>,329</td></tr><tr><td></td><td>Epsilon Squared</td><td></td><td>,258</td><td>,147</td><td>,296</td></tr><tr><td></td><td>Fixed Effect Squared</td><td>Omega</td><td>,257</td><td>,146</td><td>,296</td></tr><tr><td></td><td>Random Effect Squared</td><td>Omega</td><td>,018</td><td>,009</td><td>,022</td></tr></table>
a. Eta Squared and Epsilon Squared are estimated based on the fixed effect model.
The majority of visits occur in small groups or individually, as indicated by the total of 361 observations in the individual visitors or small groups category, with an average of 7.3740 visitors and a standard deviation of 12.56655. This shows that participation in small groupings is common, though with variability in group size. Larger groups are rare, with some records reaching up to 98 visitors, but represent exceptions. Predominantly, visits are characterized by a smaller number of participants.
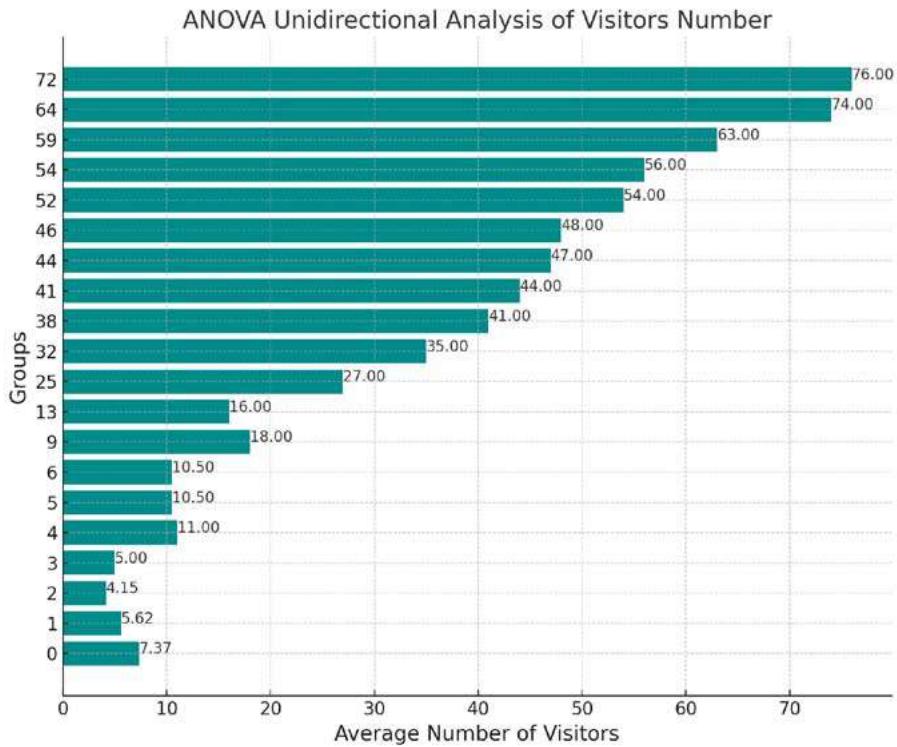 Figure 14: Chart of the One-Way ANOVA analysis of visitors
The correlation between the type of visits and the age of the visitors, though weak (Tau-b: 0.117; Spearman: 0.119), is significant, indicating that children aged 0 to 14 years tend to participate more in school visits (Type 2). This finding reflects the tendency to include children in educational activities, especially in contexts related to history such as the Civil War shelters. The stacked bar chart in Figure 15 illustrates how visitors are distributed by age range in both types of visits, offering a visual comparison between the participation of different age groups in general public versus school visits, highlighting the specific weight of each age segment in the composition of the groups.
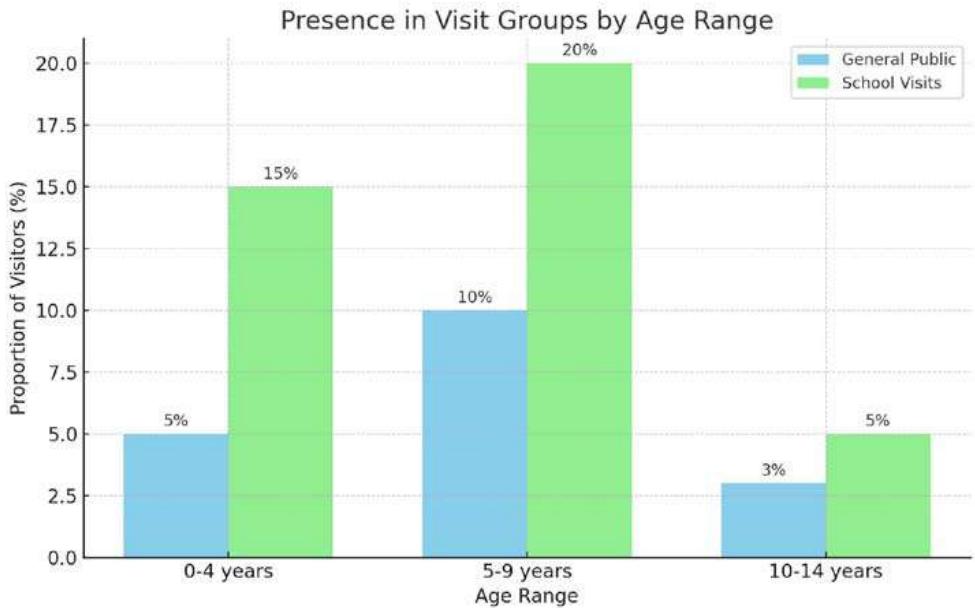 Figure 15: Stacked bar chart to provide a visualization of the distribution of visitors by age range within groups, distinguishing between general public visits and school visits
A significant majority of visit groups (72.5%) do not include young people aged 15 to 25, suggesting lower participation from this demographic group. However, this age range shows a more notable presence compared to younger age groups, especially in configurations of two visitors per group (10.1%). Correlations indicate a significant relationship between group size and the inclusion of young adults (Tau-b: 0.395; Rho: 0.450), and a strong association with visits of a specific type, more common among high school and university students (Tau-b: 0.402; Rho: 0.425).
The One-Way ANOVA analysis on the number of visitors in the 15 to 25 age range reveals variability in the average number of visitors per group, with some groups attracting significantly more young people, implying frequent organization of visits by educational institutions. The variability is confirmed by a sum of squares between groups and an F value of 16.660, indicating statistically significant differences. An Eta squared of 0.604 and a significant Omega squared indicate that more than $60\%$ of the variability in the number of visitors is attributed to differences among groups, reflecting a considerable impact of visits organized by educational centers in attracting this age group.
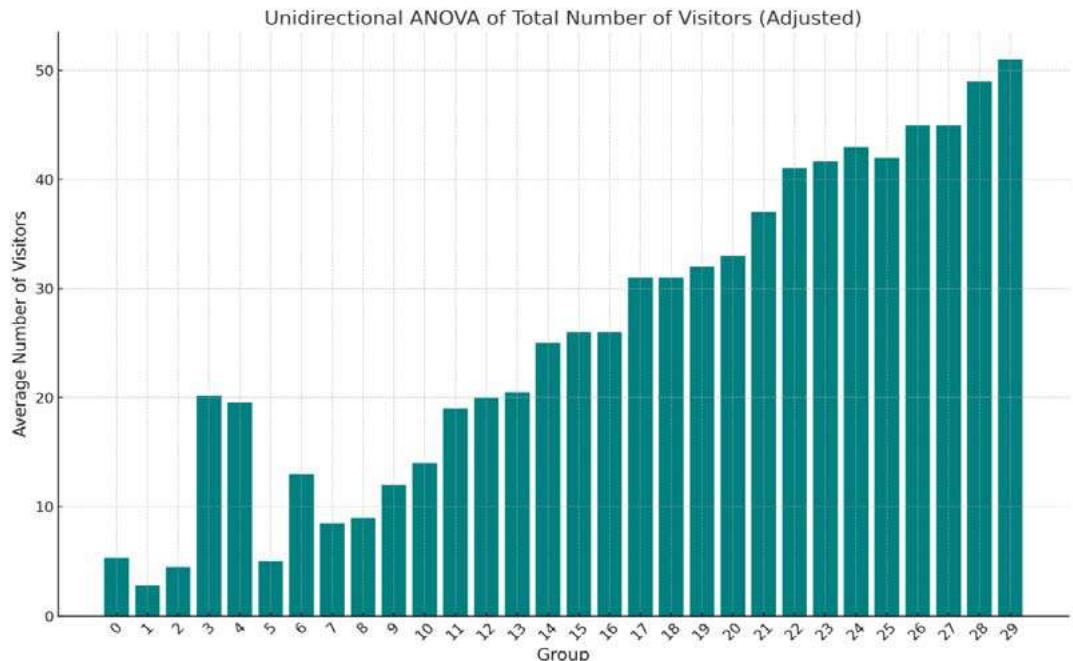 Figure 16: Adjusted chart of the One-Way ANOVA analysis of visitors
The stacked bar chart in Figure 17 illustrates the age composition of visitor groups, highlighting a higher participation of young people aged 15 to 25, especially in school visits. This visualization evidences a marked interest or organized involvement by educational entities for this age range, in contrast to the 0 to 14-year-old segment. The differences in participation between general and school visits underscore the importance of this group in educational settings.
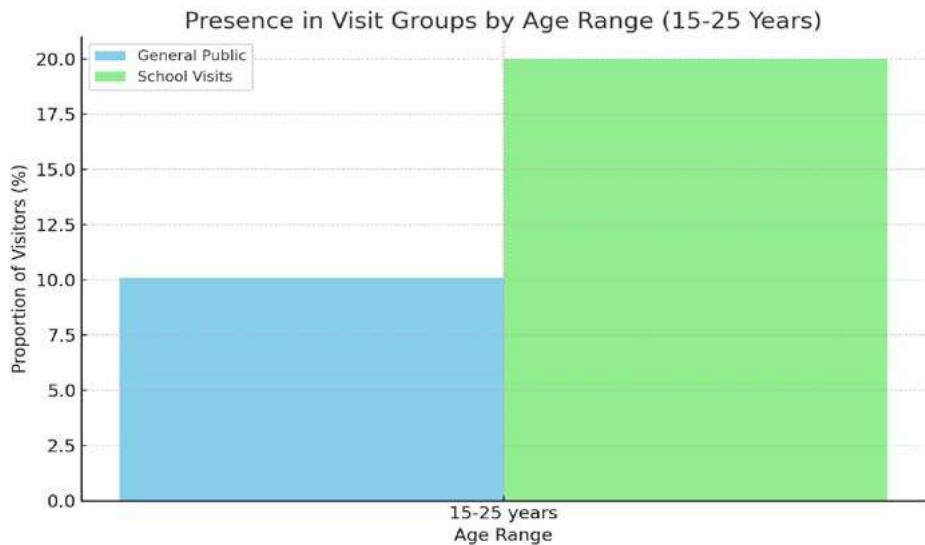 Figure 17: Stacked bar chart to provide a visualization of the distribution of visitors by age range within groups, distinguishing between general public visits and school visits.
The analysis of the age range of 26 to 35 years reveals that $56.5\%$ of groups have no participants of this age, in contrast to $20.1\%$ that include at least one young adult per group. Although the correlation between group size and age is positive (Tau-b: 0.211; Rho: 0.239), it suggests a lesser tendency of these young adults towards large groups compared to the 15 to 25 age group. With a predominant sample of 230 groups, the average of 8.2348 visitors shows variability, highlighting groups with a notably high average of 50.75 visitors, indicating specific activities or attributes that significantly attract this segment.
The ANOVA highlights significant differences in the number of visitors per group, affected by the grouping variable, with an Eta squared of 0.151 indicating a moderate effect, suggesting the influence of other factors on the variability of the number of visitors. The non-homogeneity of variances $(p < 0.001)$ and significant differences between groups $(p < 0.001)$ confirm that specific demographic characteristics significantly impact the attraction of visitors from this age range.
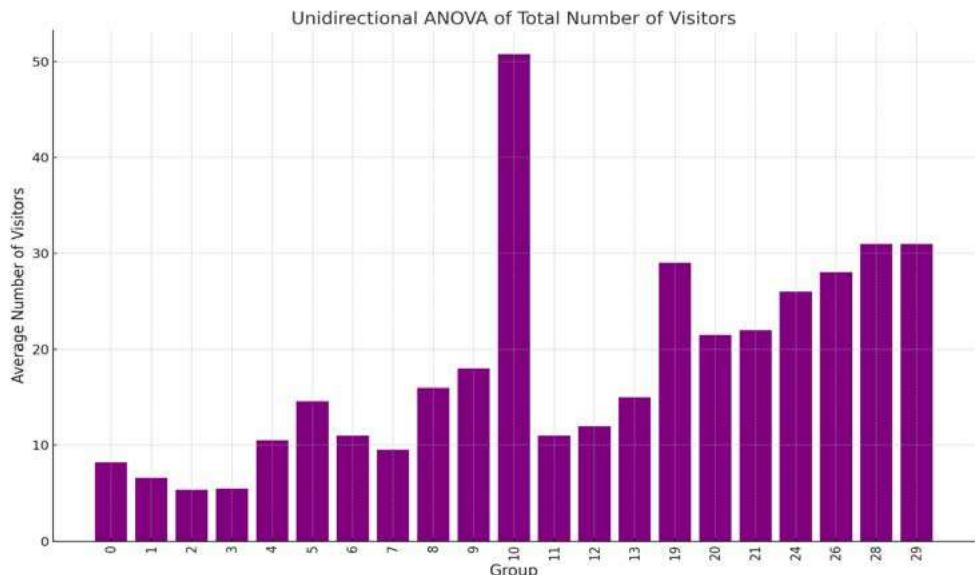 Figure 18: Chart of the One-Way ANOVA analysis of visitors
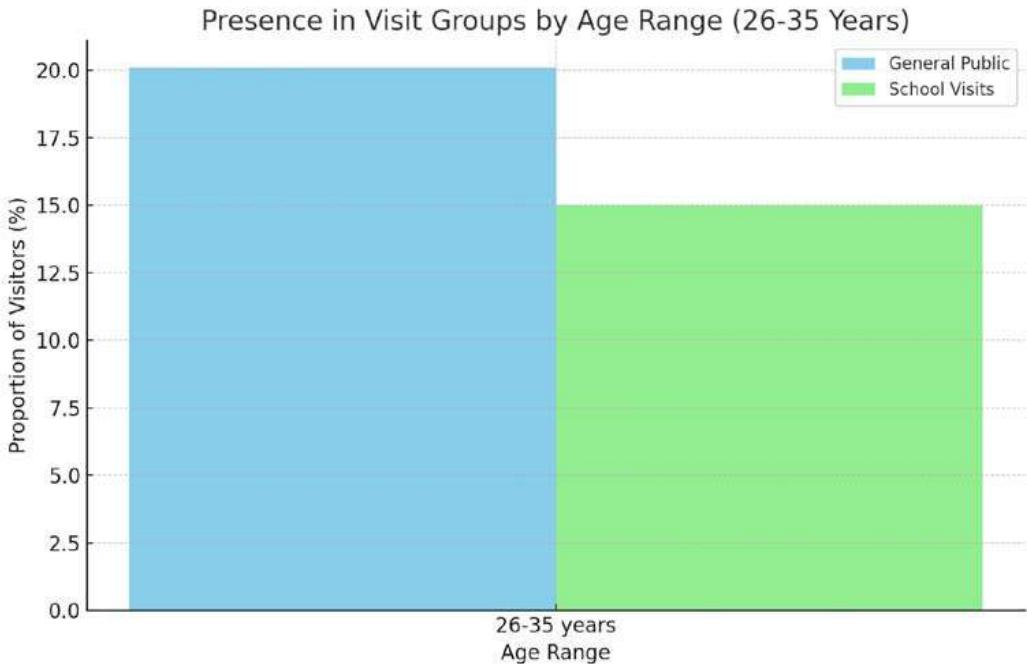 Figure 19: Stacked bar chart to provide a visualization of the distribution of visitors by age range within groups, distinguishing between general public visits and school visits.
The age group of 36 to 65 years shows the highest activity in visits, with only $46.7\%$ of groups having no representatives from this age range, indicating their active participation. The average number of visitors is 8.4791, with a standard deviation of 14.08661, reflecting a wide dispersion in the number of visitors per group, from individuals to groups of 98 people. The high frequency of couples $(27.5\%)$ suggests that adult visitors often attend in pairs.
Although the correlation between the total number of visitors and age is positive (Tau-b: 0.194; Rho: 0.229), it is less pronounced than in younger age ranges, indicating a significant but not predominant presence in large groups. The ANOVA analysis shows a low Eta squared (0.017), indicating that the influence of the grouping variable on the number of visitors from this age range is minimal, suggesting a limited impact on the variation of the number of visitors among groups.
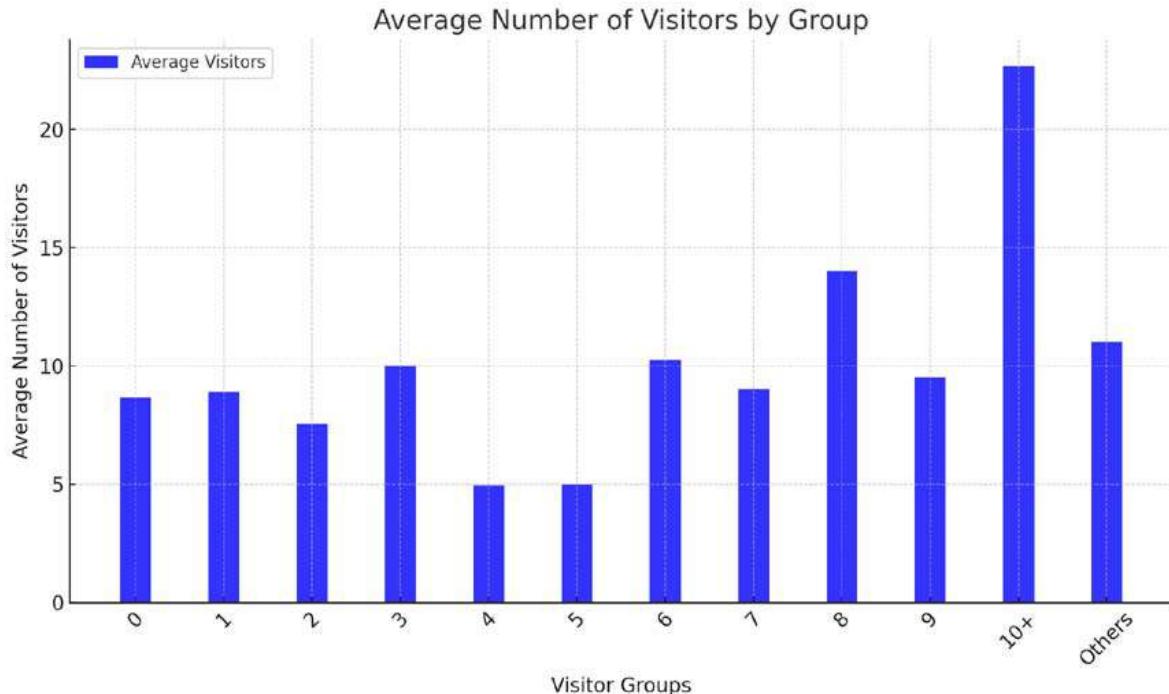 Figure 20: Chart of the One-Way ANOVA analysis of visitors
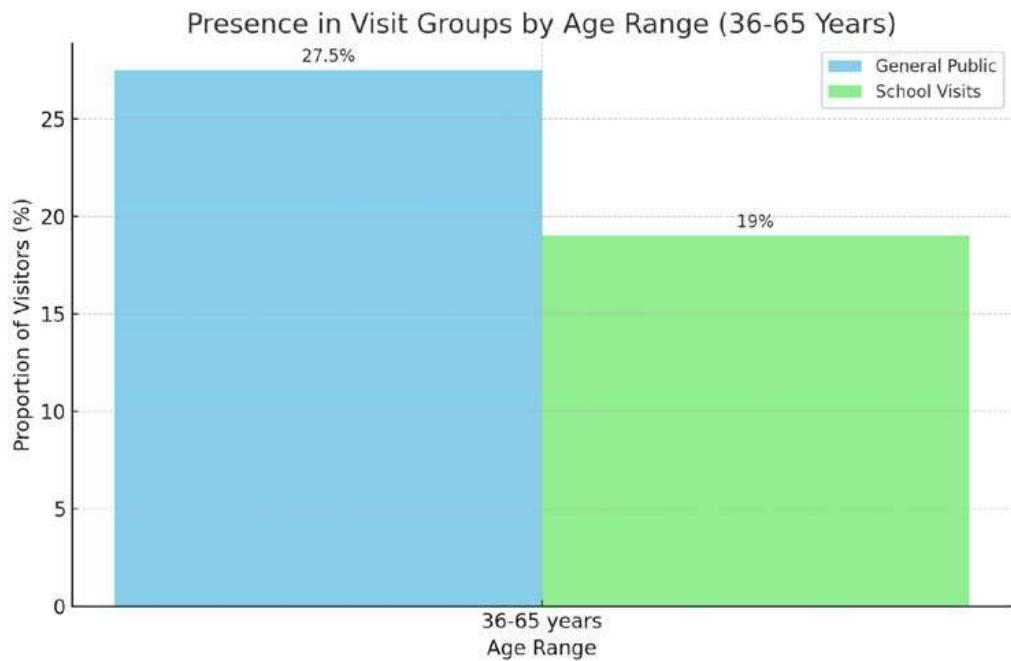 Figure 21: Bar chart for the age range of 36 to 65 years Panel label: A.
$93.9\%$ of visits exclude individuals over 65 years old, suggesting possible perceptions of inaccessibility or disinterest in this age group. Participation from this segment is marginal, with a minority of groups including 1 or 2 older visitors. The lack of correlation between the total number of visitors and age (Tau-b and Rho: 0.000) demonstrates that the presence of visitors over 65 does not significantly affect the size of the group.
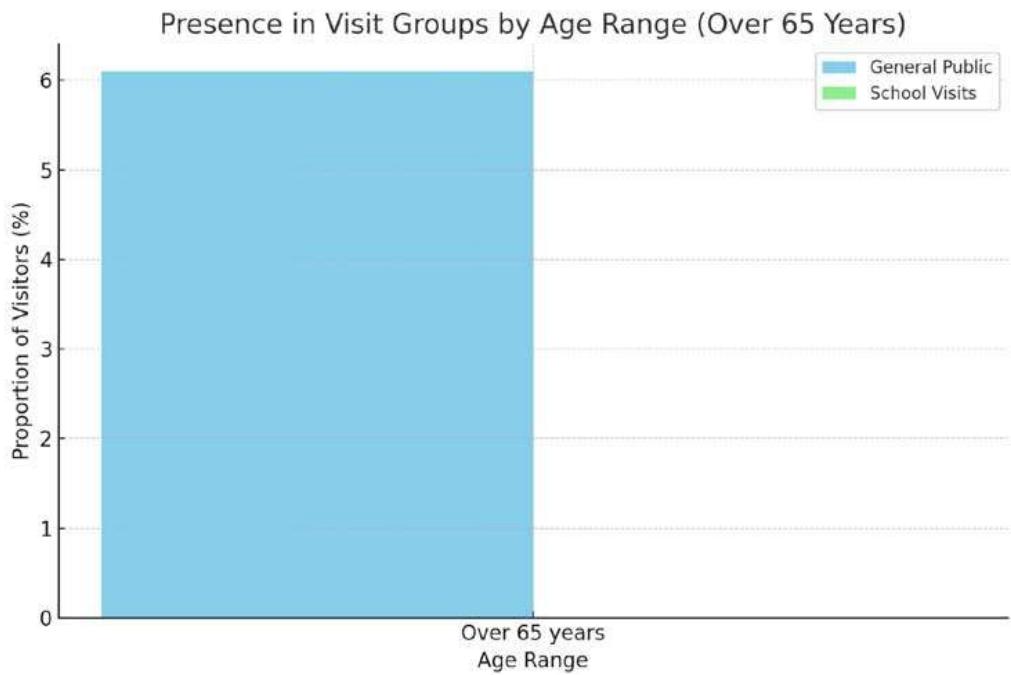 Figure 22: Bar chart for the age range of over 65 years
The data indicate that the size of the visitor group correlates positively with the inclusion of young people (15 to 25 years), suggesting that visits with larger groups are often organized by educational institutions for teenagers and young adults. Similarly, it is observed that adult groups also form part of large gatherings, generally as organized collectives, cruise participants, or in tourist packages, highlighting the varied demographic composition of the larger groups.
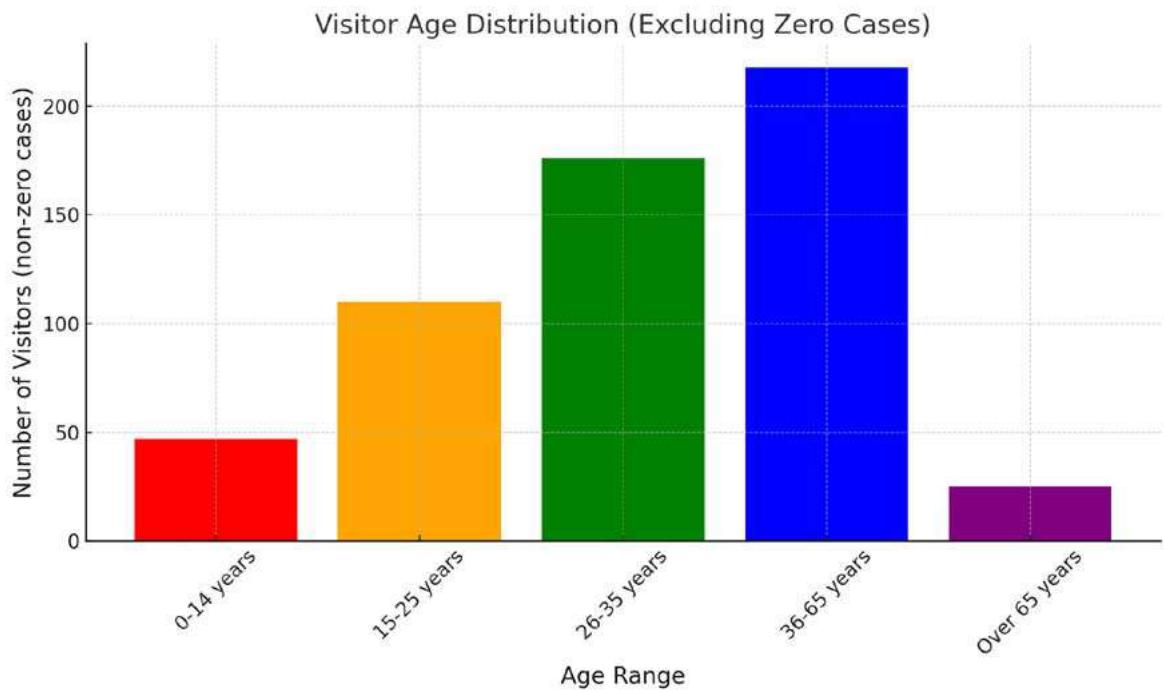 Figure 23: Bar chart showing the distribution of visitors by age range, excluding cases where there are no visitors in that age range.
The lack of correlation between group size and visitors over 65 years old suggests that they prefer smaller groups or participate less in these activities. This encourages the development of programs appealing to youth and young adults, who tend to form larger groups.
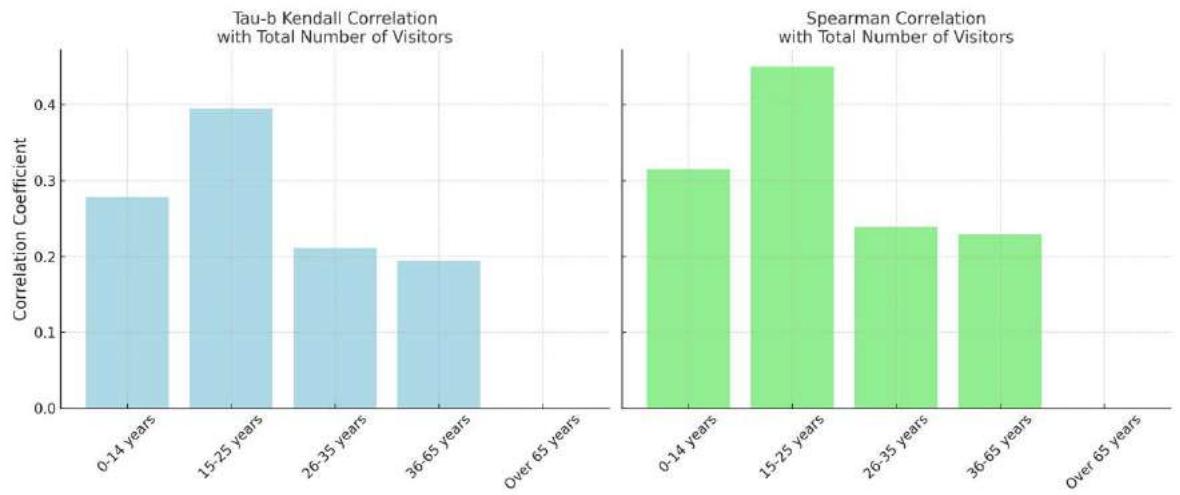 Figure 24: Chart of Kendall's Tau-b and Spearman's correlations.
Similarly, the results highlight a significant relationship between the type of visit and visitors aged 15 to 25 years. This is relevant for organizing events at heritage sites of memory, where activities are designed to attract this age group, leveraging the types of visits that already appear to be of their interest.
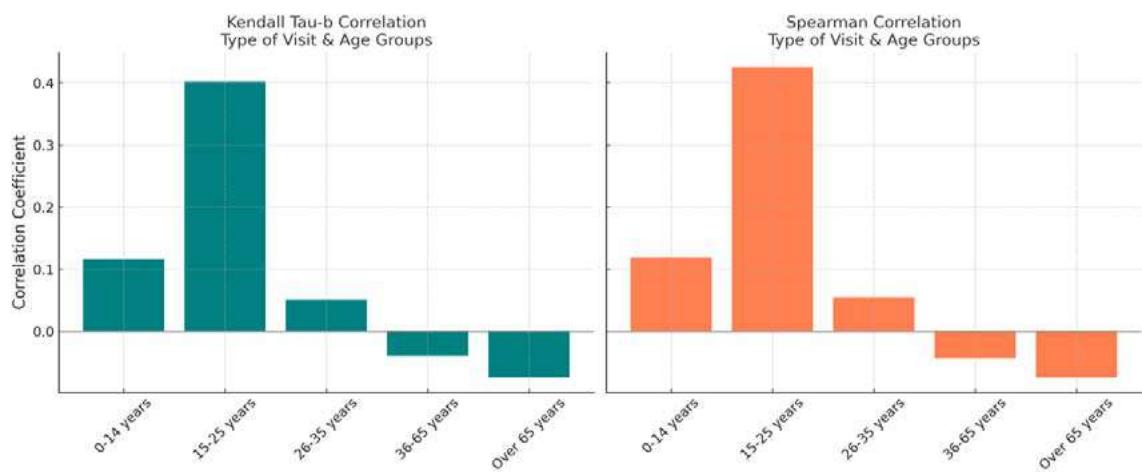 Figure 25: Charts showing the Kendall Tau-b and Spearman correlations between the type of visit and different age groups.
The T-test shows that there are no significant differences in the number of visitors aged 0 to 14 years, while for those aged 15 to 25 years, the differences are marginally non-significant $(p = 0.060)$. However, for visitors aged 26 to 35 years, there is a significant increase in the number of visitors $(p < 0.003)$, a trend that continues in the group of 36 to 65 years, albeit with marginal significance $(p = 0.065)$. These results suggest a growing relationship between the age of the visitors and the size of the group, particularly marked in the age ranges of 26 to 35 and 36 to 65 years. This variability in statistical significance among age groups underscores the importance of tailoring and promoting experiences that attract specific age segments, particularly those who show a greater inclination to visit in significant numbers.
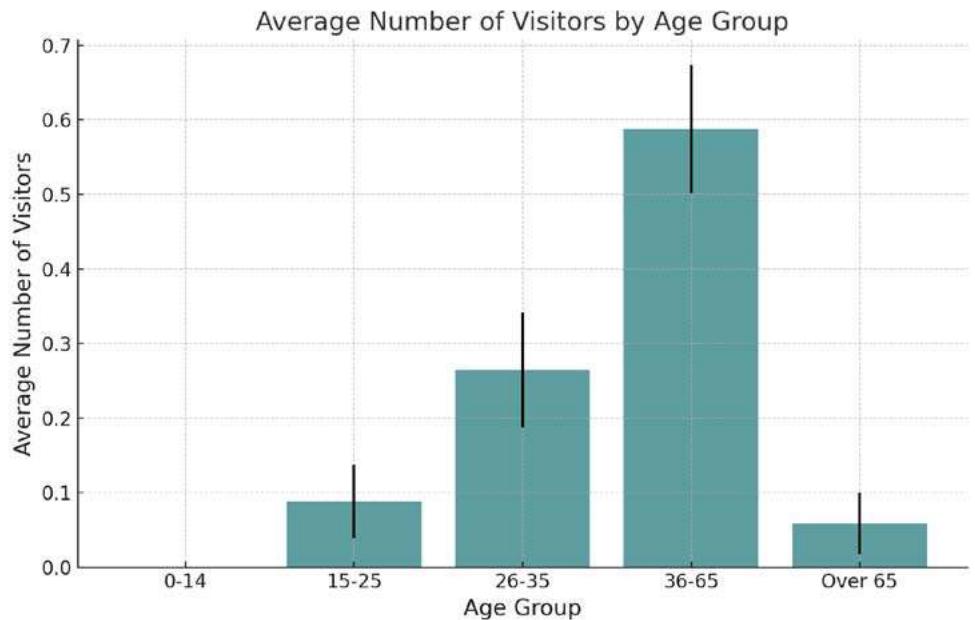 Figure 26: Bar chart visually illustrating trends in the number of visitors in relation to their age, especially highlighting the increase in the average number of visitors in the age group of 36 to 65 years.
Table 9: Group Statistics
<table><tr><td></td><td>Total Number of
Visitors</td><td>N</td><td>Mean</td><td>Standard Deviation</td><td>Standard Error of Mean</td></tr><tr><td rowspan="2">Age 0 to 14 years</td><td>1,00</td><td>34</td><td>,0000</td><td>,00000</td><td>,00000</td></tr><tr><td>2,00</td><td>150</td><td>,0200</td><td>,18208</td><td>,01487</td></tr><tr><td rowspan="2">Age 15 to 25 years</td><td>1,00</td><td>34</td><td>,0882</td><td>,28790</td><td>,04937</td></tr><tr><td>2,00</td><td>150</td><td>,2733</td><td>,67453</td><td>,05508</td></tr><tr><td rowspan="2">Age 26 to 35 years</td><td>1,00</td><td>34,2647</td><td>,44781</td><td>,07680</td></tr><tr><td>2,00</td><td>150,7333</td><td>,95304</td><td colspan="2">,07782</td></tr><tr><td rowspan="2">Age 36 to 65 years</td><td>1,00</td><td>34,5882</td><td>,49955</td><td>,08567</td></tr><tr><td>2,00</td><td>150,8533</td><td>,98571</td><td colspan="2">,08048</td></tr><tr><td rowspan="2">Age over 65 years</td><td>1,00</td><td>34,0588</td><td>,23883</td><td>,04096</td></tr><tr><td>2,00</td><td>150,1200</td><td>,47656</td><td colspan="2">,03891</td></tr></table>
Table 10: Effect Sizes for Independent Samples
<table><tr><td></td><td></td><td>Standardizer<a></td><td>Point Estimate</td><td colspan="2">95% Confidence Interval</td></tr><tr><td></td><td></td><td></td><td></td><td>Lower</td><td>Upper</td></tr><tr><td rowspan="3">Age 0 to 14 years</td><td>Cohen's d</td><td>,16475</td><td>-,121</td><td>-,494</td><td>,251</td></tr><tr><td>Hedges' g</td><td>,16543</td><td>-,121</td><td>-,492</td><td>,250</td></tr><tr><td>Glass's Δ</td><td>,18208</td><td>-,110</td><td>-,482</td><td>,263</td></tr><tr><td rowspan="3">Age 15 to 25 years</td><td>Cohen's d</td><td>,62251</td><td>-,297</td><td>-,670</td><td>,077</td></tr><tr><td>Hedges' g</td><td>,62509</td><td>-,296</td><td>-,668</td><td>,076</td></tr><tr><td>Glass's Δ</td><td>,67453</td><td>-,274</td><td>-,648</td><td>,100</td></tr><tr><td rowspan="3">Age 26 to 35 years</td><td>Cohen's d</td><td>,88315</td><td>-,531</td><td>-,906</td><td>-,154</td></tr><tr><td>Hedges' g</td><td>,88681</td><td>-,528</td><td>-,902</td><td>-,153</td></tr><tr><td>Glass's Δ</td><td>,95304</td><td>-,492</td><td>-,867</td><td>-,114</td></tr><tr><td rowspan="3">Age 36 to 65 years</td><td>Cohen's d</td><td>,91690</td><td>-,289</td><td>-,662</td><td>,085</td></tr><tr><td>Hedges' g</td><td>,92070</td><td>-,288</td><td>-,659</td><td>,084</td></tr><tr><td>Glass's Δ</td><td>,98571</td><td>-,269</td><td>-,642</td><td>,105</td></tr><tr><td rowspan="3">Age over 65 years</td><td>Cohen's d</td><td>,44303</td><td>-,138</td><td>-,510</td><td>,235</td></tr><tr><td>Hedges' g</td><td>,44487</td><td>-,138</td><td>-,508</td><td>,234</td></tr><tr><td>Glass's Δ</td><td>,47656</td><td>-,128</td><td>-,501</td><td>,244</td></tr></table>
## IV. DISCUSSION
This study delves into the intersection of the rehabilitation of historical sites with cultural heritage and collective memory, evaluating how the Civil War shelters in Alicante, once rehabilitated and opened to the public, impact public perception and contribute to the enrichment of the city's cultural memory heritage. By analyzing the profile and behavior of visitors through quantitative methodologies, this work aligns with previous research that has highlighted the effectiveness of these approaches to understand dynamics at cultural heritage sites (Barrie et al., 2015; Edstrom et al., n.d.; M. Smith et al., 2020).
The analysis of the results obtained in this research is deepened by integrating the findings of previous studies that have addressed the effect of the rehabilitation of historical places on cultural heritage and the conservation of collective memory, as well as those that have employed similar methodologies to investigate the attitudes and profiles of visitors (Boyd & Timothy, 2002; Leask & Fyall, 2006; Richards, 2013). This intersection not only contextualizes our research within an expanded theoretical and methodological spectrum but also provides valuable conclusions for navigating the complex dynamics involved in the management and promotion of cultural heritage in urban settings.
Furthermore, the incorporation of future qualitative analyses to explore visitors' personal experiences and their emotional connection to these spaces follows the suggestion of studies that combine both methodologies (Cheng et al., 2016; Gounden et al., 2020; Rodgers et al., 2023)
The importance of integrating history into the urban environment, emphasizing the rehabilitation of memory sites for education and the conservation of collective memory, has been highlighted by research in the field of mnemohistory (Arnet, 2022; Galaz-Mandakovic & Rivera, 2023; Luo & Cao, 2023; Tamm, 2013, 2015; Wagner-Pacifici, 2010).
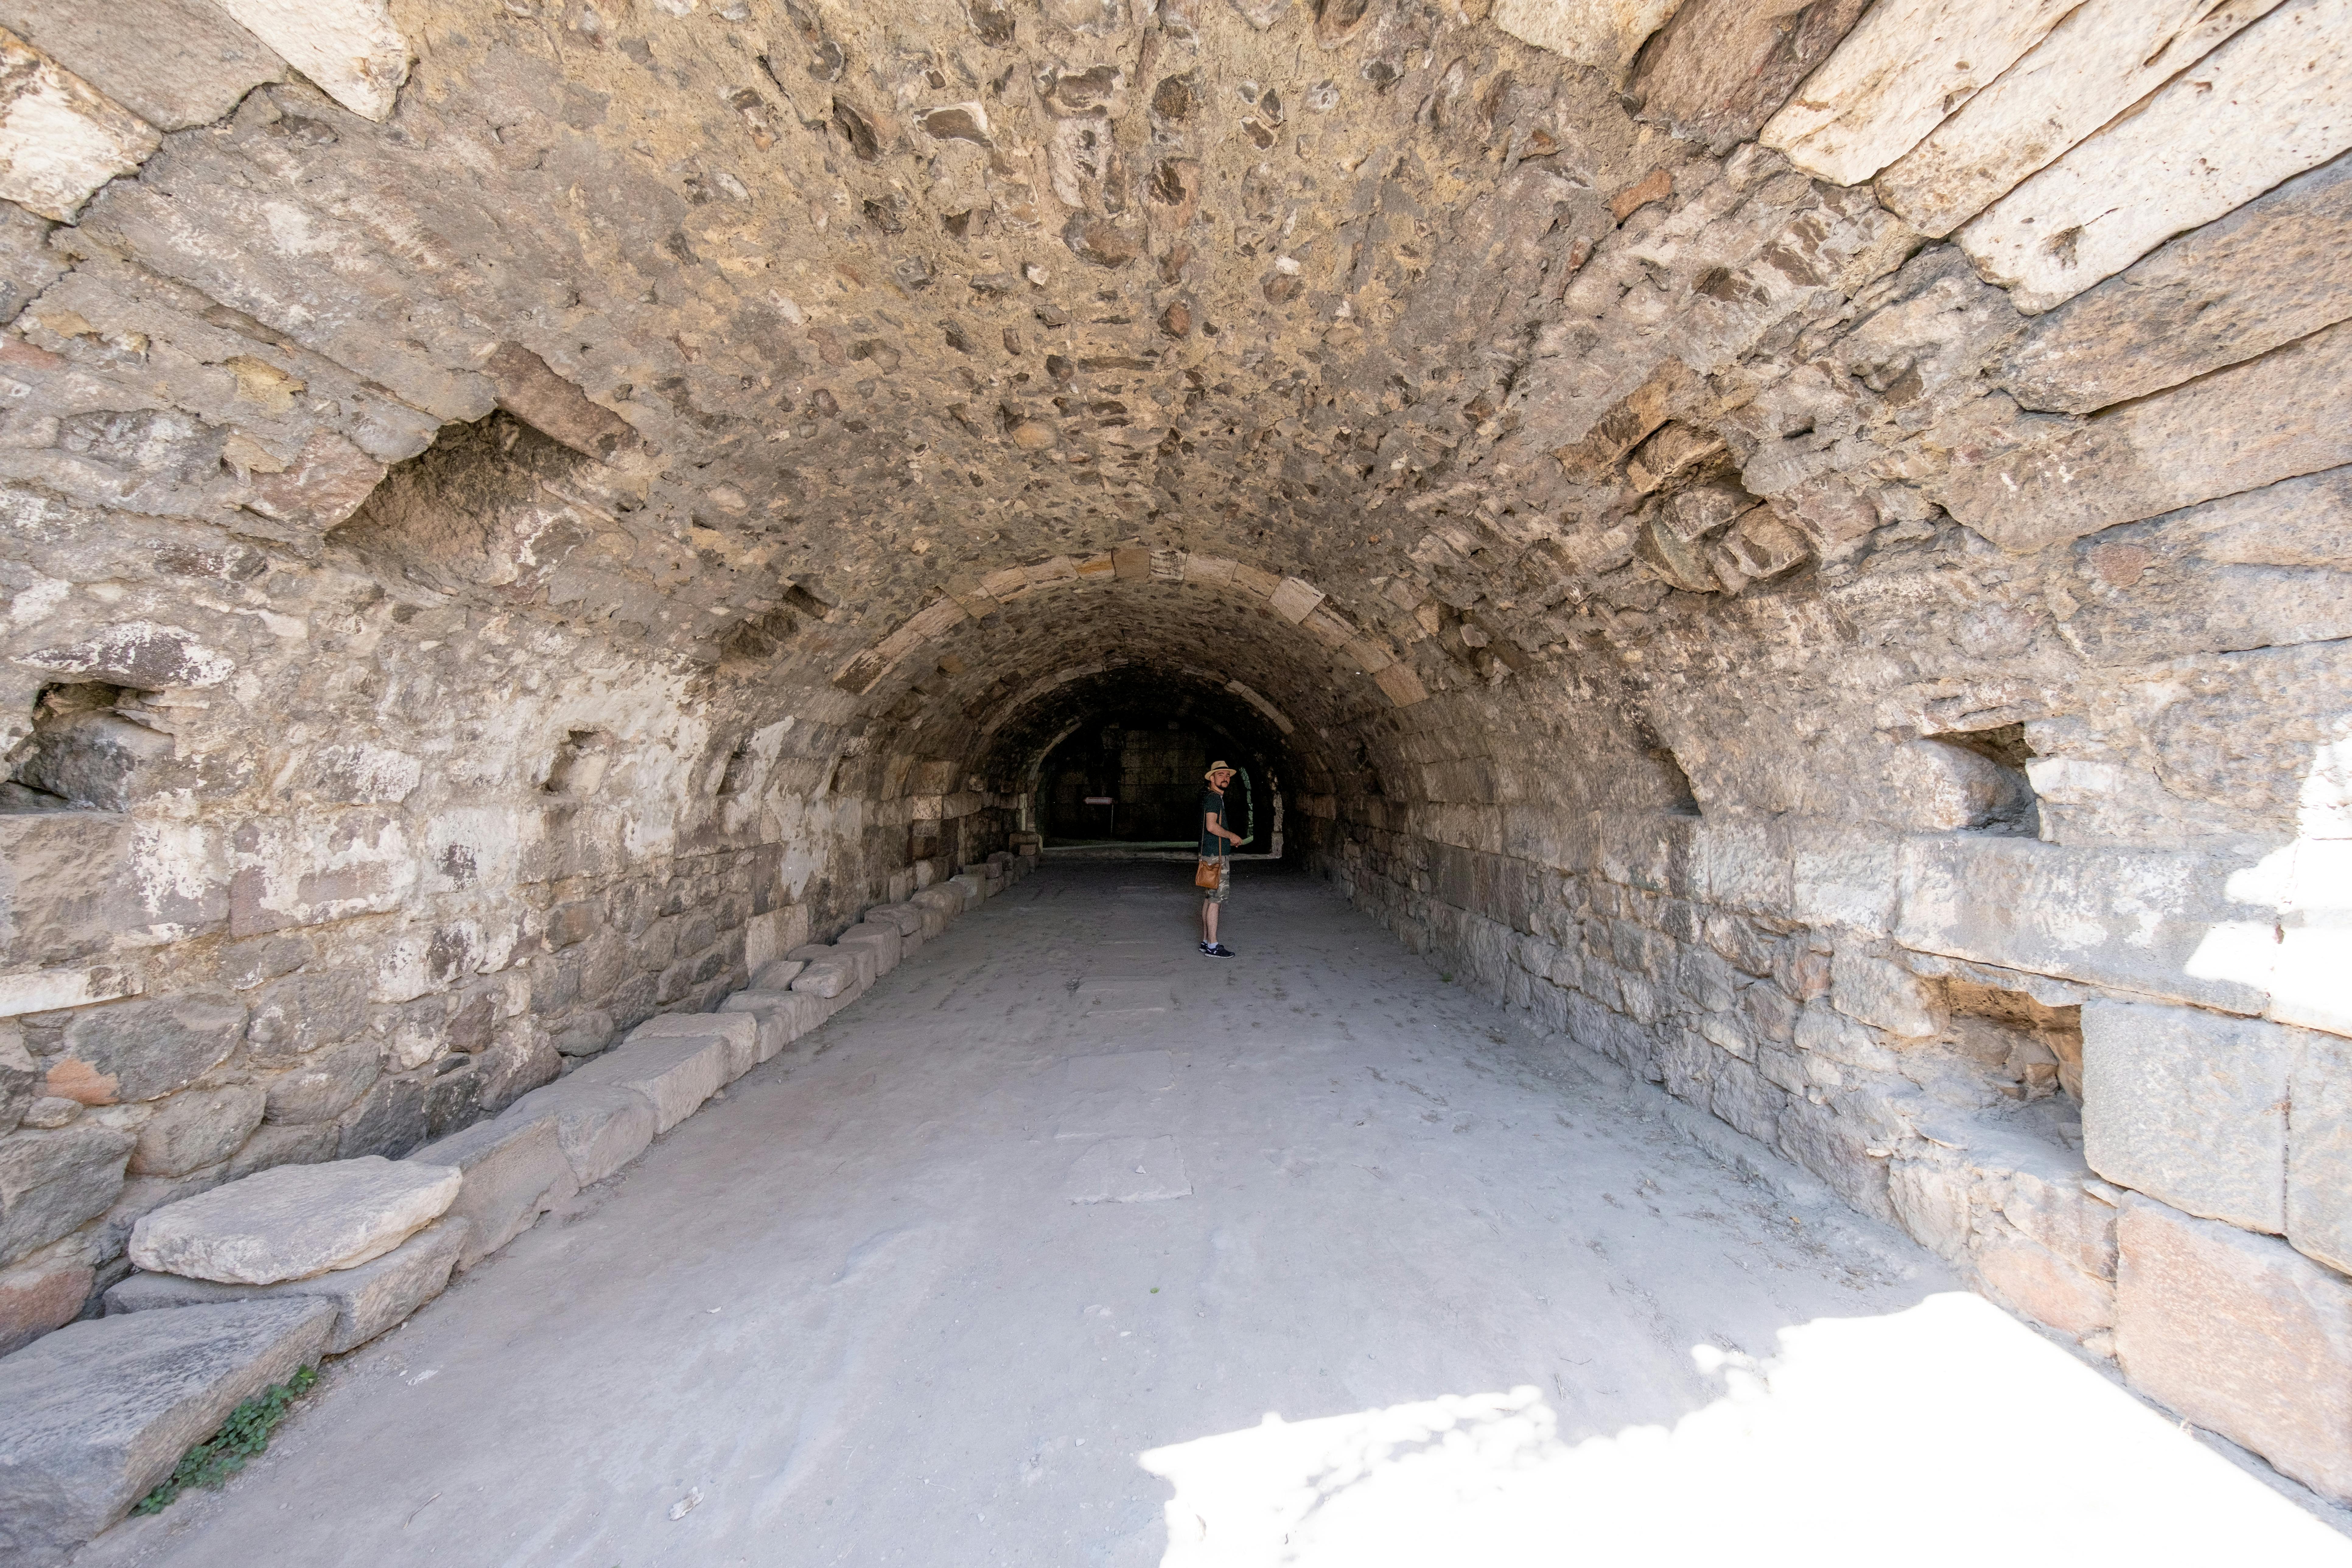
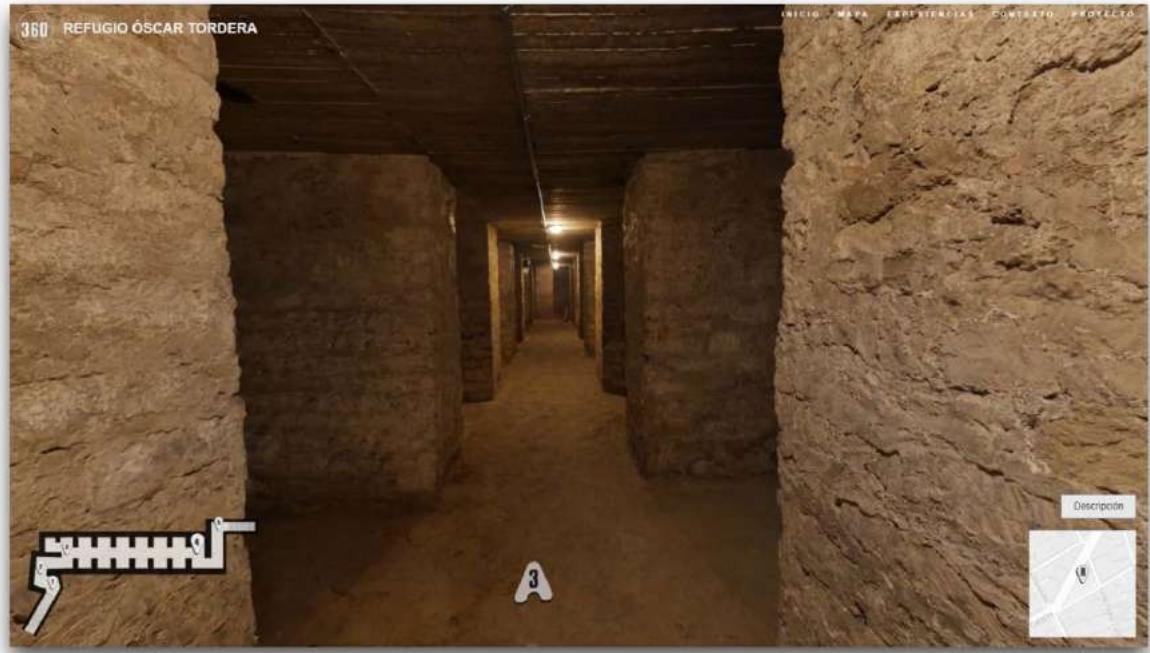 Figure 27: Shelters at Plaza Músico Óscar Tordera.
The relevance of this study is reinforced by the public's increasing interest in the Civil War shelters in Alicante, indicative of greater awareness of the city's turbulent past (Atabay et al., 2022; Laderman, 2009; Moore et al., 2007; Ratnam, 2018; P. Rosser, 2020a, 2020b; Wöhs et al., 2018).
Additionally, it examines how tourism development can coexist with cultural heritage conservation, facing the challenge of maintaining the authenticity and historical value of memory places while promoting their public accessibility (Moore et al., 2007; Ratnam, 2018; Rogério Amoêda, 2017; L. Smith, 2006; Stone, 2019). This balance is crucial for the design of effective tourism and heritage conservation policies.
Therefore, the findings of this study not only contribute to the academic understanding of cultural heritage management in urban contexts but also highlight the potential of the Civil War shelters in Alicante as educational and tourist tools, fostering responsible tourism that values educational historical memory (Carretero & Borrelli, 2008; Ciro Solorzano & CaroLopera, 2020; Ciego, n.d.; Craggs et al., n.d.; Gabriel et al., n.d.; Gutierrez, 2019; Martinez-Rodriguez et al., 2022; Movellan Haro, 2022; Pappier & Morras, 2008; Restrepo Valencia & Espinosa Ortega, 2023).
The quantitative methodology used in this study to evaluate the motivations and profiles of visitors is in harmony with previous research within the field of cultural and heritage tourism, which has demonstrated the usefulness of descriptive statistical techniques and correlation to reveal visitation trends and preferences at cultural interest sites (Richards, 2002; Prentice, 2003; Timothy & Boyd, 2006; Garrod & Fyall, 2000). Our statistical analysis seeks to deepen the understanding of the demographic dynamics of visitors and their behaviors, as well as the impact these have on the appreciation and recognition of cultural memory heritage.
Contrasting with certain previous research that limits itself to quantitative aspects, this study extends its gaze to qualitative analysis to explore more detailed personal experiences of visitors and their emotional connection with historical memory spaces. This comprehensive approach, blending quantitative and qualitative methodologies, is key to apprehending the richness of the interactions established between people and heritage spaces, as indicated by various studies employing this mixed approach.
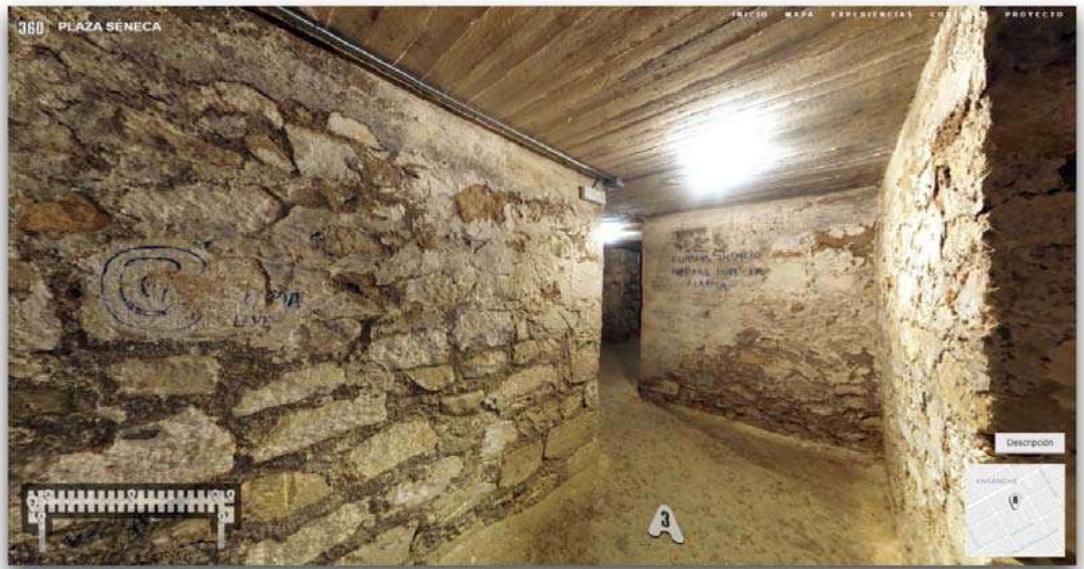
 Figure 28: Shelters at Plaza de Sénéca.
## V. CONCLUSION
This interdisciplinary study evaluates the impact of visits to the Civil War shelters in Alicante on cultural heritage awareness, combining tourism and heritage studies with a quantitative approach. Analyzing 407 visitors from August 2023 to January 2024, it highlights a positive reception and an increase in historical awareness, contributing to sustainable urban development and historical understanding.
The results confirmed the main hypothesis of a positive impact of the rehabilitation and opening of the shelters on cultural heritage, showing an increase in interest and awareness of their historical importance. The research revealed a varied demographic profile of visitors, highlighting patterns related to age, geographic origin, and visit modality, and offered insights into the motivations behind the visits.
Confirming a link between cultural and educational activities and an increase in visitors, the study underscores the need for management and communication strategies tailored to different audiences. This work not only provides empirical evidence of the positive impact of the shelters' rehabilitation on Alicante's cultural memory heritage but also emphasizes the importance of effective heritage management strategies, including the development of educational programs and cultural activities for diverse audiences, suggesting continued research on visit modalities and communication strategies to enrich the visitor experience and strengthen the understanding and valuation of cultural memory heritage.
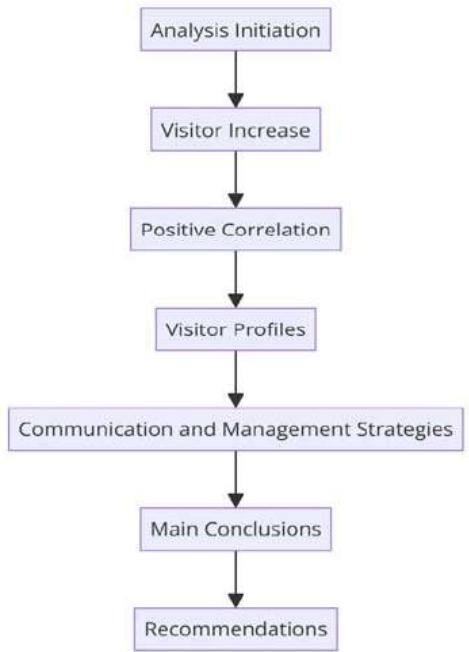 Figure 29: Hierarchical diagram of the conclusions.
The study's conclusion reveals an understanding of the impact of the rehabilitation of the Civil War shelters in Alicante on cultural heritage, highlighting an increase in interest and visits postopening. A positive relationship is identified between cultural and educational activities and the increase in visitors, along with variations in their profiles based on age, origin, and type of visit. This underscores the importance of adopting communication and management strategies tailored to different audiences, confirming the positive impact of the initiatives on heritage perception. The development of educational programs and cultural activities is recommended to enrich the visitor experience.
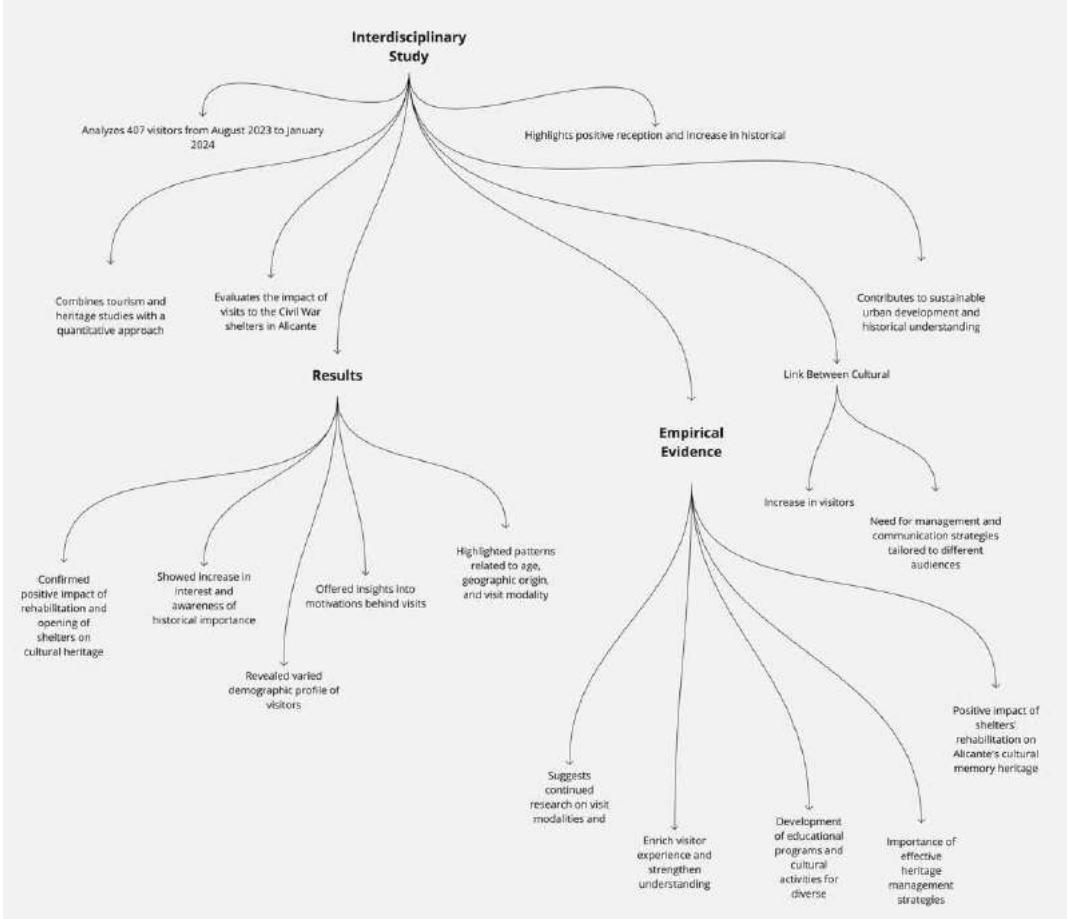 Figure 30: Sequence diagram of the conclusions.
### Funding Statement
This research received no specific grant from any funding agency in the public, commercial, or not-for-profit sectors.
Conflict of Interest Statement
The authors declare no conflicts of interest.
Ethics Statement
Surveys conducted in this study were anonymous, and informed consent was obtained from all participants prior to their participation.
Generating HTML Viewer...
References
30 Cites in Article
Virginia Arnet (2022). Rescuing industrial memory: the industrial heritage of Isla Teja sixty years after the natural disaster.
Zeynep Atabay,Alessandra Macedonio,Tarek Teba,Zeynep Unal (2022). Destruction, heritage and memory: post-conflict memorialisation for recovery and reconciliation.
Simon Barrie,Robert Bucat,Mark Buntine,Karen Burke Da Silva,Geoffrey Crisp,Adrian George,Ian Jamie,Scott Kable,Kieran Lim,Simon Pyke,Justin Read,Manjula Sharma,Alexandra Yeung (2015). Development, Evaluation and Use of a Student Experience Survey in Undergraduate Science Laboratories: The Advancing Science by Enhancing Learning in the Laboratory Student Laboratory Learning Experience Survey.
S Boyd,D Timothy (2002). Heritage Tourism.
Mario Carretero,Marcelo Borrelli (2008). Memorias recientes y pasados en conflicto: ¿cómo enseñar historia reciente en la escuela?.
Qian Cheng,Jingjing Guo,Supei Ling (2016). Fuzzy importance-performance analysis of visitor satisfaction for theme park: the case of Fantawild Adventure in Taiwan, China.
Luisa Ciro Solórzano,Miguel Caro-Lopera (2020). Tendencias de investigación en memoria histórica y sus desafíos pedagógicos en Latinoamérica.
Carolina Ardila Behar,Juan Hinestroza,John Vargas,Olga Behar Leiser (2024). Memoria histórica para la transformación social Lineamientos pedagógicos para la enseñanza de la memoria del conflicto armado colombiano..
T Craggs,R Armouries,A Mickiewiecz,I Poznan,P Eystein Ellingsen,S Arkivet,N King,C En Museos,R Rosa,M Rodriguez,F Ragazzi,F Soc,I Ruhaven,N Svetelj,B De Kranj,E Turchi Trabajando con la memoria histórica en el aula.
P Gabriel,J Murillo,G Formaph,(n.D Formación ciudadana y memoria histórica en la escuela hoy.
Damir Galaz-Mandakovic,Francisco Rivera (2023). The industrial heritage of two sacrifice zones and the geopolitics of memory in Northern Chile. The cases of Gatico and Ollagüe.
Rivoni Gounden,Suveshnee Munien,Dinolen Gounden,Ntwandamela Perry (2020). Visitor Profiles of Coastal and Marine Tourism Sites in the Eastern Cape, South Africa.
Enrique Gutiérrez (2019). La memoria histórica, la gran olvidada en la escuela.
Scott Laderman (2009). Tours of Vietnam.
Anna Leask,Alan Fyall (2006). Managing World Heritage Sites.
Lan Luo,Yongkang Cao (2023). The museum method of reusing Shanghai waterfront industrial heritage: continuation and reconstruction of urban memory.
R Martínez-Rodríguez,M Sánchez-Agustí,C Muñoz-Labraña (2022). Enseñar un pasado controvertido desde un presente polarizado: la memoria histórica en España desde la perspectiva docente.
B Mckercher,H Du Cros (2012). Cultural tourism: The partnership between tourism and cultural heritage management.
N Moore,Y Whelan,L Bullard,K Beiter (2007). Heritage, Memory and the Politics of Identity: New Perspectives on the Cultural Landscape.
Movellán Haro,J (2022). Reseña de "Memoria histórica y enseñanza de la Historia.
T Nesbitt (2013). Finding its place.
Viviana Pappier,Valeria Morras (2008). La Construcción de la Memoria en la Escuela. Una Mirada a los Actores y Conflictos que Genera la Conmemoración del 24 de Marzo.
Charishma Ratnam (2018). Creating home: Intersections of memory and identity.
Restrepo Valencia,M Espinosa Ortega,A (2023). Construcción de paz y memoria histórica desde la escuela: un recorrido histórico.
(2013). The Routledge Handbook of Cultural Tourism.
K Rodgers,A Graham,S Murphy,A Tripler,K Scidmore-Rossing (2023). Assessing carrying capacity using demographics, visitor experience and field studies: the case of Hanauma Bay Nature Preserve.
(2017). Proceedings of the 3rd International Conference on Preservation, Maintenance and Rehabilitation of Historical Buildings and Structures.
Pablo Rosser,Seila Soler (2024). From Oblivion to Life: The Recovery of Intangible Cultural Heritage through the Anti-Aircraft Shelters of the Spanish Civil War.
P Rosser (2020). El concepto de memoria y la memoria en Alicante.
No ethics committee approval was required for this article type.
Data Availability
Not applicable for this article.
How to Cite This Article
Pablo Rosser . 2026. \u201cTo Understand the Desires and Characteristics of Visitors: A Quantitative Journey\u201d. Global Journal of Human-Social Science - D: History, Archaeology & Anthropology GJHSS-D Volume 24 (GJHSS Volume 24 Issue D1): .
Explore published articles in an immersive Augmented Reality environment. Our platform converts research papers into interactive 3D books, allowing readers to view and interact with content using AR and VR compatible devices.
Your published article is automatically converted into a realistic 3D book. Flip through pages and read research papers in a more engaging and interactive format.
This interdisciplinary quantitative study examines the influence of visits to Civil War shelters in Alicante on the perception of memory-based cultural heritage within an urban context. Through the analysis of 407 visitors from August 2023 to January 2024, it investigates how the rehabilitation and opening of these spaces contribute to sustainable urban development and historical understanding. Preliminary results show an increase in interest and awareness of the historical importance of the shelters, indicating a positive impact on the valuation of memory heritage. The study highlights the correlation between the provision of cultural and educational activities and the increase in visitors, underscoring the need for differentiated communication and management strategies to attract diverse visitor profiles. This analysis provides key insights for the management of cultural heritage and suggests improved approaches for the promotion of historical legacy.
Our website is actively being updated, and changes may occur frequently. Please clear your browser cache if needed. For feedback or error reporting, please email [email protected]
Thank you for connecting with us. We will respond to you shortly.