## I. INTRODUCTION
For a developing country such as India, where the growth potential is high and the scope for poverty reduction is also significant; a policy that lifts the poor out of poverty by expanding the overall pie is preferable because redistribution is only feasible if the size of the economic pie grows rapidly. Therefore, achieving economic growth requires the government to adopt different types of policies such as promoting savings, stimulating investment, and increasing internal production (Rasmidatta, 2011).
Present piece of the study is an endeavor to find out the volume of gap between savings-investments in India and ways to reduce it up to zero size so that not only the burden of interest payment could be done away with, simultaneously growth process can be made sustainable in the long -run without sacrificing our sovereignty to external world. In a nutshell, growth process must be inner-engineered as the growth of individual. Decoupling or complete detachment from external world is essential for lasting happiness (Bhagwad Geeta) or welfare both for the individual and the economy.
Gyadda saherat cheay karmi iiv saaban n direyaagia Aatmane I tadaa vimukut: s: praj: sa: rtht: gere r yit "When he withdraws all his senses from their objects, as the tortoise withdraws its limbs into its shell, then he is said to be possessed of wisdom, and is tranquil in his mind."
## II. REVIEW OF LITERATURE
### a) Theoretical Perspective
'Saving' this word was clarified by J.M. KEYNES (1936) as the excess of income over what is spent on consumption. Since he was concerned with wartime economies with urgent need to their revival; therefore, he advocated savings to be channelized into autonomous investment by the Governments in order to boost up demand by redistributing the income in the hands for generating the secondary and tertiary wave of income. According to him, savings are bane at the macro level while boon at the micro-level. Hence, investments must be equal to savings.
Post-Keynesian economist Harold and Do mar emphasized on savings to keep the growth momentum unchecked. According to them, even a little imbalance in ex-ante and ex-post savings can lead to cumulative inflationary or deflationary economic situation. Neoclassical economists pulled up little pressure on economic growth rate by saying that savings can be adjusted up-to a specific range by bringing a change in incremental capital -output ratio.
### b) Published -Research
Ismet GROCER, Tugba AKIN and Sedat ALATAS conducted the study, "The effects of saving-investment gap on economic growth in developing countries: A clustering and panel data analysis" using a sample of 65 developing countries for 1981-2014 period. Firstly, these countries were categorized into subgroups according to their saving-investment gap data by using clustering analysis. Then, panel unit root were performed for each cluster and overall panel, and panel coefficients were estimated. In conclusion; it was determined that while the effect of saving on economic growth is positive and statistically significant in developing countries which have savings overinvestment, this effect is negative and statistically insignificant in developing countries which have investment over savings. It was considered that this study will bring novelty to literature since it combined panel data analysis and clustering analysis together.
Mohsen Brahmani-Oskooee, Scott W. Hegerty and Harvey Wilmeth in his paper, introduce the "saving-investment" gap, which measures whether the need for financing is unmet, as another determinant of income inequality. They then apply time-series techniques in a study of 16 countries. Using the "bounds testing" cointegration method, in which variables in a given model can be stationary, non-stationary, or a combination of the two, They found varying results across countries. While these results highlight the need for further country-specific research, they indicate the benefits that external financing can provide.
Aytül Ganioglu and Cihan Yalçın (2015) finds that Standard neoclassical growth models assume that foreign savings are perfect substitutes of domestic savings in financing domestic capital, thus growth rate is independent of domestic savings rates. However, these models fail to explain the divergence of growth rates between East Asian countries with higher domestic saving rates and other emerging economies. This study forwards the view that saving-investment gaps, if not domestic savings themselves, may explain to some extent the divergence of growth rates among those countries. They adopted the methodology of Aizenman et al. (2007) in calculating cumulative saving-investment gaps of 46 countries for the period of 1993-2010. Empirical analysis suggests that increasing the fraction of domestic savings in the financing of domestic capital, i.e. a rise in self-financing ratios, contributes to growth performance of countries. This finding is more pronounced for low-middle income countries and/or countries with lower self-financing ratios.
Assandé Désiré Adom, Nasr G. Elbahnasawy (2014): It is a challenge for most developing countries, especially in Africa, to mobilize domestically enough capital to meet their extensive investment needs because of two main reasons: the undeveloped nature of their financial system and the low rate of access of households to basic financial products. This study analyzes the impacts of persistent savings (S)-investment (I) gaps on economic growth using a sample of 5 developing countries in Africa - Egypt, Côte d'lvoire, Ghana, Kenya and Nigeria. The methodology of this study is based on a Ramsey model within a general equilibrium framework, where consumption and savings are the determinant factors in a typical household's utility function. Calibrations and simulations indicate significant gaps between optimal and actual levels of savings and investment. Furthermore, the findings point out that these gaps are associated with relatively lower growth rates of actual output compared to simulated output, with the notable, but limited, exception to Nigeria until 2019. It accordingly becomes appropriate to suggest policies addressing both the structural and non-structural factors that limit the ability of these developing countries to effectively bolster households' deposits.
Sandri (2010) examines 62 episodes of growth spurts from 1960 to 2011 among non-OECD countries and shows that productivity growth across these episodes is combined with not only a rapidly rising investment rate but an even more steeply increasing savings rate. Carroll and Weil (1994), Attansio, Picci and Scorcu (2000) and Rodrik (2000) show that savings and growth are not only positively correlated but their positive correlation is even stronger than that between growth and investment. For a country such as India with an extremely young population, the role of demographics in fostering savings becomes crucial to understand possible crowding out due to government spending. Bosworth and Chowdorow-Reich (2007) show for Asia that both savings and investment rise with the proportion of the working population. Curtis, Luguaer and Mark (2011) find that jobs that pay meaningful wages drive savings rate in the economy. Lee, Mason and Miller (2000) and Bloom et al. (2007) show that savings increases as average life expectancy increases in a country. Thus, in an economy operating below full capacity, the supply of savings may grow from greater government spending through demand creation and thereby greater employment. This is because, as highlighted by recent research, favorable demographics – in the form of a large population of working age – would enhance savings through meaningful jobs.
## III. INVESTMENT-GROWTH NEXUS
Throughout the post-independence period, India has managed to maintain domestic saving and investment rates well above that of many other developing countries—not only those in a low-income category but also most of the middle-income countries in Latin America. However, in terms of growth performance, until the 1990s India remained a typical low-income country, with an average growth rate of around 3 percent. This incompatibility between saving/investment behavior and growth performance can be explained in terms of the nature of overall development policy stance. In the first three decades of the post-independence period and well into the 1980s, a highly interventionist trade and industry policy regime constrained the potential growth effect of domestic investment. Thus, investment levels, maintained through macroeconomic stability and financial deepening simply enabled India merely to keep its head above water.
Liberalization reforms since 1991 have set the stage for transforming the investment-growth nexus by lifting import restrictions and dismantling India's industrial "license raj," thus lowering the relative price of capital goods, leading to more investment and the replacement of outdated machinery.
### a) Saving and Crowding-out of Investment
The argument supporting higher debt leading to lower growth is as follows: higher levels of public debt are accompanied by more taxes in the future to pay for the debt, thereby, leading to lower lifetime - wealth, which may decrease consumption and savings, eventually, resulting in lower aggregate demand and growth rates. If higher public-debt (i.e. lower public-savings) is not accompanied by increase in private savings, it may also lead to lower total savings in the economy. This may put upward pressure on the interest rates, resulting in crowding out of private investment and thus, negatively impacting the growth rates. On the other hand, higher GDP growth leads to lower public -debt through the increase in the denominator, i.e. GDP.
Consistent with these arguments for crowding out, studies find no evidence of crowding out of private investment due to public investment in developing economies. Erden and Holcombe (2005) analyze the public and private investment in developing and developed economies, and conclude that while public investment is complementary to private investment in developing countries, the opposite holds for developed countries. Eisner (1994) argues that whether an increase in Government expenditure for goods and services 'crowds out' domestic private investment, may depend upon how close the economy is to full employment. BAHAL et al. (2015) find no evidence of crowding out in India over the period 1980-2012.
Recent research puts further doubt on the phenomenon of crowding out in rapidly growing economies by showing that the supply of savings is not fixed, but expands. (Economic Survey 2020-21 Volume 1 Income Growth).
Dilemma which should come first, saving or income growth? If economy is in the beginning or carved out has to borrow but when became as old as 75 years it needs a strong saving pattern across individuals.
## IV. GLOBAL SCENARIO OF DOMESTIC SAVINGS (1990-2020)
In the early 1960s independent India's saving rate (around 16 percent) was much higher than that of Korea, Taiwan, and Singapore, but from the early 1970s India's saving performance fell behind that of all these high-performing East Asian economies; by the mid-1990s, India's saving rate of 22 percent amounted only to a little over half their average rate. However, India's saving rate remained impressive by comparison to all other South Asian countries.
Global Scenario of Domestic Savings (1990-2020)
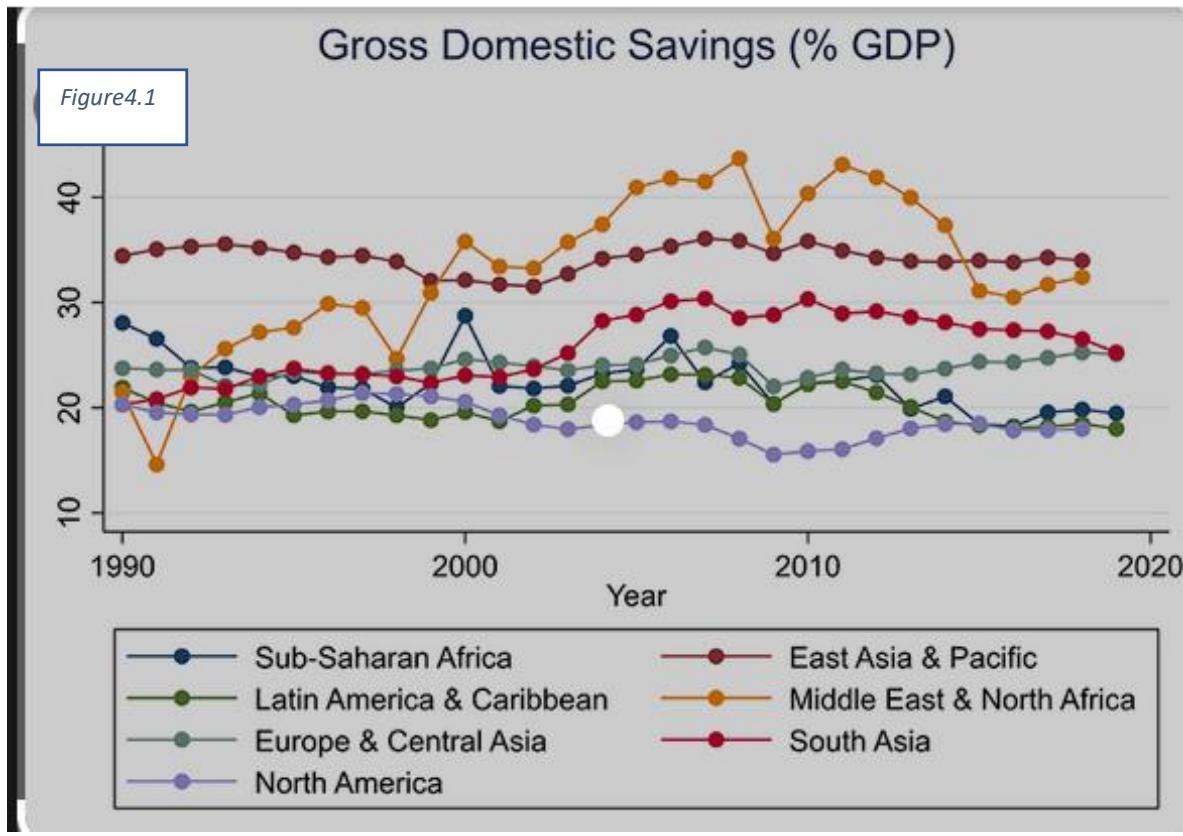 Figure 4.1: Gross Domestic Savings (% of GDP) across Groups Source: https://www.encyclopedia.com/saving-and-investment-trends-1950 (fig.4.1)
Differences in saving performance between India and the East Asian high-performing countries is a reflection of differences in overall growth performance. India's success in providing an economic setting conducive to domestic saving and financial deepening is in some measure thanks to the nominal interest rate India has maintained, an administered price, changed only infrequently based on budgetary considerations. Unlike many other developing countries, India has not seen adverse movements in real deposit rates, thanks to the long-standing official commitment to an anti-inflationary macroeconomic policy. Thus, the incentive for saving has remained positive. Perhaps more important, the rapid spread of banking facilities, following the nationalization of commercial banks in 1969, played a pivotal role in increasing private financial saving. Bank density (population per bank branch) declined persistently from over 90,000 in the mid-1950s to around 14,000 in the mid-1990s.
(Composition of Saving in India Pre-liberalization and Decade after)
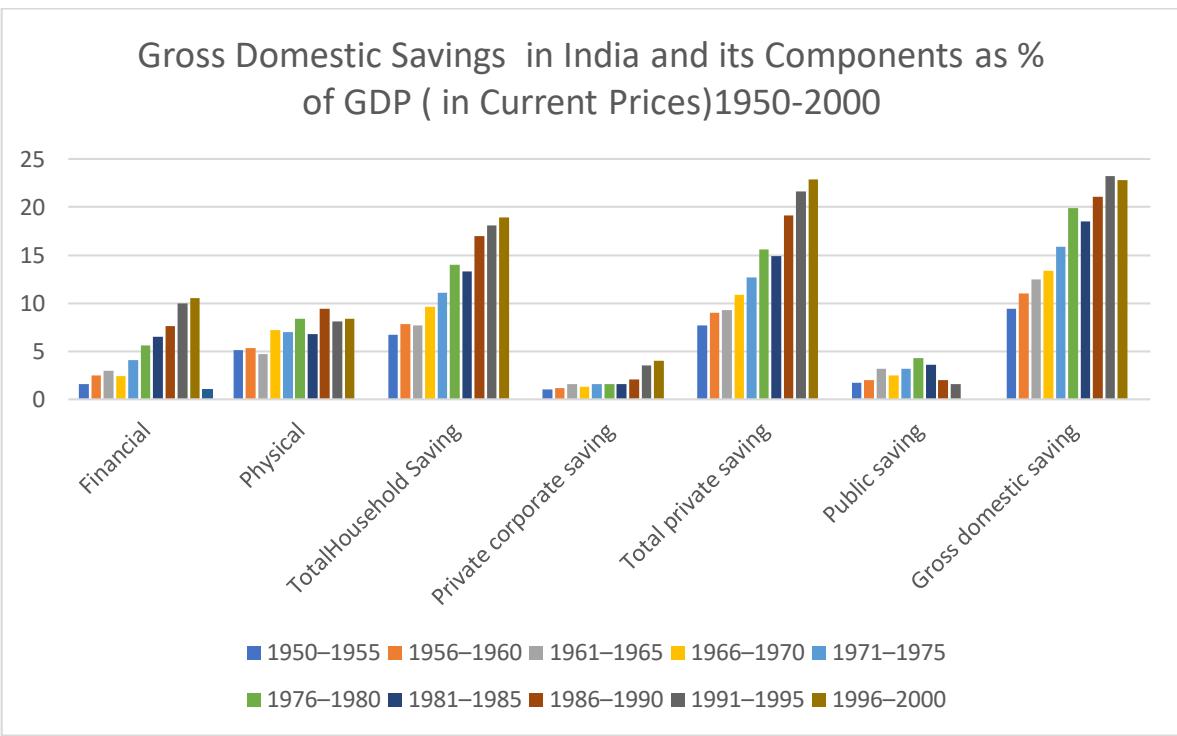 Figure 4.2 Source: Compiled from Economic and Political Weekly Research Foundation, National Accounts Statistics of India, 1950-51 to 2000-01. (Fig.4.2) In the post liberalization era (1986-2000) gross domestic saving of India has reached well above $20\%$ of GDP showing that India has taken off as far as stages of economic growth (Rostove) are concerned.
## V. INVESTMENT AND GROWTH
Domestic investment in India has been predominantly financed through domestic saving. Foreign capital inflows accounted for less than 1 percent of GDP. India has been a significant recipient of foreign aid, but total aid flows have remained negligible relative to the size of the economy. The role of foreign direct investment and other forms of private capital, portfolio investment, and bank-related flows has been even less important, reflecting the Indian government's unwillingness to invite foreign investment uncritically as well as the highly restrictive capital account regime. The saving-investment nexus has not undergone noticeable change, even after the reforms of 1991. The time pattern of the domestic investment rate has virtually mirrored that of the saving rate during the entire period.
The relative contributions of the public and private sectors to gross domestic capital formation have changed considerably from the early 1950s to the early 1980s. Public investment, which increased from about 30 percent to 50 percent, accounted for much of the total increase in investment. However, the rise in the investment rate after the mid-1980s can be attributed primarily to the increase in private investment. Private investment since the 1990s has mostly come from private corporate investment. The share of corporate investment in total private investment increased to over 45 percent in the 1990s. Relative to GDP, private corporate investment increased from 4.3 percent in the second half of the 1980s to 7.1 percent by the mid-1990s. (Household investment, on the other hand, fell from 9.3 percent of GDP to 8.5 percent.) Market-oriented reforms since 1991 have begun to play an important role in promoting corporate investment, reflecting the declining cost of capital brought about by import liberalization and favorable changes in investor perception.
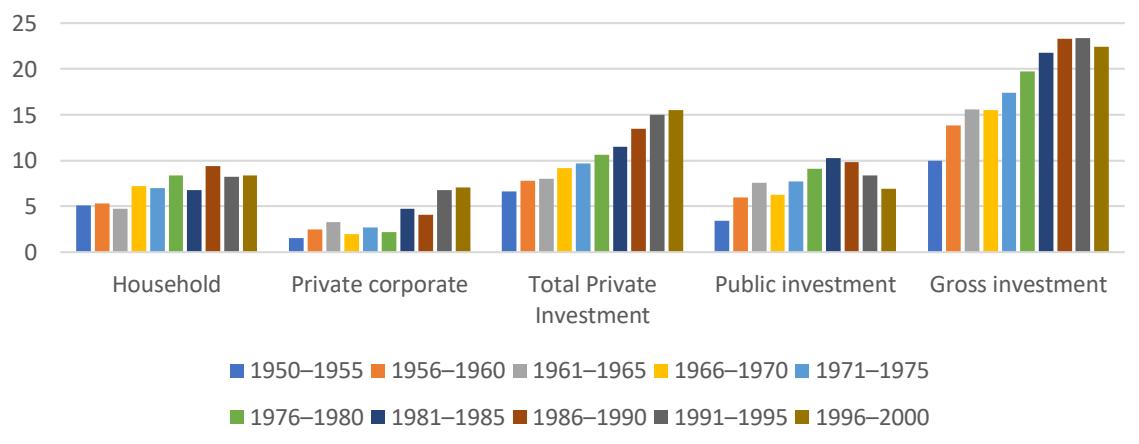 Fig.5.1 Gross Domestic Investment in India and it's Components as% of GDP(current market prices) Source: Compiled from Economic and Political Weekly Research Foundation, National Accounts Statistics of India, 1950-51 to 2000-01. (Fig.5.1)
Figure 5.1: Gross Domestic Investment in India and its Components as% of GDP (current market prices)
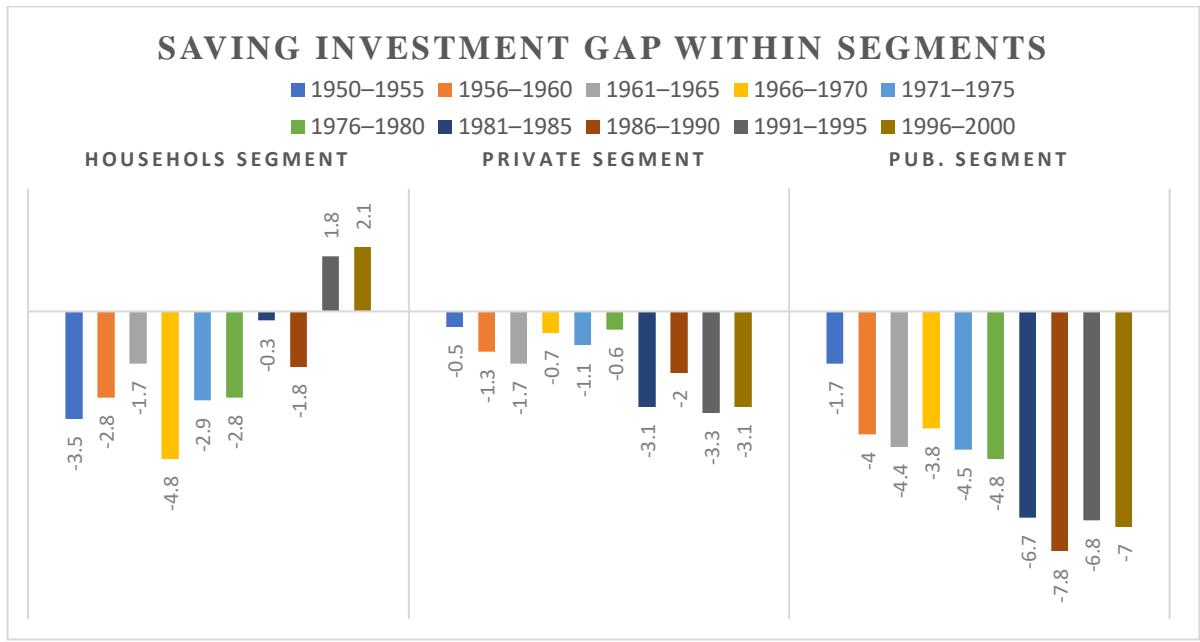 Figure 5.2: Saving -Investment Gap within Segments (1950-2000) Source: Derived from above Figures 4.2 & 5.1 (Fig.5.2)
The figure: (above) 5.2 gives a sharp picture of the gap between saving and investment within segments. As is well known, that period prior to 1991 is remarked as planned era in the economic history of India, with heavy reliant on public sector investment for infrastructural as well human resource development. Indian economy was characterized as mixed economy following three schedules for industrial investment viz. public-sector, private-sector and joint - sector. Since concentration was biased towards public-sector industries which were over-staffed, with inflated cost structure, excessively high capital - output ratio and undue delay in project clearance: this sector staggered with high deficit and monetary authorities were forced to opt path of deficit -financing and heavy reliant on external borrowings. Deficit financing always proved inflation prone due to infrastructural bottlenecks prevalent in the economy; this further led to high public -debt burden. Indian currency devalued several times to keep export competitiveness, since, our export and
imports items both were relatively inelastic in nature; led to high current account deficit.
Faced with the highest inflation, external-debt and lowest foreign reserves which could fulfill only 6 months import requirements, the Govt. of India was bound to open its economic frontier for foreign - investors and move towards more privatization was started.
Above figure clearly shows from 1990 only, i.e. after gradual liberalization of the economy, some surplus in household segment was visualized, other two private and public-segments were excessively reliant on public and external borrowings due to high -investment and negative savings within and across segments up-to minus 20.2 and households savings could finance mere $3.9\%$ of this deficit in savings, so net saving - investment gap remained $17.7\%$ of GDP. After 30 years of liberalization, the scenario has totally changed. Overall saving investment gap has almost disappeared and excessive reliance on foreign borrowing has diminished.
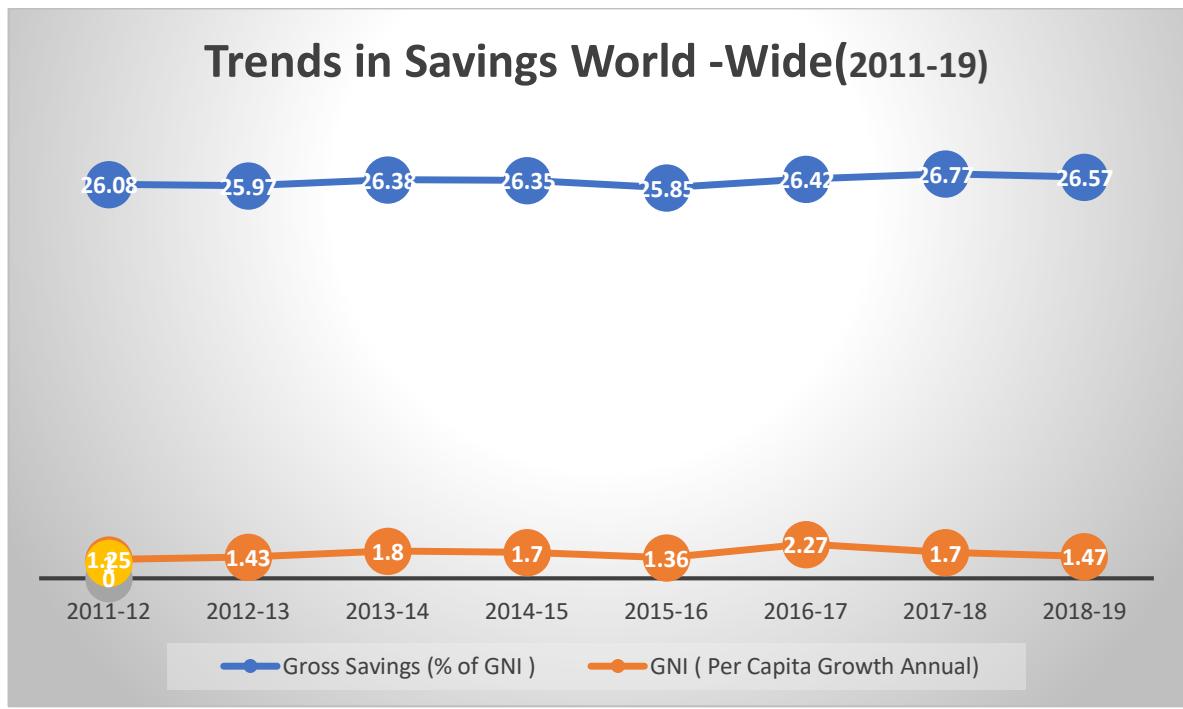 Figure 5.3: Trends in Savings World-Wide (2011-19) Source: World-Bank National Account and OECD Account Data Files Gross Saving: difference between GNI per Capita and Consumption (Pvt+Pub) + Net Transfers (Fig.4.3)
The above figure (5.3) clearly establishes strong positive relationship between annual growth rate of per-capita income and growth in gross -savings world-wide.
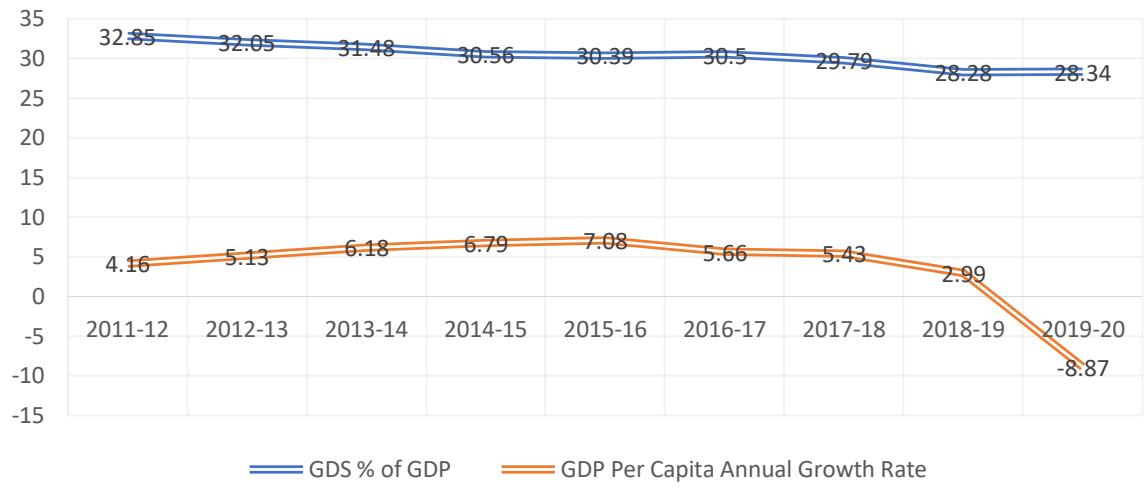 Figure:5.4 Trends in National Savings (2011-20)
Source: World-Bank National Account and OECD Account Data Files Gross Saving: difference between GNI per Capita and Consumption (Pvt+Pub) + Net Transfers (Fig.5.4)
Figure 5.4: Trends in National Savings (2011-20)
Figure (5.4) paints a little different picture in India's case; while per-capita income has grown throughout the period between 2011-12 to 2015-16 but showed a declining trend afterward till 2019-20, gross savings as percent of GDP has declined consistently according to World-Bank estimates. This structural change in income growth and saving rate may be partly attributed to rising inflation which has deeply eroded households' savings and income redistribution has turned its face towards private-corporate sector, that's why figure (5.5 below) shows size of orange bars on rise or insignificantly down.
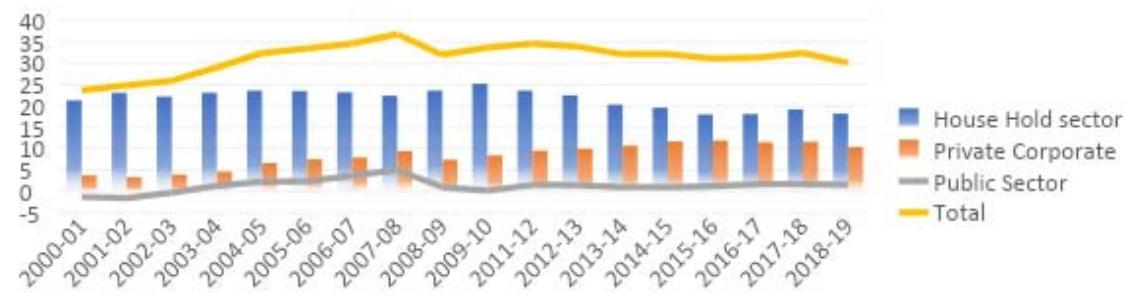 Figure:5.5 composition of Gross Domestic savings Figure 5.5: Composition of Gross Domestic Saving (Vertical)
Deeply watching the above figure (5.5.) it can be generalized that private sectors' saving rates are continuously on rise in post-liberalization period from 2000-2019 with little fluctuations in near Covid-year i.e.
after touching high to $11.9\%$ in 2015-16 it dropped slightly to $10.4\%$ in 2018-19.
Public sector's saving rate after reaching to the peak of $5\%$ in 2007- 08 faced a sharp decline in 2018- 19 and touched to $1.5\%$ of GDP but certainly recovered from deficit in savings in the beginning of the second decade of liberalization.
As far as households' sector is concerned its saving rates have drastically improved; reaching to the peak of $25.2\%$ in 2009-10 and remained above $20\%$ of GDP till 2013-14 since then substantial declining trend is being perceived i.e. there is a gradual shift in saving pattern from financial towards investment in fixed assets or in jewelry.
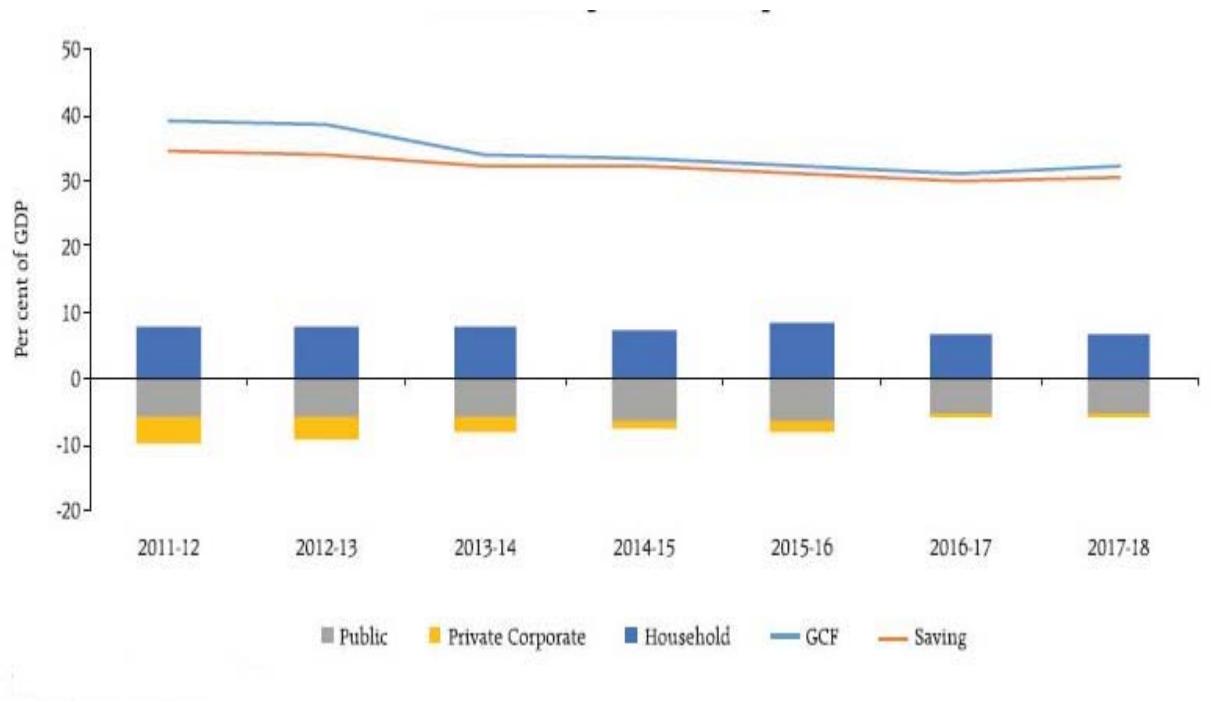 Figure 5.6: Savings and Investment Gap Horizontal and Vertical (2011-18) Source: Central Statistics Office.
Figure (5.6) depicts the actual saving-investment gap within the 3 saving-sectors of economy from 2011-12 to 2017-18; as can be seen, Indian households have become self-sufficient in financing their investment needs by cross movement of monetary resources through banks. That's why every time there is a phone call asking for the top-up requirement of existing loans, heavily advertising their (banks) loan-policies for purchase vehicles, homes, accessories moreover emerging middle class has started acquiring personal loans even to finance unproductive expenditure like marriage parties. One reason can be attributed to this self-sufficiency of households' sector is rising salary and wages after implementation of VII pay commission's recommendations.
Very plausible fact can be observed that the private corporate sector is reaching to near self-sufficiency (yellow area diminishing) in terms of its heavy investment requirements. That means although, this sector is profit-oriented and major driver of inflationary cycles in the economy; will not suffer from crowding -out of financial resources: and more funds shall be available for investing in public-welfare policies and creating (as well as maintenance) public-infrastructure which is of wide-range and extra-large.
Public Sector is under heavy-strain as far as saving - investment gap is concerned; since prevalence of a vast-population under poverty and unemployment together with continuously expanding population will never leave this sector under-invested and nonchalant towards public -welfare measures.
In this milieu role of household sector's savings becomes crucial not only to finance their own personal needs but to channelize resources even for private - corporate and public-sector for keeping and adding future comforts not for themselves but also for next-generations hence crowding-out of scarce monetary resources within the households' sector should also be kept in check to not let go interest -rates on loans very high and unaffordable. Because just like there is need to widen the tax-net to have more resources for public funding without putting much pressure on regular taxpayers; also there is, equivalent, urgent need to keep check on this practice of financing unproductive expenses until entire population do not satisfy their housing and comfort needs.
The rate of gross capital formation improved nearly to 36.3 percent of GDP in 2017-18 from 35.2 percent in the previous year (Figure: 5.6.), mainly due to higher investment by private financial corporations and general government sector. The investment rate has fallen sharply over the years from a high of 39.7 per cent in 2011-12, primarily due to fall in investment by households.
The saving-investment gap for the economy has come down over the years, thereby highlighting stronger macroeconomic fundamentals. The household sector remained the net supplier of funds to the private corporate and public sectors. However, in recent years, the private corporate sector's saving-investment gap has almost closed and most of its investment is financed through own saving, indicating a falling appetite for fresh investment. The public-sector drawdown on private savings (i.e., the saving investment gap), remained elevated.
In relation to growth, besides quantity of investment, what equally matters is the quality or the productivity of investment. The standard measure of productivity of investment is the incremental capital - output ratio (ICOR) which implies capital required to produce an additional unit of output. Productivity of investment has notably improved during the last five years when the average ICOR was 4.6 compared to the previous quinquennium (2009-10 to 2013-14) when ICOR averaged 5.9. Although yearly movement in ICOR has been volatile, it displayed an increasing trend from 2016-17 onwards. However, Government initiatives on affordable housing, rural infrastructure and roads are expected to boost productivity of investment going forward.
Households Fianacial Savings (2018-21)
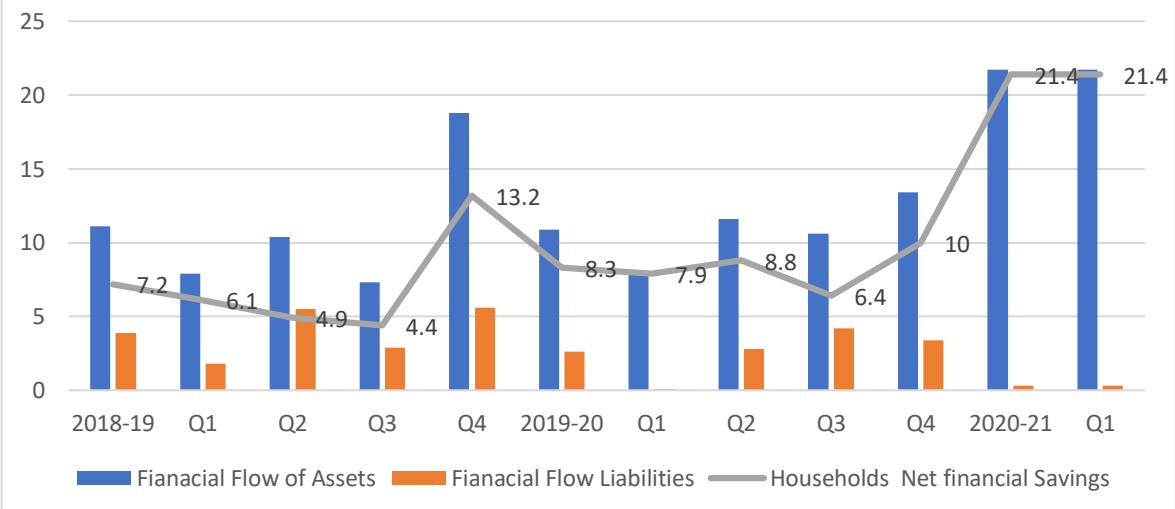 Figure 5.7: (Households Financial Savings in India (2018-21) Source: RBI Bulletin 2020 (Fig.5.7)
Estimates presented in this figure (5.7) show a jump in household financial savings to 21.4 percent of GDP in Q1:2020-21, up from 7.9 percent in Q1 and 10.0 percent in Q4 of 2019-20.
It is likely that the propensity of households to save may have risen markedly during the pandemic on two counts. First, the households would have been forced to save more, being unable to consume up to their normal levels. The household consumption basket would have comprised a limited number of items relative to the pre-COVID period. Second, they may have raised their precautionary savings due to uncertainty about their future incomes, in large part flowing from cautious responses to reports of actual and potential job losses (RBI Bulletin 2020).
## VI. MEASURES TO CHANNELIZE UNTAPPED POTENTIAL OF RURAL SAVINGS
Although, since 2017-18 private corporate sector has been almost self-dependent with regard to generation of investible financial resources from their own class and pub-sector borrowing needs can be well met by households financial savings, but situation should not be as gross saving is equal to gross capital formation rather it should be kept on increasing in order to meet growing demand for investment by the government for touching to higher levels of development and bringing technological changes.
In this context, the present piece of study has been taken to explore the nature of saving behavior, and it's relativity with other parameters such as literacy level, age, nature of job etc. So as to affect their saving behavior in future for mobilization of more financial resources not only for their own economic security but also for the prosperity of the nation as a whole.
### a) Model Specification
The objective of the study is to analysis rural household saving with respect to the characteristics of the household. The multiple linear regressions' method is used to study the relationship between a dependent variable and one or more independent variables. The generic form of the linear regression model id (Green, 2003).
$$
Y = f (X 1, X 2, X 3, X 4 \dots \dots \dots X k) + \varepsilon
$$
Where,
$$
Y = Dependent Variable
$$
$$
Xi = Independent Variables i = 1,2,3....k
$$
$\varepsilon =$ Disturbance
The analysis was based upon the absolute income hypothesis. The model is based upon Keynesian theory, which relates household saving behavior with household income and other social-economic variables (Qian, 1988).
$$
S = a + \beta 1 Y + Z + u i
$$
Where -
S = Saving Y = Income Z = Other Socio-Economic Variables than Income
Further -
$$
Z = \alpha + \beta 1 (\text{ATTR} _ {-} \text{AVG}) + \beta 2 (\text{AVRG} _ {-} \text{QLT}) + \beta 3 (\text{AVRG} _ {-} \text{AWR}) + u i
$$
Thus:
$$
S \left(A V G _ {A} S A V _ {B} H V\right) = a + \beta 1 \left(A T T R _ {A} V G\right) + \beta 2 \left(A V R G _ {Q L T}\right) + \beta 3 \left(A V R G _ {A W R}\right) + u i
$$
OR
$$
S (V4) = \alpha + \beta_1 (V1) + \beta_2 (V2) + \beta_3 (V3) + u_i
$$
$$
Predicted (Saving Behavior) = 2.327 - (0.006) ATTR_AVG - (0.094) AVR_GQT + (0.187) AVR_AWR + ui
$$
The study has analyzed the major determinants of rural saving behavior using cross-sectional blocks level multiple regression; assuming rural saving per household as independent variable. The analysis is confined to four village in USN i.e. Jaspur, Bazpur, Kashipur and Kichha. (Agrawal, 2022)
### b) Research Methodology
From district Udham -Singh Nagar of Uttarakhand under study four blocks namely-Kashipur, Jaspur, Kichha and Bazpur were selected. Out of these four blocks 10 villages from each blocks were marked and from each village 10 rural households were randomly selected thus random proportionate sampling procedure was adopted. Thus sample construction is 400 rural households from the universe of 104847 rural households i.e. 38 households per one thousand formed the basis of sampling. Interview method was adopted while conducting the survey since mostly respondents were uneducated.For data analysis, regression approach was used using statistical software SPSS.
### c) Hypothesis
Null Hypothesis $(H_0)$ 1: Source of income effect has no impact on saving behavior of rural-households.
Null Hypothesis $(H_0)$ 2: Economic infrastructure connectivity has no impact on saving behavior of rural households.
Null Hypothesis $(H_0)$ 3: Attribute and Quality of Life have no significant impact on saving behavior of rural households.
Null Hypothesis $(H_0)$ 4: Awareness about saving policies has no relationship with saving behavior of rural households.
### d) Result
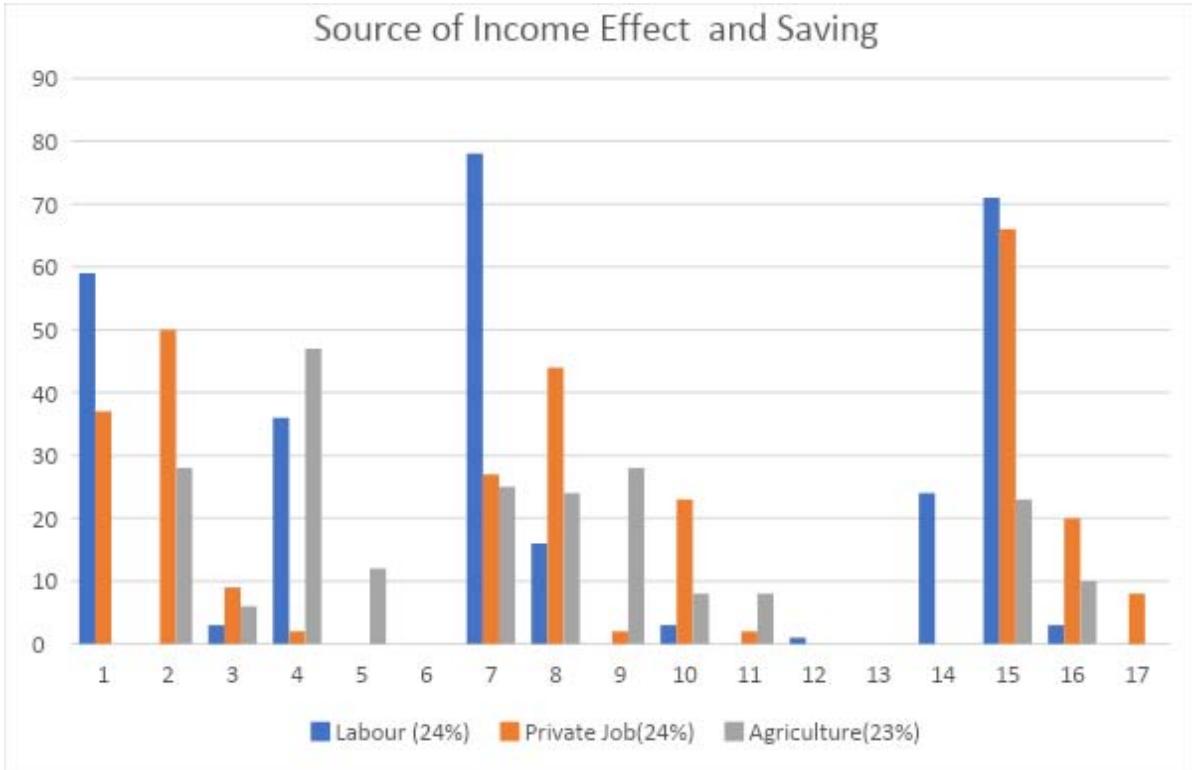 Figure (6.4.1.): Ho1: Source of Income Effect on Savings Source: Primary Data Survey Report In this figure section c depicts heavy concentration of respondents who were dependent on private jobs and laborers saved less than LCU 5000
monthly in the study area. Labour class could not save above this amount. Hence it is evident that source of income has significant effect on saving.
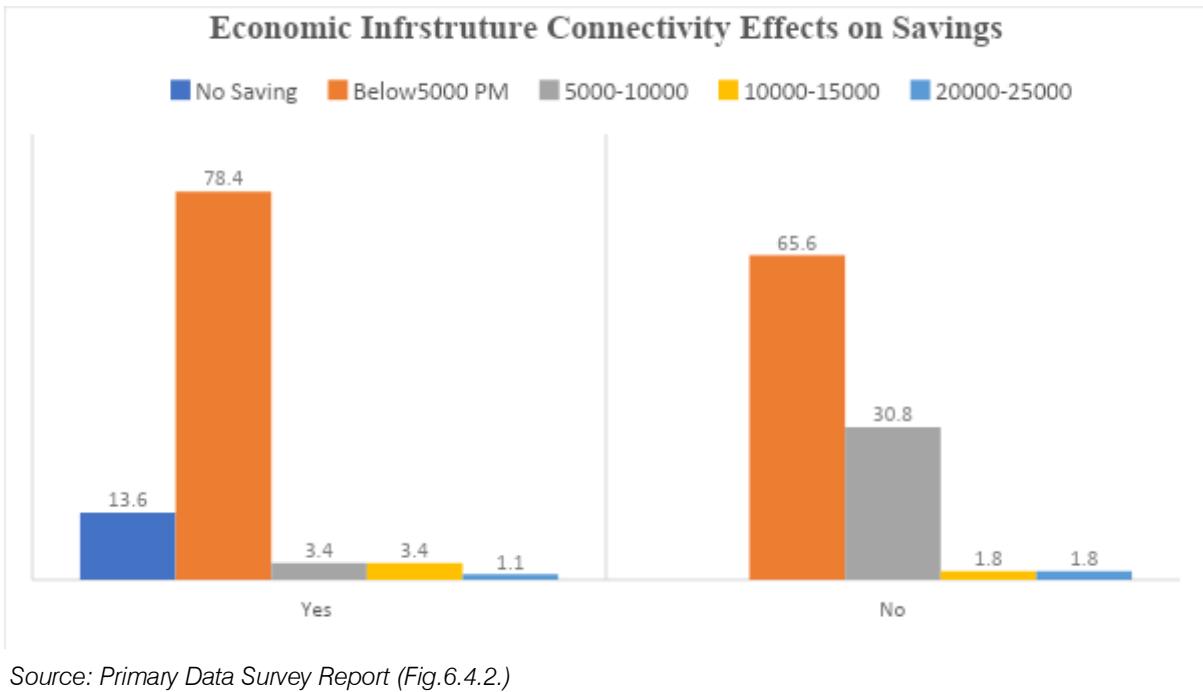 Figure (6.4.2.): Ho2: Economic Infrastructure Connectivity Effects on Savings
Situation in Figure (6.4.2) looks indeterminate conclusion a chi-square test was made whose values regarding their opinion so to arrive at appropriate are given below:
<table><tr><td colspan="4">Table 6.4.2: Chi-Square Test</td></tr><tr><td></td><td>Value</td><td>Df</td><td>Asymp. Sig. (2-sided)</td></tr><tr><td>Pearson Chi-Square</td><td>205.129a</td><td>12</td><td>.000</td></tr><tr><td>Likelihood Ratio</td><td>267.611</td><td>12</td><td>.000</td></tr><tr><td>Linear-by-Linear Association</td><td>3.933</td><td>1</td><td>.047</td></tr><tr><td>N of Valid Cases</td><td>400</td><td></td><td></td></tr><tr><td colspan="4">a. 4 cells (15.4%) have expected count less than 5. The minimum expected count is.88.</td></tr></table>
H02: Pearson's chi-squared statistic is found to be 205.
129. The p-value of the pearson's chi-squared statistics is 0.000, which is less than 5 percent level of significance. This indicates that at 95 per cent confidence level, the null hypothesis is rejected thus it can be concluded that Economic infrastructure connectivity has a significant impact on saving behaviour of rural households. If they have proper access to; financial infrastructure such as bank, transports, road connectivity, health care facilities,
electricity, recreational activity, digital connectivity, rail - connectivity etc., are made easily accessible to the rural households they would be able to save more because it may curtail their expenditure cost which otherwise might be time and money consuming efforts.
Ho3 & Ho4: Multiple regressions involve one continuous criterion (dependent variable) and two or more predictors (independent variable).
Table 6.4.3: Regression Coefficients
<table><tr><td rowspan="2" colspan="2">Model</td><td colspan="2">Unstandardized Coefficients</td><td>Standardized Coefficients</td><td rowspan="2">t</td><td rowspan="2">Sig.</td><td colspan="2">Collinearity Statistics</td></tr><tr><td>B</td><td>Std. Error</td><td>Beta</td><td>Tolerance</td><td>VIF</td></tr><tr><td rowspan="4">1</td><td>(Constant)</td><td>2.327</td><td>.195</td><td></td><td>11.909</td><td>.000</td><td></td><td></td></tr><tr><td>AVRG_QLT</td><td>-.094</td><td>.038</td><td>-.146</td><td>-2.444</td><td>.015</td><td>.615</td><td>1.627</td></tr><tr><td>AVRG_AWR</td><td>.187</td><td>.043</td><td>.251</td><td>4.306</td><td>.000</td><td>.644</td><td>1.552</td></tr><tr><td>ATTR_AVG</td><td>-.006</td><td>.034</td><td>-.010</td><td>-.179</td><td>.858</td><td>.713</td><td>1.403</td></tr></table>
- Positive alpha, 2.327 exhibits their tendency to save due to their ability and will. It implies a deliberate decision behind their savings rather than residual over expenditure.
- The p-value 0.858 of the attribute (V1) is $>$ significance level 0.05 hence model is statistically insignificant and Null hypothesis (Ho3) is accepted that attributes do not have any significant impact on their savings. Coefficient -0.006 shows that it has marginally negative impact on saving behavior.
- The p-value of quality of life $0.015 < 0.05$ (significance level) hence there is sufficient and valid reasons to reject null hypothesis(Ho3) that quality of life has no significant impact on individual's saving behavior. And accept alternate hypothesis that quality of life i.e. status in the society, demonstration effect, fashion etc. are negatively impacting their saving behavior.
- The p-value 0.000 is significantly $>$ than 0.05 (Level of significance) hence there is sufficient valid reasons to reject null hypothesis (H04) that awareness do not have any impact on saving behavior. Contrary to that spread of Government institutions, vigorous advertising of Government sponsored schemes like PMJDY, rate of interest etc., all have significant positive impact on their saving behaviour.
### e) Discussion
It reveals that the maximum number of (262) households; out of 400 respondents, do not have agricultural land at all. These landless household are doing work as farm/daily wages laborers in rural area.
The income of these laborers is very less and uncertain. The disposable income left in hand at the end of a month/week is very less, thus adversely affecting the saving of rural household.
The farmers have subbed marginal land holdings. Out of 400 respondents, only 20 households have 3-5 acre and 118 household have 1-3 acre of land for cultivation. Moreover, the input cost per unit is higher than the output. Indiscriminate use of soil, pesticide, fertilizer and exploitation of groundwater has adversely affected soil fertility. Therefore, the farmers who are totally dependent on agriculture and do not have any other source of income are saving very less relatively.
Family dependency of the households is an important determinant of saving. It is seen from the analysis that larger the family-size and savable amount were inversely co-related.
Source of income has also influenced, a daily wages laborer; in comparison to equal income earned from other sources, spends his hard-earned money with utmost caution. So the saving amount is not touched by the daily wages laborer unless emergency.
### f) Suggestions
## i. Saving Attribute
Since Out of six attributes, marriage is forming one larger part of saving decisions. This kind of saving is in reality a loss of returns because dowry or marital expenses for the lower and lower middle-class people is a wasteful expenditure in the future. So people of this class should be motivated toward carrying court-marriages without pomp & show.
## ii. Economic Environment
For securing them from life hazards intense awareness should be brought about insurance policies so that dependents can be taken into account in case of any emergency: like Risk -Cover offered by State bank of India, Health insurance should be promoted so that they can reap the benefits; of sum insured for their entire family, more than the sum invested out of forgone consumption like Arogya by State bank of India, Platina for retirement benefits.
## iii. Saving Capability
To increase saving capability, income deepening methodology can change a lot in their lives. Since $50\%$ were female respondents, it can be suggested that the teaching of home-science at all ladders of education should be made compulsory. Where following curriculum can be adopted:-Budget Making, Calorie Counting, Product Quantity and Calorie, Products and Calorie, Products and Price. Teaching of stitching for common clothes like school dress, trousers, kurta, waistcoat etc., should be imparted to all, to save money, at certain levels of income. Beauty is also one important part where girls can save money without sacrificing their physical appearance and confidence. For male counterparts it is the value-oriented education that will keep them away of all kind of non-senses right from alcoholism, tabacoculture, demonstration effect out surpassing the income effect. While getting orthodox education they must be taught electrical repairing, electricity repairing, plumbing work these small trainings would pave and pay a lot to them.
## iv. Risk-taking Behavior
Govt. agencies should attempt to bring rural low income-savers towards share-market, although this market is volatile but can fetch lucrative returns even on small savings like a share can be bought in 60 INR. Opening of D-Mat account and deepening of digitization can surely bring change in their saving behavior, i.e. a shift from risk aversion to risk taking behavior. Because to keep inflation under check, rate of interest on savings can not go much higher. Thus, they will be left with more to consume and resume security without thinking about the longevity of the life-expectancy.
## VII. CONCLUSION
There is a significant drawback in the saving pattern of rural households. Rural households are found less diversified in their savings. The reason for this may be the lack of availability of saving services and low level of financial awareness in rural areas as compared to the urban areas. Most of the people get financial information from TV media, Social media sources or from the advice of their family and friends before opt to saving or investment.
Hence, Financial literacy apart from income augmenting practices may bring a significant change in households' saving behaviour and pattern. Such kind of informational change can be brought by changing curricula; which would be in lieu with the Earth Summit goal of education for sustainable development rural areas.
To reduce saving - investment gap a new approach of hefty increase in pay-brackets of government servants; particularly in higher education: may be planned, which will serve multifold objectives of raising wages (outsourcing of domestic work due to heavy participation of females in Universities and Degree colleges), financial savings, and consumption because marginal propensity to consume of this class is positive but quite less than one. As Keynes has suggested in his book on General Theory of Employment, Interest and Money in 1936, he advocated to channelize the public- money into economy through public -works program to generate employment for war-ridden economies. Now instead of generalized interest mechanism and creating undue glut into the economy, money-supply can be increased by putting more money into the hands of teachers in higher education system through the path of raising their disposable-incomes. Because education for sustainable social and economic development can be imparted only through highly enlightened teachers and as is well known enlightenment comes through deep knowledge and thinking. So to attract thoughtful humans and knowledgeable brains into this system wage-structure should be reformulated in India. Because gravitational forces attract best minds towards more remunerative and performance rewarding jobs.
This policy would be transformed into either increased GST or domestic-savings or re-distribution of income in favor of bottom low people due to outsourcing of household-works due to heavy-workload put on their shoulders as compared to pre-covid era. Thus, trine objectives shall converge into vanishing the saving - investment gap.
### APPENDICES
#### The Measurement Problems
The interpretation of Indian saving trends is complicated by a number of weaknesses in the Central Statistical Office's (CSO) methodology for measuring both investment and saving. The most important shortcomings are:
The estimate for physical household saving is set equal to household investment, which itself is calculated only indirectly as a residual.
There are errors and omissions in the estimates of both savings and investment, but adjustments are made only to investment.
According to CSO: saving estimate is more reliable (based on the greater accuracy of public, financial, and corporate saving data) and therefore adjusts investment to equal the sum of domestic and foreign saving.
The commodity flow method used to estimate total investment—based on fixed production coefficients—has remained unchanged for decades. While it might still be useful for comparing investment in adjacent years, new technologies and the growing amount of investment in the informal sector are not adequately reflected in the estimates.
The estimates of corporate saving and investment are based on a small, unrepresentative sample, and rely largely on voluntary responses from enterprises.
The CSO estimates do not cover some assets preferred by households, namely jewelry and gold. Household saving in gold probably increased after import restrictions were liberalized in 1992, implying an increase in the underestimation of saving (Muhleisen, 1997)
Finally, there are differences in saving and investment estimates among Reserve Bank of India, CSO and Center for Monitoring Indian Economy (CMIE) based upon techniques used by them.
Table 6.4.4: Reliability Statistics
<table><tr><td>Constructs</td><td>Cronbach's Alpha</td><td>No. of item</td></tr><tr><td>Saving Behaviour (Infrastructure)</td><td>0.604</td><td>9</td></tr><tr><td>Attribute</td><td>0.729</td><td>12</td></tr><tr><td>Awareness</td><td>0.536</td><td>5</td></tr><tr><td>Quality of Life</td><td>0.885</td><td>5</td></tr><tr><td></td><td></td><td></td></tr><tr><td></td><td></td><td>31</td></tr></table>
Table 6.4.5: Model Summary (Main variables)
<table><tr><td rowspan="2">Model</td><td rowspan="2">R</td><td rowspan="2">R Square</td><td rowspan="2">Adjusted R Square</td><td rowspan="2">Std. Error of the Estimate</td><td colspan="5">Change Statistics</td></tr><tr><td>R Square Change</td><td>F Change</td><td>df1</td><td>df2</td><td>Sig. F Change</td></tr><tr><td>1</td><td>.360a</td><td>.130</td><td>.123</td><td>.32237</td><td>.130</td><td>19.654</td><td>3</td><td>396</td><td>.000</td></tr></table>
Table (5.4.5.) presents a measure of "explained variation". Result shows that $R$ of 0.360 than the variability of Y-values around the regression line is 1-0.360 times the original variance, and value of adjusted $R$ (0.123) exhibits the fact that present regression equation explains only 12% variation in saving behaviour rest of the occurrence may be affected by random terms.
Generating HTML Viewer...
References
23 Cites in Article
Aytül Ganioğlu,Cihan Yalçın (2015). Domestic Savings-Investment Gap And Growth: A Cross-Country Panel Study.
Assandé Désiré Adom,G Nasr,Elbahnasawy (2014). Saving-Investment Gap and Economic Growth in Developing Countries: Simulated Evidence from Selected Countries in Africa.
Arvind Shrivastava,Nitin Kumar (2020). A Survival Model for Wilful Default Prediction – Bayesian Approach.
Chadwick Curtis,Steven Lugauer,Nelson Mark (2011). Demographic Patterns and Household Saving in China.
Christopher Carroll,David Weil (1050). Saving and Growth: A Reinterpretation.
Christopher Carroll,Jody Overland,David Weil (2000). Saving and Growth with Habit Formation.
Chandra Preeti (2022). Empirical Analysis on Saving Attributes and Quality Life of Households in Four Blocks of District Udham Singh Nagar.
Damiano Sandri (2010). Growth and Capital Flows with Risky Entrepreneurship.
Bradley Ewing,James Payne,Shawn Forbes (1998). CO‐MOVEMENTS OF THE PRIME RATE, CD RATE, AND THE S&P FINANCIAL STOCK INDEX.
Lutfi Erden,Randall Holcombe (2005). The Effects of Public Investment on Private Investment in Developing Economies.
Girish Bahal,Mehdi Raissi,Volodymyr Tulin (2015). Crowding-Out or Crowding-In? Public and Private Investment in India.
W Greene (2003). Econometric Analysis.
D Ramana (1950). A National Accounts Model of India, 1950-51 Through 1957-58.
Shafinar Ismail,Nadia Khairuddin,Nurul Alias,Wei Loon- Koe,Rozana Othman (2018). An Empirical Analysis of Saving Behavior among Malaysian Employees.
Gocer Ismet,Tugba Akin,Alatas Sedat (2016). The Effects Of Saving-Investment Gap On Economic Growth In Developing Countries: A Clustering And Panel Data Analysis.
J Keynes (1936). General Theory of Employment Interest and Money.
Mohsen Bahmani-Oskooee,Scott Hegerty,Harvey Wilmeth (2012). The Saving-Investment Gap And Income Inequality: Evidence From 16 Countries.
Orazio Attanasio,Lucio Picci,Antonello Scorcu (2000). Saving, Growth, and Investment: A Macroeconomic Analysis Using a Panel of Countries.
(2011). The Relationship Between Domestic Saving Of Economic Growth And Convergence Hypothesis: Case Study Of Thailand.
Adin Nurawaluddin,Willy Arafah,Dan Kusnadi (2023). The Influence of Strategic Planning and Economic Resource Base View on Sustainable Development Mediated by Government Policy at the Ministry of Maritime Affairs and Fisheries.
Ronald Lee,Andrew Mason,Timothy Miller (2000). 6. Saving, Wealth, and the Demographic Transition in East Asia.
Robert Eisner (1994). Real government saving and the future.
Yingyi Qian,Gérard Roland (1998). Federalism and the Soft Budget Constraint.
Explore published articles in an immersive Augmented Reality environment. Our platform converts research papers into interactive 3D books, allowing readers to view and interact with content using AR and VR compatible devices.
Your published article is automatically converted into a realistic 3D book. Flip through pages and read research papers in a more engaging and interactive format.
Our website is actively being updated, and changes may occur frequently. Please clear your browser cache if needed. For feedback or error reporting, please email [email protected]
Thank you for connecting with us. We will respond to you shortly.