Since the New Economic Policy in India, Foreign Direct Investment (FDI) has received more attention at both national and state levels. According to the World Investment Report (2021) published by UNCTAD, India is one of the top investment destinations and ranks 7th place in receiving FDI inflows. While attracting inflows from all the regions, Karnataka garners a larger share among the total FDI inflows in India. This paper examines the trends and patterns of Foreign Direct Investment (FDI) inflows in the state of Karnataka in the past decade (2012-13 to 2021-22) with emphasis on investment promotion policies, comparative performance among the top five states of India, cumulative inflows from abroad and challenges for the state to further strengthen the inflows. It is hypnotized that FDI has a positive impact on Per Capita Net State Domestic Product (NSDP) and infrastructure development in the state. The multi-regression analysis is used as a statistical tool.
## I. INTRODUCTION
Karnataka is the third major state of India contributing 8.8 percent to the National Gross Domestic Product constituting less than 5 percent of the population (Economic Survey Report 2021-22). As an Investors' favorite destination attracts a lion's share of the total FDI inflows in India. The FDI inflow in the state has grown from US $ 1581 Million in 2007 to US $ 22072 Million in 2021. FDI has a crucial role in developing economies (S. Hymer). Karnataka was the first state to enact the Industrial Facilitation Act 2002, proactive policy measures, integrated services, nodal agency, and focus on capacity building are some other initiatives that Karnataka govt. has taken to fascinate FDI inflows. Karnataka has received about 40 percent FDI in post post-pandemic period during 2021-22 maintaining a numero uno position in the country. The inflow of capital into a location generates employment, fosters innovative practices, and accelerates productivity through advanced techniques (Blomstrom, 1994).
## II. REVIEW OF LITERATURE
The various studies and research reviews about FDI trends and how it accelerates economic indicator of a destination are reviewed. OLI or Eclectic paradigm by John H Dunning serves as a holistic framework to highlight the location factor as an advantage factor to increase the production of a multinational company. Government policies are crucial to attracting transnational Corporations (Dirk Willem te Velde). FDI inflows are catalysts to reconstruct an economy.
The paper signifies the role and importance of the retail sector and its contribution to the gross domestic income of India. The paper focuses on the policies undertaken by the governments to mitigate the disparities in regional developments in India. Post-Independence agricultural and industrial policies along with New Economic Policy paved the way for Foreign Direct Investment in different sectors of the economy. Nevertheless, FDI widened the gap between regions in terms of attracting investments. This research paper has analyzed the patterns of FDI and regional disparities in India during the period 1990 to 2020. The findings of this paper show the coastal area, industrial areas, and port availabilities have attracted more investments than the backward areas. (Singh, 2021)
The authors explain the importance of Foreign Direct Investment and international commerce-related activities in the country. Trade between the countries is explained through the export and import of goods and services. Economies benefit in terms of tax, tariffs, exceptions, or reductions to build infrastructure and thereby build an economy at large. The paper focuses on both the highs and lows of FDI in the Indian Economy. (Deep, (2022).)
Special Economic Zone contributes to better exports, enhancing economic activities, generating employment opportunities, and attracting investment from abroad. Karnataka benefitted from the advent of the SEZ Act in 2006.
However, several hurdles like government approvals, clearance from statutory bodies, withdrawal of tax benefits, and incentives have had huge negative repercussions on the smooth functioning implementation of SEZ activities. Hence, the paper tries to relate the macroeconomic variables like Per Capita Net State Domestic Product, availability of industrial land, skilled labor, the gap in the supply of electricity, and capital formation in government that are likely to impact SEZ investment. The results showed selected independent variable does determine investment decisions in SEZs in the state of Karnataka. (Parmar, (2021)).
The paper finds that Indian states rich in natural resources, a strong industrial base, and service sector activity attract more FDI inflows. There is a strong significant relationship between market size, agglomeration effects, and size of manufacturing, services sector activity, and FDI flow. Also, taxation and cost of labor in FDI inflows have a negative impact. (Atri Mukherjee, (2011) The objective of the research analysis is to investigate the impact of foreign direct investment on regional inequalities and to analyze cross-country time series data on FDI and regional inequalities. Hence, the author has used a regression model for 55 countries covering the period 1980-2009. Statistical tools used are coefficient of variation, regression analysis, and scatter plot of the data. The paper finds foreign investments are a boon to China's growth but a bane to regional inequality. Net FDI inflow increases regional inequality in low- and middle-income countries whereas negative re-distributional consequences in high-income economies. It also found out FDI impact on capital stock in host regions acting regional inequality within countries. (Christian Lessmann, (2012))
The focus is on the impact of the labor market on FDI inflow and the author attempts to quantify labor market rigidities using the available data and analyze their impact on interstate variations in FDI inflows in India. The methodology used is investigative research with the help of secondary data to investigate the sensitivity of overseas investment to labor market conditions across Indian states. The methodology includes Count Models and Panel Corrected Standard Estimates (PCME) technique for the estimation of two sets of dependent variables. The paper concludes with the finding Infrastructure and regional development is a key factor in attracting higher FDI both in the export and domestic market sectors. Also, the size of the host economy is the most popular explanation of a country's propensity to attract FDI. (Aggarwal, 2015). The research article emphasizes the objective of finding regional disparities existence in India and the trends and patterns of FDI flows and its impact on regional disparities in India.
Also, the repercussions were accentuated after the adoption of the new economic policy in India. The methodology used is analytical research using secondary data obtained from the Census of India, Reserve Bank of India, and Economic Survey Reports.
The indicators are female literacy, rural non-agricultural workers, population above the poverty line, and urbanization.
Tools used to study the variables in the paper are correlation, coefficients, development index, and rankings.
The paper finds and concludes to balance regional growth; the government has to improve the infrastructural base in its backward parts. (Singh R., (2016)
The objective of the study is to find out the trends of FDI inflows into the country and the dynamics of FDI locations in India. Identify the factors determining FDI location and suggest suitable policy measures for the equitable distribution of FDI in the country.
The methodology used is exploratory research based on secondary data sourced from RBI bulletins SIA newsletters, FDI factsheets, and other publications of the government of India. Collected data is arranged in tables, converted to percentages, and with the help graphs drawn out of tables are used to analyze the data to draw meaningful inferences. The GIS technique has been used to show the dynamics of the location of FDI in India in the post-liberalization period. The paper finds geographical distribution of FDI within the country is skewed, Benefits of globalization are confined to a few leading states, wherein the existence of MNCs attracts more FDI inflow. The potential may be in the form of a strong concentration of manufacturing activities, an abundance of natural resources, a highly skilled labor force, and location advantages like seaports, airports, railways, and road connectivity, etc., (Sedam. H, (2017).
State of Foreign Direct Investment in Karnataka: FDI means an investment through equity instruments by an individual or a firm other than the host country acquiring a controlling stake or ownership into a country (DPIIT). It includes "mergers and acquisitions", the equity capital of foreign banks having branches in the host country, and reinvestment of profit earned by foreign investments. It is preferred over borrowing because FDI inflow are non-debt-creating capital resource. It has multi-dimensional spillovers in the field of employment generation, modernization, and uplifting an economy. Fiscal and administrative efforts have been made over the years to attract consistent inflows.
### a) Investment promotion policies and programs in Karnataka
The New Industrial Policy 2020-25 introduced by the state aims to attract investment worth 5 Lakh Crore (Approx. US $ 61.20 billion), 20 lakh new jobs, and to acquire a third place in goods export in India. These policy promotions are in a mission mode and various steps at the macro-economic level, sector-specific orientation, fiscal measures, and infrastructure development are the top priorities of the state. The following are the steps taken up by the Government of Karnataka in the last decade to facilitate inflows and dedicate the state to an investor's investor-friendly climate.
- Establishment of Karnataka Udyog Mitra with the objective to promote FDI in the state.
- Investment projects completed within the time projected are given incentives and govt. has strengthened the state's infrastructure.
- Special focus on the development of industries, trade, and service sectors.
- Striving to remove intra-regional disparities by diverting investments in backward areas of the state. (Industrial Policy 2009-14)
- Karnataka Industrial Tax concessions and capital investment subsidies,
- Global Investor's Meet 2010/2012/2014/2016/2018/ 2022
- Agriculture Global Investment Meet 2011
- The State High-Level Clearance Committee (SHLCC)
- State-Level Single Window Clearance Committee (SLSWCC)
- Investment in skill building and human capital formation for uninterrupted supply of manpower.
- Sector-specific industrial zones and Special Economic Zones (SEZ) in accordance with the availability of raw materials and natural resources.
- High-speed internet connectivity and telecommunication network.
The mission mode work done by Karnataka state administration and friendly policies made could serve as a comparative study for the other states of India as well as regions striving to attract FDI inflows. There is a provision for dedicated single window clearance and a dedicated single contact point named Karnataka Udyog Mitra (KUM). Strategically working on
developing Export Development Centres at other important cities of Karnataka.
### b) Trends and pattern of FDI in the state
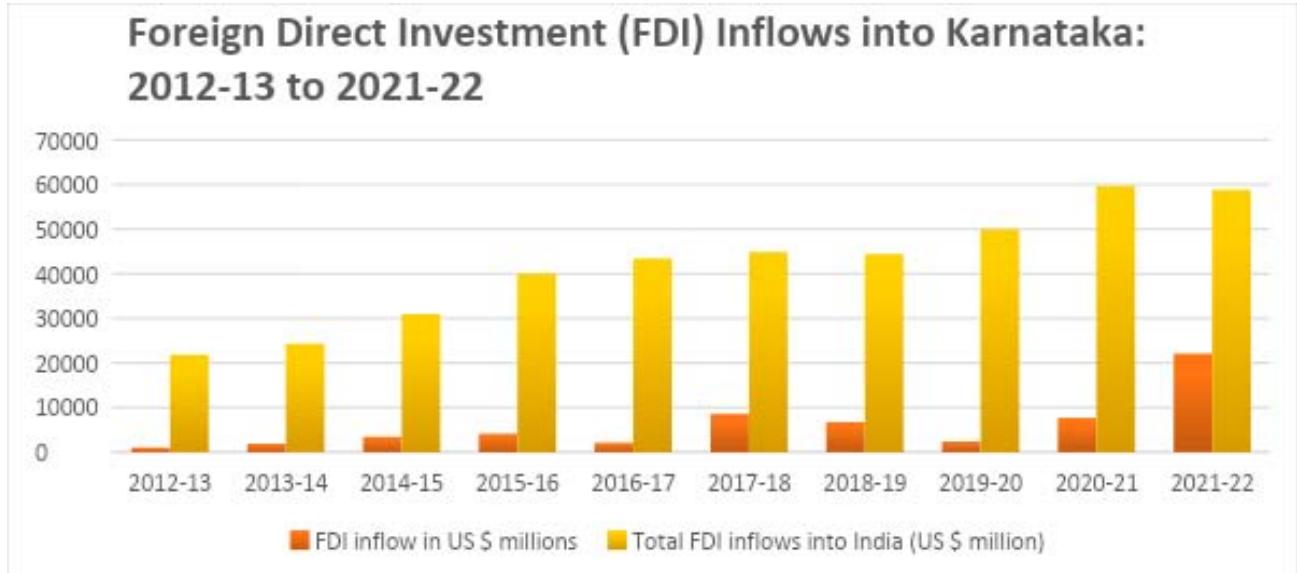
Karnataka has successfully recovered and attracted the highest FDI in the post-pandemic period top with about 37.5 percent inflows. Aerospace, defense manufacturing, Biotech, and Fintech are the dominant sectors receiving this inflow (KESDM). Historical data reveals that the state has successfully grabbed global investments as a consistent part of the state's economy and generated a significant number of job opportunities. The state of Karnataka is aware of the benefits of FDI inflow. Eventually, the region is progressing as a reputed investor's investor-friendly location for Foreign Direct Investment (FDI) inflows. FDI inflows in Karnataka have risen substantially over the period of 2012- 2022. The analysis of FDI inflows in Karnataka shows that the total FDI inflow share in the state was US $1023 million in 2012-13 which rose to almost four times in the year 2015-16 but declined in the next year i.e. 2016-17 years and remained only US$ 2132 million. Again, in the next year, it increased to US$ 8575 million in the year 2017-18. The year 2019-20 suffered the terrible hit of the Covid-19 pandemic and economies were sluggish globally. However, India did a 'V' shape recovery and the inflows rebounded to US$ 7670 million in the year 2020-21. Karnataka received all-time high inflows in the year 2021-22 and topped the country with about 37.55 percent of FDI inflows share. The presence of large multinational companies has attracted other new investors also eventually Karnataka has become a hub of investment.
Table 1: Foreign Direct Investment (FDI) Inflows into Karnataka: 2012-13 to 2021-22.
<table><tr><td>Year</td><td>FDI inflow in
Karnataka
(US $ millions)</td><td>Total FDI inflows into India
(US $ million)</td><td>Share of Karnataka in total
FDI inflows into India (%)</td></tr><tr><td>2012-13</td><td>1023</td><td>21825</td><td>4.69</td></tr><tr><td>2013-14</td><td>1892</td><td>24299</td><td>7.79</td></tr><tr><td>2014-15</td><td>3444</td><td>30933</td><td>11.13</td></tr><tr><td>2015-16</td><td>4121</td><td>40001</td><td>10.30</td></tr><tr><td>2016-17</td><td>2132</td><td>43478</td><td>4.90</td></tr><tr><td>2017-18</td><td>8575</td><td>44857</td><td>19.12</td></tr><tr><td>2018-19</td><td>6721</td><td>44366</td><td>15.15</td></tr><tr><td>2019-20</td><td>2385</td><td>49977</td><td>4.77</td></tr><tr><td>2020-21</td><td>7670</td><td>59636</td><td>12.86</td></tr><tr><td>2021-22</td><td>22072</td><td>58773</td><td>37.55</td></tr></table>

Figure 1: Karnataka State's Comparative Performance among top 5 states of India.
Investor-friendly policies, good governance, controlled law and order, availability of highly skilled manpower, and robust connectivity facilitate an investor-friendly climate in the state.
In the year 2021-22, Karnataka has recorded US$ 22072 million in inflows the highest among the top five states of India. The state with a 23 percent share of total inflows stands on 2nd rank with a cumulative inflow of US\(39361 million from October 2019 to September 2022. During the same period, Maharashtra the leading state received 28 percent of FDI inflows which is 5 percent more than Karnataka. Most recently, the capital city Bengaluru has emerged as a leading global tech cluster and a habitat for startups in India.
Table 2: Foreign Direct Investment (FDI) Inflows from October 2019 to September 2022
<table><tr><td>STATE</td><td>2020-21
(April – March)</td><td>2021-22
(April – March)</td><td>2022-23
(April– September)</td><td>Cumulative inflow
(October, 19 – September, 22)</td><td>% age
(to total equity inflow of USD)</td></tr><tr><td>MAHARASHTRA</td><td>16,170</td><td>15,439</td><td>8,000</td><td>47,165</td><td>28%</td></tr><tr><td>KARNATAKA</td><td>7,670</td><td>22,072</td><td>5,329</td><td>39,361</td><td>23%</td></tr><tr><td>GUJARAT</td><td>21,890</td><td>2,706</td><td>3,473</td><td>30,660</td><td>18%</td></tr><tr><td>DELHI</td><td>5,471</td><td>8,189</td><td>4,539</td><td>22,197</td><td>13%</td></tr><tr><td>TAMIL NADU</td><td>2,323</td><td>3,003</td><td>1,564</td><td>7,896</td><td>5%</td></tr></table>
### c) Cumulative FDI inflows from top 10 investing countries
India has emerged as a preferred investment destination, FDI inflows have increased 20 times more in the last 2 decades. Karnataka emerges as the top FDI inflow recipient state in India. (PIB, Ministry of Commerce & Industry). Cayman Island $(31\%)$ followed by Singapore $(30\%)$ are the top countries investing in Karnataka. USA and the Netherlands with 18 percent each are the third country to hold a stake in the region. Karnataka receives inflows from across the globe which reflects its popularity and reputation worldwide.
d) Cumulative FDI equity inflows from top 10 countries investing in India during the period January 2000 to December 2021 in USD Billions.
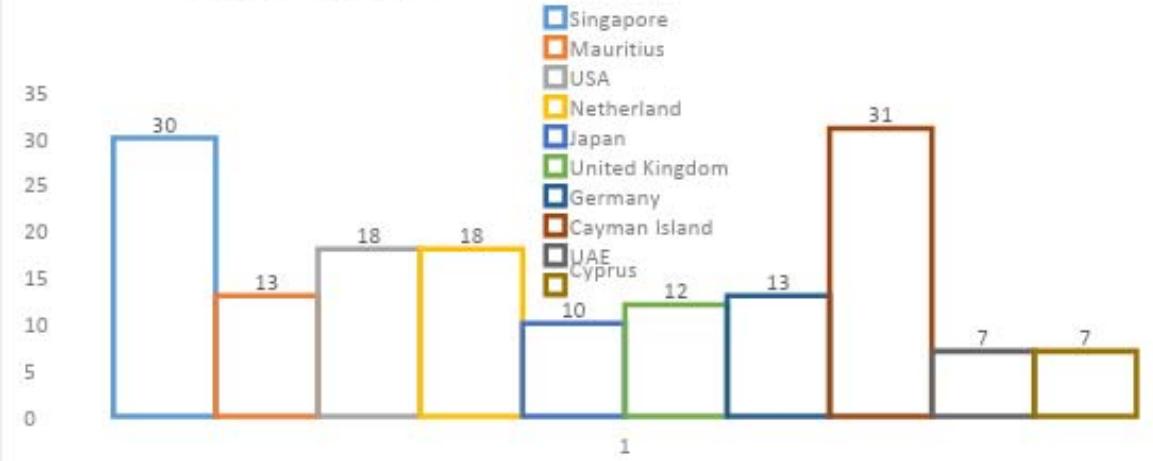
CUMULATIVE FDI EQUITY FROM 2000-2021 COUNTRY WISE EQUITY INFLOWS $(\%)$ IN KARNATAKA Figure 2: Cumulative FDI equity country wise inflows in Karnataka
Table 3: Share of top five countries attracting FDI equity inflow at Karnataka (From October, 2019 to December, 2021)
<table><tr><td rowspan="2">Rank</td><td rowspan="2">Country</td><td colspan="2">Amount of FDI equity inflows</td><td rowspan="2">% of FDI equity inflow from all countries</td></tr><tr><td>INR in crores</td><td>UDS in Million</td></tr><tr><td>1</td><td>Singapore</td><td>79,772.05</td><td>10,850.51</td><td>37.14</td></tr><tr><td>2</td><td>USA</td><td>31,173.44</td><td>4,215.46</td><td>14.43</td></tr><tr><td>3</td><td>Switzerland</td><td>30,530.78</td><td>4,165.61</td><td>14.26</td></tr><tr><td>4</td><td>Cayman Island</td><td>18,417.84</td><td>2,493.99</td><td>8.54</td></tr><tr><td>5</td><td>Mauritius</td><td>13,213.88</td><td>1,793.52</td><td>6.14</td></tr><tr><td colspan="2">Total of above</td><td>173,107.99</td><td>23,519.09</td><td>80.51</td></tr></table>
The Information technology and biotechnology sectors have received remarkable investment globally and contributed to the growth of state's economy.
Computer software and hardware with US\(8954 million (30.65 percent) of FDI equity top recipient sector in the state.
Supplementary Table 1 Share of top five sectors in FDI equity inflow at Karnataka (From October, 2019 to December, 2021)
<table><tr><td rowspan="2">Rank</td><td rowspan="2">Country</td><td colspan="2">Amount of FDI equity inflows</td><td rowspan="2">% of FDI equity inflow from all sectors</td></tr><tr><td>INR in crores</td><td>UDS in Million</td></tr><tr><td>1</td><td>Computer Software & Hardware</td><td>66,165.35</td><td>8,953.67</td><td>30.65</td></tr><tr><td>2</td><td>Automobile Industry</td><td>33,759.90</td><td>4,608.76</td><td>15.78</td></tr><tr><td>3</td><td>Trading</td><td>28,465.21</td><td>3,892.65</td><td>13.32</td></tr><tr><td>4</td><td>Education</td><td>28,032.59</td><td>3,803.28</td><td>13.02</td></tr><tr><td>5</td><td>Services Sector</td><td>26,804.74</td><td>3,622.27</td><td>12.39</td></tr><tr><td colspan="2">Total of above</td><td>183,227.79</td><td>24,880.63</td><td>85.16</td></tr></table>
### e) Impact of FDI on the growth and development of Karnataka
The government of Karnataka has taken various steps to lure FDI in the last decade. The capital city of Bengaluru emerged as the Silicon Valley of India, the establishment of the Software Technology Park of India (STPI) in Bengaluru was the revolutionary initiative of Karnataka state to develop an IT hub, where over 2,500 Multi-National companies doing their business and contributing over 25 percent of the state's GSDP. FDI inflow has a significant contribution to the development of Karnataka state economic transformation. Statistical analysis suggests that FDI inflows have a positive correlation in generating employment. About 54 new investment projects are approved from year march 2016 to September 22 which has created more than 2 lakh jobs in the state. (Economic Survey Report 2021-22). Karnataka is the hub of 400 Fortune companies and a leading exporter of software in India. Karnataka's export share is about 19 percent of the total exports of India (2021-22). About 32 operational sector-specific SEZ and business-friendly policies catalyzed export performance mainly in the IT/IT sector, biotechnology, high-tech engineering products, pharmaceuticals, and aerospace industries. These exports contribute to the GDP growth of the nation as well as the State's GSDP, resulting in a high per capita GSDP in Karnataka.
## III. METHODOLOGY OF THE STUDY
The study is based on secondary data compiled from the Handbook of Statistics on Indian
### b) Data Analysis
states, RBI, Annual Economic Survey reports of Karnataka, Planning, Programme Monitoring and Statistics Department, Government of Karnataka. The relationship between FDI inflows with Per Capita Net State Domestic Product and Per Capita Availability of Power was analyzed using multiple regressions. The author tries to examine the impact of FDI inflows on Per capita Net state domestic product (NSDP) and Infrastructure building in the region. Hence, the methodology applied is a time series analysis covering 31 states and UTs for the period 2000-01 to 2010-11. The source of data collection is secondary data from DIPP, CMIE, and Government publications. Data collected on equity inflows, sector orientation of FDI equity inflow in Indian states. The explanatory variable FDI and Response variables are NSDP and PCAP. The statistical tool used is ANOVA, regression, and coefficients.
### a) Hypothesis
H0: There is no relation between variables FDI inflows, Per Capita NSDP, and Per Capita Availability of Power in Karnataka.
Ha: There is a significant relation between variables FDI inflows, Per Capita NSDP, and Per Capita Availability of Power in Karnataka.
Table 5: Key indicators
<table><tr><td>Category</td><td>Symbol</td><td>Definition</td></tr><tr><td>Explanatory variable</td><td>FDI</td><td>Foreign Direct Investment inflows (US$ Million)</td></tr><tr><td>Response Variable</td><td>NSDP</td><td>Per Capita Net State Domestic Product (Current Prices)</td></tr><tr><td>Response Variable</td><td>PCAP</td><td>Per Capita Availability of Power (Kilowatt-Hour)</td></tr></table>
Supplementary Table 2: Analysis of variance (ANOVA)
<table><tr><td>Explanatory variable</td><td>Response Variable</td><td>Multiple R</td><td>R Square</td><td>Adjusted R Square</td><td>P-value</td><td>t Stat</td><td>Coefficients</td></tr><tr><td>FDI</td><td>NSDP</td><td>0.738</td><td>0.544</td><td>0.512</td><td>0.0001</td><td>4.093</td><td>10.67</td></tr><tr><td>FDI</td><td>PCAP</td><td>0.602</td><td>0.363</td><td>0.317</td><td>0.013</td><td>2.82</td><td>0.018</td></tr></table>
Supplementary Table 3: ANOVA description
<table><tr><td>ANOVA</td><td></td><td></td><td></td><td></td><td></td></tr><tr><td></td><td>df</td><td>SS</td><td>MS</td><td>F</td><td>Significance F</td></tr><tr><td>Regression</td><td>1</td><td>48429573523</td><td>48429573522</td><td>16.75</td><td>0.001</td></tr><tr><td>Residual</td><td>14</td><td>40460660176</td><td>2890047155</td><td></td><td></td></tr><tr><td>Total</td><td>15</td><td>88890233699</td><td></td><td></td><td></td></tr></table>
## IV. RESULT OF EMPIRICAL ANALYSIS AND INTERPRETATION
The results from supplementary table 2 revealed that the adjusted R square for the overall model is 0.317 which means that the model explains more than 31 percent variance in NSDP and PCAP of Karnataka. The significance F is 0.001 which is smaller than the p-value of 0.05 and proves that the null hypothesis is true. Positive coefficients are found between all three variables selected for this study. The model indicates that FDI inflow has increased annually and there is a positive correlation between the increase in NSDP as well as PCAP and it is statistically significant but it is not the only variable responsible for the increase in NSDP and infrastructure in the state. Further, the adjusted R square value of FDI and NSDP is 0.544 which reflects a significant positive relationship.
### a) Challenges for the state to deal with in respect of FDI inflows
FDI has been seen as a positive indicator but it has negative aspects also. However, FDI has more positive impacts on the macro and micro levels of the economy. Various studies suggest the benefits of FDI, however, there are some challenges to deal with FDI inflows in a location, Karnataka also has such challenges:
- The state has decentralized FDI inflows beyond Bengaluru in 2/3 tier cities of the state especially in North Karnataka cities such as Belagavi Hubli-Dharwad, Kalburgi, and Mangaluru.
- Human capital formation according to the needs of MNCs, Capacity building for the skilled labor force, work culture development, Professionals supporting fast-moving city life, efficient logistics, rapid connectivity, and massive power supply. It is a challenge to raise infrastructure at par with the capital city in other places of Karnataka.
- IT parks, SEZ, and Export-oriented zones in the state will definitely work on ease of doing for business favorable climate.
- Digitalization of land records, simplification of GST laws, single point of contact for center and state projects clearance, timely completion of projects and infrastructure building, support of Product Linked Incentive (PLI) scheme for foreign manufacturing companies optional in India. The fiscal and administration efforts towards minimizing
adversaries will lure investors and the region will gain more inflows for a long time.
## V. CONCLUSION
The existing literature focuses on the preparedness to attract FDI and the status of inflows in Karnataka. On a long-term objective, systematic government expenditure is done to strengthen the ease of doing climate for the investors in the region. Historical data suggests that economic development has improved year on year. Karnataka is the 5th state in India in terms of NSDP Per capita Income $\mathbb{R}210,887/$ (2018-19, RBI) and 6th top power-consuming state. However, this study reveals that FDI Benefits have reached to a specific location. The concentration of FDI in the capital city of the state is leading to intra-regional imbalances. Extending FDI in other cities of Karnataka is a big challenge for the government. The findings of this paper suggest two main policy implications. Policy promotion to drive the FDI towards other parts of the state viz. launching SEZ, Industrial zone, or Export oriented unit in remote locations of the state with tax concessions and investment incentives. Second, the FDI in the region can be attracted by raising infrastructure, better connectivity, power supply and availability of skilled labor near the natural resources could balance FDI inflow across the state.
To study the strong empirical relation between FDI inflow promotion policies, determinants, and its impact on economic growth a detailed study is needed. This is an area of extension of this study in the future.
- DISPARITIES IN INDIA, 1990 TO 2020. researchgate.net.
16. Radhika, A. Foreign Direct Investment In Retail Sector In India-Issues And Challenges. Journal of Commerce and Management, 57.
Generating HTML Viewer...
References
24 Cites in Article
Source: Compiled from FDI Fact Sheet.
(2010). Current Population Survey: Annual Social and Economic (ASEC) Supplement Survey, 2009.
A Aggarwal (2015). The Influence of Labour Markets on FDI: Some Empirical Explorations in Export Oriented and Domestic Market Seeking FDI Across Indian States.
Atri Mukherjee (2011). Regional Inequality in Foreign Direct Investment Flows to India.
N Bajpai (2009). Foreign Direct Investment in India.
M Devajit (2012). Impact of foreign direct investment on Indian economy.
Saarthak Sharma,Puneesh Nathani,Chaitanya Khurana,Yukti Sharma,Priyadarshi Gourav (2020). A Comprehensive Study on Hs-87 Based Trade for India and the United States of America, Tariff Analysis and Possible Negotiation Strategies.
Hargun Singh (2025). Comparative Public Debt of Indian States: Evidence from CAG’s State Finances 2022–23 and RBI Budgets 2024–25.
B Nagarjuna (2022). The Impact of Make in India on Foreign Direct Investment: An Analytical Study.
R Nagaraj (2003). Foreign direct investment in India in the 1990s: trends and issues.
M Narayana (2006). Inflow of Foreign Direct Investment into Karnataka.
C Parmar (2021). Determinants of investment in special economic zones (SEZs): A study with special reference to the state of Karnataka.
Malleshappa S.Kumbar,Vasudev Sedam.H (2017). Dynamics of Foreign Direct Investment (FDI) Location in India: An Empirical Analysis.
R Singh (2016). Foreign direct investment and regional disparities in post reform India.
Seema Singha,Soma Choudhary (1990). Entrepreneurship Growth and Employment Generation for Regional Development in India through Foreign Direct Investments: An Empirical Analysis.
A Radhika Foreign Direct Investment In Retail Sector In India-Issues And Challenges.
John Dunning (1973). THE DETERMINANTS OF INTERNATIONAL PRODUCTION 1.
John Dunning (2001). The Eclectic (OLI) Paradigm of International Production: Past, Present and Future.
Raymond Vernon (1966). International Investment and International Trade in the Product Cycle.
B Ohlin (1933). Interregional and International Trade.
K Kojima (1981). Direct Foreign Investment: A Japanese Model of Multinational Business Operations.
Stephen Hymer (1960). The International Operations of National Firms: A Study of Direct Foreign Investment.
Karun Vohra,Kavita Rani (2022). Analyze the need of Foreign Direct Investment (FDI) in retail sector from positive & negative point of view.
(2006). Supplementary file 2. All candidate proteins from the O-glycoproteome with at least 3-fold changes in T and Tn antigen in the mrva3102 mutant..
No ethics committee approval was required for this article type.
Data Availability
Not applicable for this article.
How to Cite This Article
Pawan Kumar. 2026. \u201cTrends and Patterns of Foreign Direct Investment Inflows in Karnataka\u201d. Global Journal of Human-Social Science - E: Economics GJHSS-E Volume 23 (GJHSS Volume 23 Issue E4): .
Explore published articles in an immersive Augmented Reality environment. Our platform converts research papers into interactive 3D books, allowing readers to view and interact with content using AR and VR compatible devices.
Your published article is automatically converted into a realistic 3D book. Flip through pages and read research papers in a more engaging and interactive format.
Since the New Economic Policy in India, Foreign Direct Investment (FDI) has received more attention at both national and state levels. According to the World Investment Report (2021) published by UNCTAD, India is one of the top investment destinations and ranks 7th place in receiving FDI inflows. While attracting inflows from all the regions, Karnataka garners a larger share among the total FDI inflows in India. This paper examines the trends and patterns of Foreign Direct Investment (FDI) inflows in the state of Karnataka in the past decade (2012-13 to 2021-22) with emphasis on investment promotion policies, comparative performance among the top five states of India, cumulative inflows from abroad and challenges for the state to further strengthen the inflows. It is hypnotized that FDI has a positive impact on Per Capita Net State Domestic Product (NSDP) and infrastructure development in the state. The multi-regression analysis is used as a statistical tool.
Our website is actively being updated, and changes may occur frequently. Please clear your browser cache if needed. For feedback or error reporting, please email [email protected]
Thank you for connecting with us. We will respond to you shortly.