
I. INTRODUCTION
Lomax distribution can also be called Pareto Type II distribution and its application can be found in many fields like actuarial science, economics, and so on Al-Zahrani and Al-Sobhi (2013). The distribution was defined by Lomax (1954) and it is a heavy-tailed distribution. It has also been considered to be useful in reliability and life testing problems in engineering and in survival analysis as an alternative distribution Kilany (2016), Hassan and Al-Ghamdi (2009).
Modified and extended versions of the Lomax distribution have been studied; examples include the weighted Lomax distribution by Kilany (2016), exponential Lomax distribution by El-Bassiouny et al (2015), exponentiated Lomax distribution by Salem (2014), gamma Lomax distribution Cordeiro et al (2015), transmuted Lomax distribution by Ashour and Eltehiwy (2013), Poisson Lomax distribution by Al-Zahrani and Sagor (2014), McDonald Lomax distribution by Lemonte and Cordeiro (2013), Weibull Lomax distribution by Tahir et al (2015), and power Lomax distribution [12]. Besides, estimation of the parameters of Lomax distribution under general progressive censoring has also been considered by Al-Zahrani and Al-Sobhi by Al-Zahrani and Al-Sobhi (2013).
The half logistic distribution is a member of the family of logistic distributions which is introduced by (Balakrishnan, 1985) which has the following cumulative distribution function (CDF)
Hassan et al. (2017) use the half logistic generator instead of the gamma generator to obtain type II half logistic family, which is denoted by TIIHL-G. Then the CDF and pdf of TIIHL-G is defined as follows
Notes
Where is the shape parameter and , and is the baseline distribution, respectively.
However, the TIIHLEE has tractable properties, especially for simulation, since its quantile function takes a simple form.
Where u is a uniform distribution on the interval and (.) is the inverse function of
Our aim in this work is to study a modified statistical distribution that will be suitable to fit positively skewed and unimodal data and to check the flexibility of the existing and proposed distribution.
II. TYPE II HALF LOGISTIC EXPONENTIATED LOMAX DISTRIBUTION
The cumulative density function (CDF) and probability density function (pdf) of exponentiated Lomax distribution (EE) are defined as follows:
Substituting 6 and 7 in 4 and 3 then we define probability density function (pdf) and cumulative density function (CDF) Type II Half Logistic Exponentiated Lomax Distribution (TIIHLEL) as follows:
Henceforth, a random variable with probability density function (pdf) is denoted by
Notes
a) Hazard Function of TIIHLEL
b) Survival Function of TIIHLEL
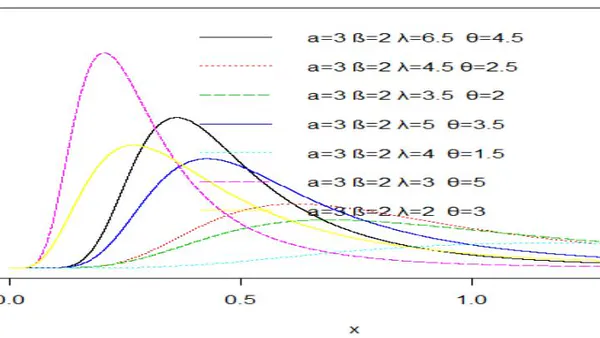
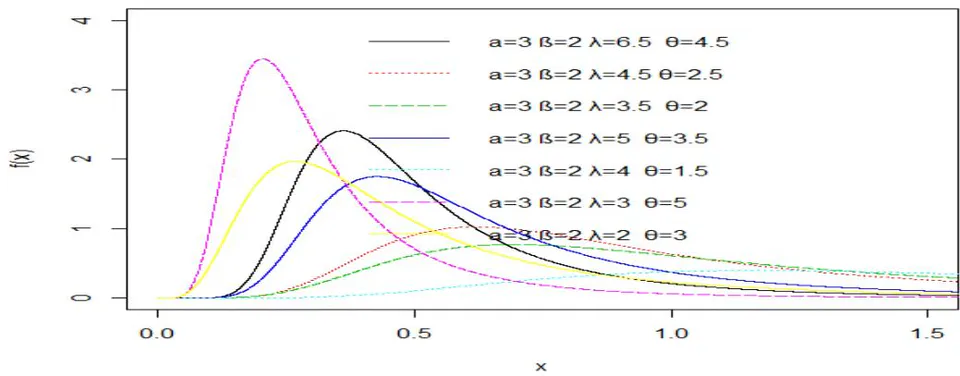
Plots of the density function (8) can be represented through Fig. 1. As it seems from Fig. 1 that the pdf of TIIHLEL can take different shapes according to different values of and . It can be symmetric, right-skewed, unimodal
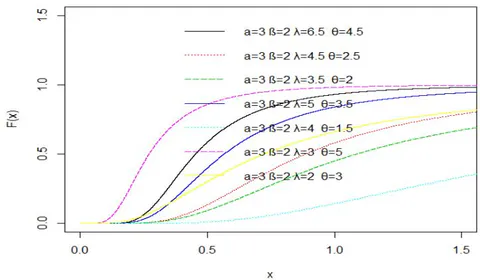
Plots of cumulative distribution function (9) for the TIIHLEL distribution are displayed in Fig. 2. The CDF graph tends to move at a constant value from 0 to 1 on the x-axis before projecting to one on the y-axis
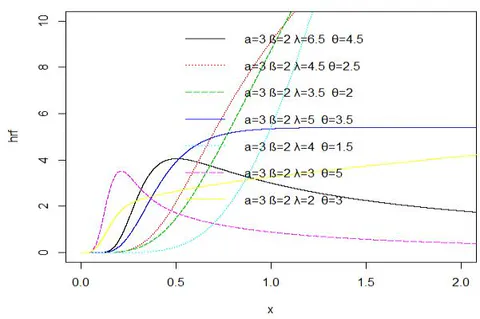
Plots of hazard function (10) for the TIIHLEL distribution are displayed in Fig. 3 It was examined from Fig. 3 show that the shape of the h(x) of the TIIHLEL shows the hazard functions can be constant, increasing or decreases, depending on the shape and scale parameters.
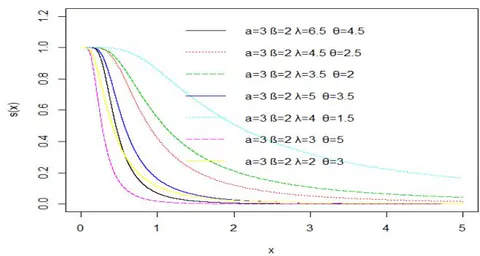
Plots of survival function (11) for the TIIHLEL distribution are displayed in Fig. 4. It was deduced from Fig. 4 that the shape parameters have a strong effect on the survival plot. A decrease in the shape parameter tends to reduce the movement of the line on the y-axis, and no plot is exceeding the benchmark of 1
c) Some Special case of TIIHLEL
- When, the TIIHLEL model reduces to Type II half Logistic Lomax (TIIHLL) model withandas shape parameters andas a scale parameter.
Notes
- When, the TIIHLEL model reduces to Type II half Logistic Exponentiated Pareto (TIIHLEP) model with,, andas shape parameters.
- When , the TIIHLEL model reduces to Half Logistic Exponentiated Lomax (HLEL) model with and are shape parameters is scale parameter.
- When, the TIIHLEL model reduces to Type II Half Logistic Pareto (TIIHLP) model withandas shape parameters.
- When , the TIIHLEL model reduces to Half Logistic Lomax (HLL) model with and and are shape parameters.
- When, the TIIHLEL model reduces to Half Logistic Pareto (HLP) model withas a scale parameter.
| Distribution | ||||
| TIIHLL | 1 | |||
| TIIHLEP | 1 | |||
| HLEL | 1 | |||
| TIIHLP | 1 | 1 | ||
| HLL | 1 | 1 | ||
| TIIHLEL | 1 | 1 | 1 |
Table 1 depict some existing model obtained when some parameters of the proposed distribution are relaxed.
III. MATHEMATICAL PROPERTIES FOR TIIHLEL
a) Infinite Linear Combination
Let
Notes
Let
b) Moment of Proposed TIIHLEL Distribution
It is imperative to derive the moments when a new distribution is proposed. They play a significant role in statistical analysis, particularly in applications. Moments are used in computing measures of central tendency, dispersion, and shapes, among others.
Suppose the moment for the TIIIHL-G family is derived.
Let
Notes
Beta function is given
Therefore
Comparing 3.79 and 3.80 we have
The mean of the proposed TIIHLEL distribution is gotten by making moment equal to one (—r=1)
When
When
When
The variance of TIIHLEL is obtained.
Substituting equation 17 and 18 into 21 to obtain the variance of TIIHLEL
Standard Deviation of TIIHLEL
Coefficient of Variation of TIIHLE (Theta)
c) Moment Generating Function of TIIHLEE Distribution
A random variable x with pdf f(x) is defined as a
d) Incomplete Moment
The incomplete moment plays an important role in computing the mean deviation, median deviation.
The incomplete moment of the TIIHLEL is given by
Where B(..) is the incomplete beta function and r=1,2,3.....
The variation in a population can be measured to some degree by the totality of deviations from the mean and the median. If the random variable X follows the TIIHLEL distribution, then the mean and the median deviations are given as
Notes
Where is simplified using the first incomplete moment
a) Renyi Entropy
Entropy plays a vital role in science, engineering, and probability theory, and has been used in various situations as a measure of variation or uncertainty of a random variable (Renyi, 1961). The Renyi entropy of TIIHLEL is given as
b) Quantile and Median
Simulation methods utilize quantile function to produce simulated random variables for classical and new continuous distributions.
The inverse of the CDF in (6) yields the quantile function of the
When p = 0.25, 0.5 and 0.75 we obtain the first quantile, median and third quartile of TIIHLEL distribution In particular is the median of the probability distribution given as
The median of TIIHLEL Distribution can be obtained by equating equation 28 to 0.5
c) Order of Statistics
Let be independently and identically distributed (i.i.d) random variable with their corresponding cumulative function (cdf) . Let be the smallest (first-order statistic) of the , is the second-order statistics greater than , and is the largest order statistics. Hence, is the order statistics corresponding to random variable (see Kapur and Sexena (1960)).
Notes
The density of the ith order statistics, for , from independent identical distribution random variable is given by
i. Order Statistic of TIIHLEL
is the beta function. The pdf of the order statistic for TIIHLEL distribution is derived by substituting (6) and (7) in (30) as follows.
Applying the binomial expansion (12) in (31), then we have
Again, using the binomial expansion (12) in the previous equation, then the pdf of the order statistic for TIIHLEE distribution is obtained as follows.
The distribution of the smallest and largest order statistics are obtained by putting r=1 and r=n in (32) respectively as follows.
However
ii. Skewness and kurtosis of the TIIHLEL distribution
Skewness is used to measure the asymmetry, and kurtosis is used to measure the peakedness of probabilistic models. Both measures are the descriptive measures of the shape of the probability distribution.
The skewness and Kurtosis of TIIHLEE are given as follows:
Notes
And
a) Maximum Likelihood Estimator (MLE) for TIIHLEL
Let be a random sample of size n from the TIIHL family of distributions . The log-likelihood function for the vector of parameters can be expressed as
The log-likelihood function is expressed as and let
Taking the first partial derivatives of of (36) with respect to and and letting them equal zero, we obtain a nonlinear system of equations.
Notes
The above-derived equations are in the complex form; therefore, the exact solution of ML estimator for unknown parameters is not possible. So it is convenient to use nonlinear Newton Raphson algorithm for exact numerically solution to maximize the above likelihood function.
However, the above equation cannot be solved analytically, and statistical software can be used to solve them numerically using iterative methods.
Solving the nonlinear system of the equation of , and we then obtain the Maximum likelihood estimate , , , and respectively. Information matrix of 4x4 will be obtained through
The solution to the above equation inverse dispersion matrix yields the asymptotic variance and covariance of the maximum likelihood estimators and
b) Confidence Interval for the Parameters
The approximate confidence intervals for for , and is given respectively by
Where the is the percentiles of the standard normal distribution.
VI. SIMULATION STUDY FOR TIIHLEL DISTRIBUTION
A simulation study was carried out to check MLE of TIIHLEL for different sample size n=10 and 100 in order to obtain Mean, Median, Standard Deviation, Skewness, and Kurtosis of the parameters. The quantile function of TIIHLEL used for simulation studies is given in (28) with , , and as shape parameters while is a scale parameter.
| α | λ | θ | β=2 | β=4 | β=6 | ||||||
| Mean | Median | SD(σ) | Mean | Median | SD(σ) | Mean | Median | SD(σ) | |||
| 0.5 | 0.5 | 0.5 | 0.4568 | 0.1146 | 1.1677 | -0.0612 | -0.0378 | 0.0769 | -0.1373 | -0.0853 | 0.1412 |
| 0.8 | 72.4466 | -0.000 | 321.5256 | 36.1165 | -0.0098 | 160.6742 | 24.006 | -0.0201 | 107.0571 | ||
| 2.5 | 3.6512 | -0.0056 | 15.774 | 1.7188 | -0.0401 | 7.7977 | -0.1627 | -0.0956 | 0.1772 | ||
| 5 | 0.0246 | -0.0332 | 0.3320 | -0.1373 | -0.0853 | 0.1412 | -0.1341 | -0.0942 | 0.1322 | ||
| 0.8 | 0.5 | -0.1341 | -0.0942 | 0.1322 | -0.1088 | -0.0976 | 0.0949 | -0.2155 | -0.1901 | 0.1574 | |
| 0.8 | 73.5713 | -0.0064 | 325.9628 | 36.6245 | -0.04936 | 162.9039 | 24.3089 | -0.0681 | 108.551 | ||
| 2.5 | 187.2195 | 0.1497 | 829.0332 | 1.6962 | -0.1042 | 7.9176 | 1.0233 | -0.1337 | 5.2270 | ||
| 5 | -0.0145 | -0.0783 | 0.3475 | -0.1684 | -0.1486 | 0.1606 | -0.2197 | -0.1763 | 0.1596 | ||
| 2.5 | 0.5 | -0.2416 | -0.2967 | 0.1691 | -0.4400 | -0.5243 | 0.1643 | -0.4400 | -0.5243 | 0.1643 | |
| 0.8 | 0.6782 | 0.2158 | 1.8055 | -0.1262 | -0.1435 | 0.1140 | -0.1810 | -0.3735 | 0.5405 | ||
| 2.5 | 0.0746 | -0.0577 | 0.5156 | -0.2693 | -0.3163 | 0.0931 | -0.3823 | -0.4944 | 0.1715 | ||
| 5 | -0.2266 | -0.2808 | 0.0830 | -0.2680 | -0.3727 | 0.2282 | -0.4827 | -0.5773 | 0.1776 | ||
| 5 | 0.5 | -0.4969 | -0.5906 | 0.1889 | -0.3401 | -0.3798 | 0.0684 | -0.5510 | -0.6165 | 0.1233 | |
| 0.8 | 0.7013 | 0.2536 | 1.9227 | -0.0302 | -0.2838 | 0.9234 | -0.2741 | -0.4728 | 0.5955 | ||
| 2.5 | 0.0424 | -0.0785 | 0.5637 | -0.3597 | -0.4515 | 0.2536 | -0.4937 | -0.5756 | 0.1713 | ||
| 5 | -0.2921 | -0.3274 | 0.0760 | -0.5270 | -0.5864 | 0.1100 | -0.6053 | -0.6763 | 0.1326 | ||
| 5 | 0.5 | 0.5 | 40.1796 | 11.4196 | 101.1856 | 20.0006 | 5.6108 | 50.5207 | 13.274 | 3.674 | 33.6324 |
| 0.8 | 3.3826 | 1.7471 | 6.8894 | 1.6021 | 0.7746 | 3.3698 | 1.0086 | 0.4504 | 2.1969 | ||
| 2.5 | 0.0964 | 0.0587 | 0.1796 | -0.0409 | -0.0597 | 0.0365 | -0.0867 | -0.1124 | 0.0623 | ||
| 5 | -0.0228 | -0.0334 | 0.0199 | -0.1006 | -0.1182 | 0.0852 | -0.1630 | -0.1448 | 0.1127 | ||
| 0.8 | 0.5 | 53.7698 | 20.9489 | 123.6435 | 26.7355 | 10.2928 | 61.7434 | 17.7240 | 6.7407 | 41.1101 | |
| 0.8 | 4.8107 | 3.2056 | 8.3631 | 4.0964 | 1.4211 | 2.2559 | 1.4043 | 0.8263 | 2.6748 | ||
| 2.5 | 0.1383 | 0.1077 | 0.2196 | -0.0802 | -0.1200 | 0.0608 | -0.1531 | -0.2063 | 0.0899 | ||
| 5 | -0.044 | -0.0671 | 0.0332 | -0.1718 | -0.217 | 0.1118 | -0.2142 | -0.2658 | 0.1455 | ||
| 2.5 | 0.5 | 77.5903 | 41.6750 | 154.4153 | -0.3633 | -0.4321 | 0.1223 | -0.2030 | -0.2482 | 0.0960 | |
| 0.8 | 7.5588 | 6.3782 | 10.3526 | 38.4897 | 20.4759 | 77.1446 | 25.4562 | 13.4095 | 51.3878 | ||
| 2.5 | 0.2047 | 0.2143 | 0.2922 | 3.4740 | 2.8275 | 5.0995 | 2.1124 | 1.6439 | 3.3496 | ||
| 5 | 0.2047 | 0.2143 | 0.2922 | -0.1159 | -0.1368 | 0.05306 | -0.3389 | -0.4053 | 0.1065 | ||
| 5 | 0.5 | -0.4458 | -0.5291 | 0.1601 | -0.1581 | -0.1632 | 0.0657 | -0.4600 | -0.5050 | 0.0834 | |
| 0.8 | 85.2087 | 48.9973 | 162.5146 | 42.2233 | 24.0734 | 81.2140 | 27.8949 | 15.7655 | 54.1138 | ||
| 2.5 | 8.4942 | 7.4992 | 10.8653 | 3.8661 | 3.3244 | 5.3776 | 2.3234 | 1.9327 | 3.5490 | ||
| 5 | 0.2146 | 0.2520 | 0.3287 | -0.2736 | -0.2952 | 0.1119 | -0.4364 | -0.4752 | 0.0812 | ||
Table 3: The Skewness and Kurtosis of TIIHLEL Distribution for
, 4 and 6 for
| α | λ | θ | β=2 | β=4 | β=6 | |||
| Skewness | Kurtosis | Skewness | Kurtosis | Skewness | Kurtosis | |||
| 0.5 | 0.5 | 0.5 | 3.5464 | 11.9068 | -0.0399 | -0.4102 | 4.1274 | 15.0420 |
| 0.8 | 4.1293 | 15.0517 | 4.1293 | 15.0518 | 4.1293 | 15.052 | ||
| 2.5 | 4.1253 | 15.0308 | 4.1273 | 15.0411 | -1.0789 | 0.2465 | ||
| 5 | 4.0212 | 14.4969 | -0.8080 | 0.5781 | -0.7710 | -0.4931 | ||
| 0.8 | 0.5 | -0.7710 | -0.4931 | 0.2994 | -0.5633 | -0.3013 | -1.3714 | |
| 0.8 | 4.1292 | 15.0514 | 4.1292 | 15.0516 | 4.1293 | 15.0517 | ||
| 2.5 | 4.1237 | 15.0220 | 4.1261 | 15.0348 | 4.1259 | 15.0341 | ||
| 5 | 3.9634 | 14.1964 | 0.4488 | -0.0229 | -0.4095 | -1.2322 | ||
| 2.5 | 0.5 | -0.0479 | -0.6149 | 1.1663 | 0.0356 | 1.1663 | 0.0356 | |
| 0.8 | 2.5930 | 4.8830 | -0.9425 | 0.7085 | 2.5043 | 4.5680 | ||
| 2.5 | 2.5668 | 4.8055 | 1.3855 | 0.5407 | 0.9324 | -0.7940 | ||
| 5 | 0.9981 | 0.4693 | 1.9109 | 2.4284 | 1.2256 | 0.1210 | ||
| 5 | 0.5 | 1.0998 | -0.0543 | 1.6549 | 1.6896 | 1.5630 | 1.1823 | |
| 0.8 | 2.5547 | 4.7666 | 2.6107 | 4.9391 | 2.5879 | 4.8580 | ||
| 2.5 | 2.4724 | 4.5225 | 2.3406 | 3.9807 | 1.5861 | 1.0848 | ||
| 5 | 1.3736 | 0.1968 | 1.6657 | 1.6172 | 1.6161 | 1.3417 | ||
| 5 | 0.5 | 0.5 | 2.6423 | 5.0353 | 2.6428 | 5.0370 | 2.6434 | 5.0387 |
| 0.8 | 2.5618 | 4.7875 | 2.5767 | 4.8328 | 2.5910 | 4.8764 | ||
| 2.5 | 2.4756 | 4.5230 | 0.3896 | -1.6530 | 0.2895 | -1.1503 | ||
| 5 | 0.3994 | -1.6633 | -0.6531 | 0.1630 | -0.8860 | 0.5991 | ||
| 0.8 | 0.5 | 2.6187 | 4.9623 | 2.6197 | 4.9656 | 2.62083 | 4.9688 | |
| 0.8 | 2.4570 | 4.4742 | 4.5589 | 2.4858 | 4.6407 | 2.5134 | ||
| 2.5 | 2.2635 | 3.9013 | 0.5666 | -1.4616 | 0.8356 | -1.0938 | ||
| 5 | -1.4278 | 0.5930 | -0.9532 | 0.3123 | -0.7628 | 0.0933 | ||
| 2.5 | 0.5 | 2.5637 | 4.7951 | 1.4043 | 0.6012 | 1.5816 | 1.0399 | |
| 0.8 | 3.7904 | 2.2164 | 38.4897 | 20.4759 | 2.5669 | 4.8047 | ||
| 2.5 | 1.5624 | 2.0875 | 2.2603 | 3.9102 | 4.0278 | 2.3027 | ||
| 5 | 2.0875 | 1.5624 | 1.6408 | 1.3026 | 1.3312 | 0.6895 | ||
| 5 | 0.5 | 1.2398 | 0.2087 | 1.7410 | 2.6698 | 2.2363 | 1.8416 | |
| 0.8 | 4.7364 | 2.5441 | 4.7402 | 2.5454 | 4.7440 | 2.5467 | ||
| 2.5 | 3.5655 | 2.1331 | 2.5454 | 4.7402 | 2.2019 | 3.7486 | ||
| 5 | 1.2211 | 1.1634 | 3.6576 | 2.1680 | 1.3464 | 0.0667 | ||
Table 4: The Mean, Median and Standard of TIIHLEL Distribution for
, 4 and 6 for
| α | λ | θ | β=2 | β=4 | β=6 | ||||||
| Mean | Median | SD(σ) | Mean | Median | SD(σ) | Mean | Median | SD(σ) | |||
| 0.5 | 0.5 | 0.5 | -0.5481 | -0.5647 | 0.0866 | -0.0599 | -0.0232 | 0.0714 | -0.1157 | -0.0426 | 0.1413 |
| 0.8 | 20.8214 | -0.0022 | 197.9756 | 10.3249 | -0.0124 | 98.9463 | 6.8260 | -0.0189 | 65.9366 | ||
| 2.5 | 1.0874 | -0.0049 | 8.6688 | 0.4579 | -0.0215 | 4.2889 | 0.2480 | -0.0272 | 2.8305 | ||
| 5 | -0.0196 | -0.0169 | 0.1671 | -0.0956 | -0.0351 | 0.1206 | -0.1209 | -0.0472 | 0.1448 | ||
| 0.8 | 0.5 | -0.1343 | -0.0476 | 0.1683 | -0.1027 | -0.0723 | 0.0855 | -0.1859 | -0.1244 | 0.1626 | |
| 0.8 | 21.2299 | -0.01517 | 200.310 | 10.4804 | -0.0548 | 100.118 | 6.8972 | -0.0717 | 66.7204 | ||
| 2.5 | 1.12112 | -0.02616 | 8.7772 | 0.4259 | -0.0764 | 4.3465 | 0.1942 | -0.0957 | 2.8718 | ||
| 5 | -0.05502 | -0.0574 | 0.1772 | -0.1620 | -0.1094 | 0.1430 | -0.1977 | -0.1274 | 0.1699 | ||
| 2.5 | 0.5 | -0.2474 | -0.2515 | 0.0827 | -0.1865 | -0.2321 | 0.2013 | -0.4139 | -0.4190 | 0.1417 | |
| 0.8 | 21.6878 | -0.0906 | 202.9944 | 10.5537 | -0.2745 | 101.4752 | 6.8423 | -0.3432 | 67.6354 | ||
| 2.5 | 1.09779 | -0.1650 | 8.9141 | 0.2586 | -0.3251 | 4.4306 | -0.0210 | -0.3913 | 2.9379 | ||
| 5 | -0.2136 | -0.1389 | 0.1920 | -0.3834 | -0.39937 | 0.1384 | -0.4491 | -0.4471 | 0.1529 | ||
| 5 | 0.5 | 10.51839 | -0.1848 | 95.5571 | -0.3265 | -0.3458 | 0.0694 | -0.5363 | -0.5473 | 0.0956 | |
| 0.8 | 21.7714 | -0.1782 | 203.6345 | 10.5126 | -0.4272 | 101.8038 | 6.7597 | -0.5033 | 67.8602 | ||
| 2.5 | 1.0558 | -0.2301 | 8.9529 | 0.1548 | -0.4592 | 4.4596 | -0.1454 | -0.5473 | 2.9627 | ||
| 5 | -0.2613 | -0.3182 | 0.2144 | -0.5036 | -0.5268 | 0.1151 | -0.5844 | -0.6068 | 0.1096 | ||
| 5 | 0.5 | 0.5 | -0.6062 | -0.6182 | 0.1136 | -0.0020 | -0.010 | 0.0850 | -0.0868 | -0.0370 | 0.099 |
| 0.8 | 2047.148 | 0.9040 | 19528.85 | 1023.488 | 0.4232 | 9764.385 | 682.2681 | 0.2629 | 6509.56 | ||
| 2.5 | 20.9390 | 0.2003 | 154.3769 | 10.3837 | 0.0714 | 77.1404 | 6.8652 | 0.0284 | 51.395 | ||
| 5 | 0.18371 | 0.0005 | 0.5985 | 0.0060 | -0.0171 | 0.2319 | -0.0531 | -0.0320 | 0.1384 | ||
| 0.8 | 0.5 | -0.1150 | -0.0439 | 0.1383 | -0.0207 | -0.0347 | 0.0920 | -0.1449 | -0.0982 | 0.1169 | |
| 0.8 | 2088.702 | 2.6374 | 19758.93 | 1044.216 | 1.2348 | 9879.42 | 696.0546 | 0.7672 | 6586.26 | ||
| 2.5 | 22.5256 | 0.5845 | 156.2336 | 11.1282 | 0.2083 | 78.0714 | 7.3291 | 0.0829 | 52.0175 | ||
| 5 | 0.2173 | 0.0014 | 0.6242 | -0.0258 | -0.0604 | 0.243 | 0.1069 | -0.0906 | 0.153 | ||
| 2.5 | 0.5 | -0.1863 | -0.1281 | 0.1593 | -0.1020 | -0.1394 | 0.1166 | -0.3412 | -0.3527 | 0.1003 | |
| 0.8 | 2143.59 | 8.8757 | 20022.4 | 1071.505 | 4.1554 | 10011.19 | -0.3020 | 0.3438 | 0.1745 | ||
| 2.5 | 25.2476 | 1.9671 | 158.325 | 12.3336 | 0.7011 | 79.1334 | 8.0289 | 0.2791 | 52.7363 | ||
| 5 | 0.2546 | 0.0049 | 0.6716 | -0.1629 | -0.2382 | 0.2800 | -0.3020 | -0.3438 | 0.1745 | ||
| 5 | 0.5 | -0.4209 | -0.4160 | 0.1352 | 0.6716 | -0.1394 | 0.1166 | -0.3412 | -0.3527 | 0.1003 | |
| 0.8 | 2143.59 | 8.8757 | 20022.43 | 1071.505 | 4.1554 | 10011.19 | 714.1431 | 2.5819 | 6674.113 | ||
| 2.5 | 25.2476 | 1.9671 | 158.325 | 12.3336 | 0.7011 | 79.1334 | 8.0289 | 0.2791 | 52.7363 | ||
| 5 | 0.25460 | 0.0049 | 0.6716 | -0.1629 | -0.2382 | 0.2800 | -0.3020 | -0.3020 | 0.1745 | ||
Table 5: The Skewness and Kurtosis of TIIHLEL Distribution for
and 6 for
| α | λ | θ | β=2 | β=4 | β=6 | |||
| Skewness | Kurtosis | Skewness | Kurtosis | Skewness | Kurtosis | |||
| 0.5 | 0.5 | 0.5 | 1.1736 | 0.7588 | -0.6676 | -0.1583 | -1.2238 | 0.2005 |
| 0.8 | 9.8457 | 94.9622 | 9.8460 | 94.9670 | 9.8464 | 94.9714 | ||
| 2.5 | 9.7617 | 93.853 | 9.7968 | 94.3173 | 9.8155 | 94.5665 | ||
| 5 | 8.9969 | 84.1612 | -0.5674 | 0.5139 | -1.1980 | 0.1487 | ||
| 0.8 | 0.5 | -1.3157 | 0.5088 | -0.1719 | -0.8034 | -0.7097 | -0.7971 | |
| 0.8 | 9.8447 | 94.9494 | 9.8451 | 94.9550 | 9.8455 | 94.9601 | ||
| 2.5 | 9.7357 | 93.5077 | 9.7761 | 94.0432 | 9.7947 | 94.2936 | ||
| 5 | 8.3285 | 75.7668 | -0.1286 | -0.2565 | -0.6729 | -0.8766 | ||
| 2.5 | 0.5 | 1.5456 | 3.8865 | 7.4744 | 64.3324 | 0.3906 | -0.8094 | |
| 0.8 | 9.8432 | 94.9296 | 9.8435 | 94.9342 | 9.8438 | 94.9384 | ||
| 2.5 | 9.6867 | 92.8574 | 9.7221 | 93.3273 | 9.7405 | 93.5753 | ||
| 5 | -0.7875 | -0.6494 | 1.6503 | 5.0171 | 0.5092 | -0.7558 | ||
| 5 | 0.5 | 9.8342 | 94.8121 | 3.5722 | 20.1740 | 0.9609 | 0.2476 | |
| 0.8 | 9.8427 | 94.9235 | 9.8429 | 94.9266 | 9.8432 | 94.9295 | ||
| 2.5 | 9.6668 | 92.5942 | 9.6934 | 92.9465 | 9.7117 | 93.1910 | ||
| 5 | 7.1334 | 59.3632 | 3.9842 | 24.2980 | 1.5016 | 2.6275 | ||
| 5 | 0.5 | 0.5 | 0.0257 | 0.8155 | 8.3230 | 74.7721 | -1.0862 | -0.1474 |
| 0.8 | 9.8463 | 94.9701 | 9.8463 | 94.9702 | 9.8463 | 94.9702 | ||
| 2.5 | 9.7379 | 93.5376 | 93.5752 | 9.74078 | 9.7435 | 93.6121 | ||
| 5 | 7.0477 | 57.7457 | 8.9977 | 83.6560 | 6.8053 | 58.3758 | ||
| 0.8 | 0.5 | -1.1905 | 0.1152 | 7.3446 | 62.3746 | -0.5338 | -1.0873 | |
| 0.8 | 9.8455 | 94.9598 | 9.8455 | 94.9598 | 9.8455 | 94.95993 | ||
| 2.5 | 9.7074 | 93.1331 | 9.7108 | 93.1786 | 9.71424 | 93.223 | ||
| 5 | 6.3999 | 49.7371 | 8.4331 | 76.2919 | 5.8779 | 47.5133 | ||
| 2.5 | 0.5 | -0.6689 | -0.8557 | 36.3640 | 5.2628 | 0.8337 | -0.2018 | |
| 0.8 | 9.844 | 94.9448 | 9.84 | 94.9448 | 0.8337 | -0.2018 | ||
| 2.5 | 9.6638 | 92.5563 | 9.6668 | 92.5952 | 9.6697 | 92.6338 | ||
| 5 | 5.3529 | 37.72 | 9.8443 | 94.9449 | 6.4528 | 52.3660 | ||
| 5 | 0.5 | 0.4957 | -0.6774 | 5.2628 | 36.3640 | 0.8337 | -0.2018 | |
| 0.8 | 9.8443 | 94.9448 | 9.8443 | 94.9448 | 9.8443 | 94.9449 | ||
| 2.5 | 92.5563 | 9.6638 | 9.6668 | 92.5952 | 9.6697 | 92.6335 | ||
| 5 | 5.3529 | 37.7232 | 6.9774 | 57.2513 | 6.4528 | 52.3660 | ||
From the above table 2, and 4 present simulation study for sample 10 and 100 respectively, this observed that the mean, standard deviation, and median are increasing, and decreasing functions of the shape parameters when the other parameters are held constant, an increase in scale parameter increases the mean, standard deviation and median for fixed , , and . Also, Table 3 and 5, Skewness, and kurtosis is an increasing function as the scale parameter increases when the shape parameters are held constant. An increase in the shape parameters reduces the values of skewness and kurtosis when the scale parameter is held constant.
VII. APPLICATIONS OF TIIHLEL DISTRIBUTION
In this section, the flexibility of the TIIHLEL Distribution is illustrated employing two (2) real data sets are demonstrated. We compare the fits of the TIIHLEL distribution with some distribution namely; Type II half Burr X (TIIHLBX), Type I half Burr X (TIHLBX), Type II half exponential (TIIHLE), Exponential distribution, Exponentiated Exponential (EE), Pareto Distribution.
The Log-likelihood (LL), Akaike Information Criterion (AIC), Bayesian Information Criterion (BIC), Anderson-Darling ( ), Cramér-von Mises ( ) and Kolmogorov-Smirnov (K-S) are computed to compare the fitted model, the smaller the value of these statistics the better the fit to the data.
| 0.080 | 0.200 | 0.400 | 0.500 | 0.510 | 0.810 | 0.900 | 1.050 | 1.190 | 1.260 | 1.350 | 1.400 | 1.460 | 1.760 |
| 2.020 | 2.020 | 2.070 | 2.09 | 2.230 | 2.260 | 2.460 | 2.540 | 2.620 | 2.640 | 2.690 | 2.690 | 2.750 | 2.830 |
| 2.870 | 3.020 | 3.25 | 3.310 | 3.360 | 3.360 | 3.480 | 3.520 | 3.570 | 3.640 | 3.700 | 3.820 | 3.880 | 4.180 |
| 4.230 | 4.260 | 4.330 | 4.340 | 4.400 | 4.500 | 4.510 | 4.870 | 4.980 | 5.060 | 5.090 | 5.170 | 5.320 | 5.320 |
| 5.340 | 5.410 | 5.410 | 5.490 | 5.620 | 5.710 | 5.850 | 6.540 | 6.760 | 6.930 | 6.94 | 6.970 | 7.090 | 7.260 |
| 7.280 | 7.320 | 7.390 | 7.590 | 7.620 | 7.630 | 7.660 | 7.870 | 7.930 | 8.260 | 8.370 | 8.530 | 8.650 | 8.660 |
| 9.020 | 9.220 | 9.470 | 9.740 | 10.06 | 10.34 | 10.66 | 10.75 | 11.25 | 11.64 | 11.79 | 11.98 | 12.02 | 12.03 |
| 12.07 | 12.63 | 13.11 | 13.29 | 13.80 | 14.24 | 14.76 | 14.77 | 14.83 | 15.96 | 16.62 | 17.14 | 18.10 | 19.13 |
| 21.73 | 22.69 | 23.63 | 25.74 | 25.82 | 26.31 | 32.15 | 34.26 | 36.66 | 43.01 | 46.12 | 79.05 |
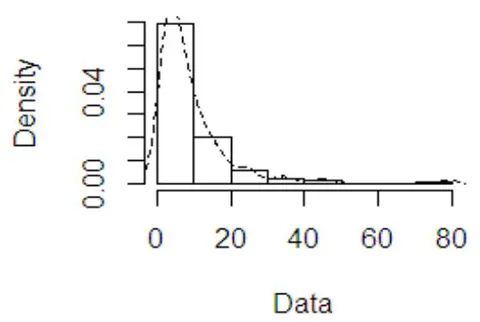
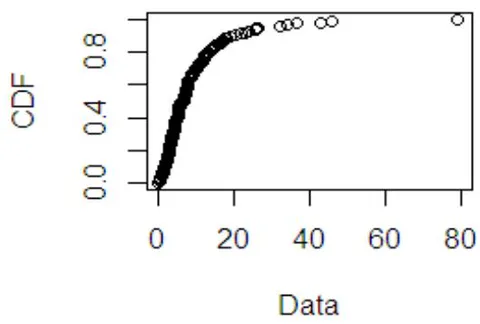
Table 8 shows the parameters estimates obtained from the proposed distribution and it sub distributions
| Min | Max | Mean | SD | Median | Q1 | Q3 | Skewness | Kurtosis |
| 0.080 | 79.050 | 9.366 | 10.5083 | 6.395 | 3.348 | 11.840 | 3.2866 | 15.4831 |
Notes
| 1.0000000 | 0.008513745 | -0.999555798 | 0.006030967 |
| 0.008513745 | 1.0000000 | 0.006280632 | -0.978044473 |
| -0.999555798 | 0.006280632 | 1.0000000 | -0.004450433 |
| -0.006030967 | -0.006030967 | -0.004450433 | 1.0000000 |
The above correlation matrix indicates the pairs which have negative and positive correlation coefficient depending on the combination of the parameters.
| Estimated Parameter | ||||
| Distributions | ||||
| TIIHLEL | 8.0874(34.3684) | 0.0161(0.0108) | 0.2017(0.8573) | 7.4603(4.2817) |
| TIIHLBX | 0.1758(0.6831) | 0.0432(0.0039) | 2.7817(10.8111) | |
| TIHLBX | 0.1758(0.6831) | 0.0432(0.0039) | 2.7817(10.8111) | |
| TIIHLE | 1.5988(0.2032) | 0.1454(0.0149) | ||
| EE | 1.2186(0.1489) | 8.2466(0.9228) | ||
| E | 6.0891(0.3999) | |||
| Distribution | AIC | BIC | LL | K-S | ||
| TIIHLEL | 828.4315 | 839.8397 | -410.2158 | 0.1971 | 0.0279 | 0.0385 |
| TIIHLBX | 847.7955 | 856.3516 | -420.8978 | 2.8260 | 0.5545 | 0.1242 |
| TIHLBX | 847.7955 | 856.3516 | -420.8978 | 45.9030 | 9.8390 | 0.5000 |
| TIIHLE | 973.9203 | 979.6243 | -484.9601 | 5.6365 | 0.9516 | 0.1365 |
| EE | 830.8943 | 835.8593 | -413.0776 | 0.7110 | 0.1272 | 0.0723 |
| E | 1023.348 | 1026.2000 | -510.6739 | 11.2831 | 1.9938 | 0.1792 |
Table 9 revealed that the TIIHLEE distribution provides a better fit to the bladder cancer patient data than other competitive models, the TIIHLE, HLEE, HLE, and the E distribution. The TIIHLEE distribution has the highest log-likelihood and the smallest K-S, W*, A*, AIC, and BIC values compared to the other models. Although the TIIHLEE distribution provides the best fit to the data and the EE distribution is alternatively good model for the data since it measures of fit value are close to that of the TIIHLEE distribution.
The estimated asymptotic variance-covariance matrix of the TIIHLEL distribution for the bladder cancer patient data is given by
Notes
However, the confidence interval at 95% for the estimate , , and are (-59.2747, 75.44947), (0.0052, 0.0379), (-1.4786, 1.8819) and (-0.9319, 11.7421) respectively. The confidence interval for the parameters contains zero. Thus, all the estimated parameters of the TIIHLEL distribution were significant at the 5% significance level
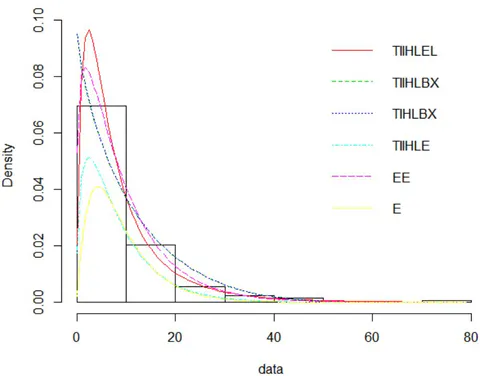
Fig 6 shows the histogram of the bladder cancer data set along with the fitted model. The theoretical density of TIIHLEL distribution has a better spread to the right than other existing models on the data set.
| 17.88 | 28.92 | 33.00 | 41.52 | 42.12 | 45.60 | 48.80 | 51.84 |
| 51.96 | 54.12 | 55.56 | 67.80 | 68.44 | 68.64 | 68.88 | 84.12 |
| 93.12 | 98.64 | 105.12 | 105.84 | 127.92 | 128.04 | 173.40 |
Table 10 Represents the number of million revolutions before failure for each of twenty-three (23) deep groove ball bearings in the life tests. The data set was given by Lawless (1982).
| Min | Max | Mean | SD | Median | Q1 | Q3 | Skewness | Kurtosis |
| 17.88 | 173.40 | 72.23 | 37.4804 | 67.8 | 47.20 | 95.88 | 0.9419 | 0.4889 |
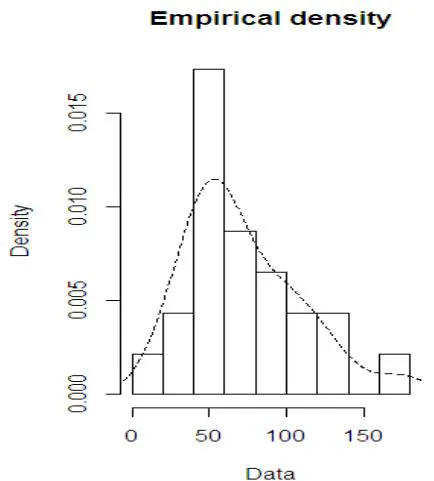
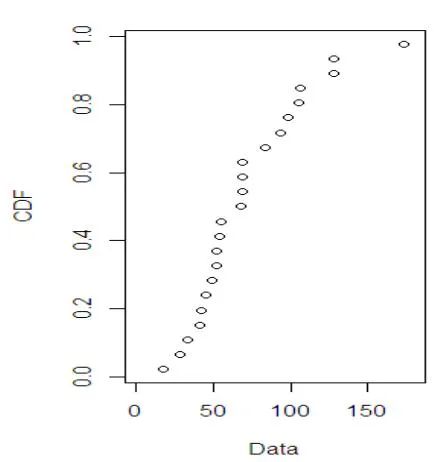
Figure 7 shows the empirical plot of data set in table 10 which is right skewed Correlation matrix of TIIHLEL Distribution
| 1.0000000 | 0.06631924 | -0.93493249 | 0.05851001 |
| 0.06631924 | 1.0000000 | 0.06631901 | -0.70226965 |
| -0.93493249 | 0.06631901 | 1.0000000 | 0.05850993 |
| 0.05851001 | -0.9368186 | 0.05850993 | 1.0000000 |
The above correlation matrix indicates the pairs which have negative and positive correlation coefficient depending on the combination of the parameters.
| Estimated Parameter | ||||
| Distributions | ||||
| TIIHLEL | 2.6919(2.9647) | 0.0056(0.0018) | 2.5214(2.7769) | 6.3149(1.8623) |
| TIIHLBX | 0.5337(3.1771) | 0.0119(0.0017) | 2.7063(16.1097) | |
| TIHLBX | 0.5337(3.1771) | 0.0119(0.0017) | 2.7063(16.1097) | |
| TIIHLE | 5.7321(2.2575) | 0.0332(0.0065) | ||
| EE | 5.2936(2.0542) | 30.9302(6.1506) | ||
| PARETO | 0.2399(0.0500) | |||
| Distribution | AIC | BIC | LL | A* | W* | K-S |
| TIIHLEL | 438.8069 | 446.2917 | -215.4034 | 0.1681 | 0.0241 | 0.0740 |
| TIIHLBX | 452.346 | 457.9596 | -223.1730 | 1.5815 | 0.2769 | 0.1572 |
| TIHLBX | 452.346 | 457.9596 | -223.1730 | 15.6856 | 3.3333 | 0.5000 |
| TIIHLE | 439.8658 | 448.6082 | -217.9329 | 0.5730 | 0.0798 | 0.0963 |
| EE | 442.8943 | 446.6367 | -219.4471 | 0.8629 | 0.1301 | 0.1169 |
| PARETO | 593.7705 | 595.6417 | -295.8853 | 16.9144 | 3.6482 | 0.5483 |
Notes
The TIIHLEL distribution provides a better fit to the data set compared to the other models. From Table 13, the TIIHLE distribution has the highest log-likelihood and the smallest K-S, W*, A*, AIC, and BIC values compared to the other fitted models.
The asymptotic variance covariance matrix for the estimated parameters is
The confidence interval at 95% for the estimate , , and are (-3.1189, 8.5028), (0.0055, 0.0167), (-2.92126, 7.9641) and (2.6648, 9.9649) respectively.. It can be observed that the confidence intervals for the parameters do not contain zero, this shows that all the parameters of the TIIHLEL distribution were significant at the 5% significance level.
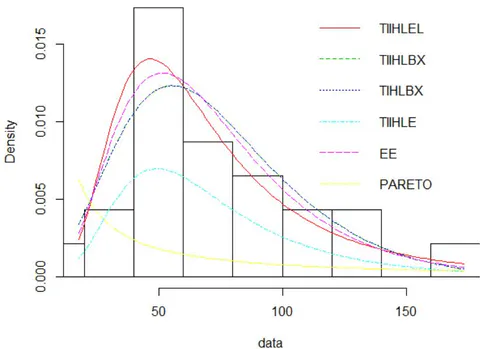
Fig 8 also shows the histogram of the Deep Groove Ball Bearings data set along with the fitted model. The theoretical density of TIIHLEL distribution has a better spread to the right than other competing models on the data set.
VIII. CONCLUSIONS
In this study, we have derived, studied the properties and applications Type II Half Logistic Exponentiated Lomax (TIIHLEL). Some structural mathematical properties; Moment Incomplete moments, Probability Weighted Moment, Order Statistic, and Rényi entropy of the derived model are investigated. A simulation study is carried out to estimate the behavior of the shape and scale model parameters. Also, maximum likelihood estimators were investigated. The application of two real-life data set shows that the TIIHLEE strong and better fit as compare to other existing distribution. However, we hope that this distribution will attract wider applications in the areas of sciences and applied sciences.