In Port Harcourt city, the design of roads do not adequately accommodate pedestrians, leading to ongoing conflicts as motorists and pedestrians try to share the limited spaces on roads. However response time to control vehicles in Port Harcourt is minimal making pedestrian crossing behavior at intersections and midblock crossings significantly more complicated. These problems created the need for additional research into pedestrian crossing behavior at crucial roads in Port Harcourt. This study’s primary goal is to discover the factors influencing pedestrian crossing behavior at signalized intersections and midblock crossings and its effect regarding road performance. Considering this reason, 520 questionnaires were developed and shared among road users (drivers and pedestrians) to determine the factors influencing pedestrian crossing behavior. Again, traffic survey was conducted using a camcorder, questionnaires were analyzed using the Likert scale to identify elements that may be critical. In addition, the level of service (LOS) was used to assess the effect on congestion.
## I. INTRODUCTION
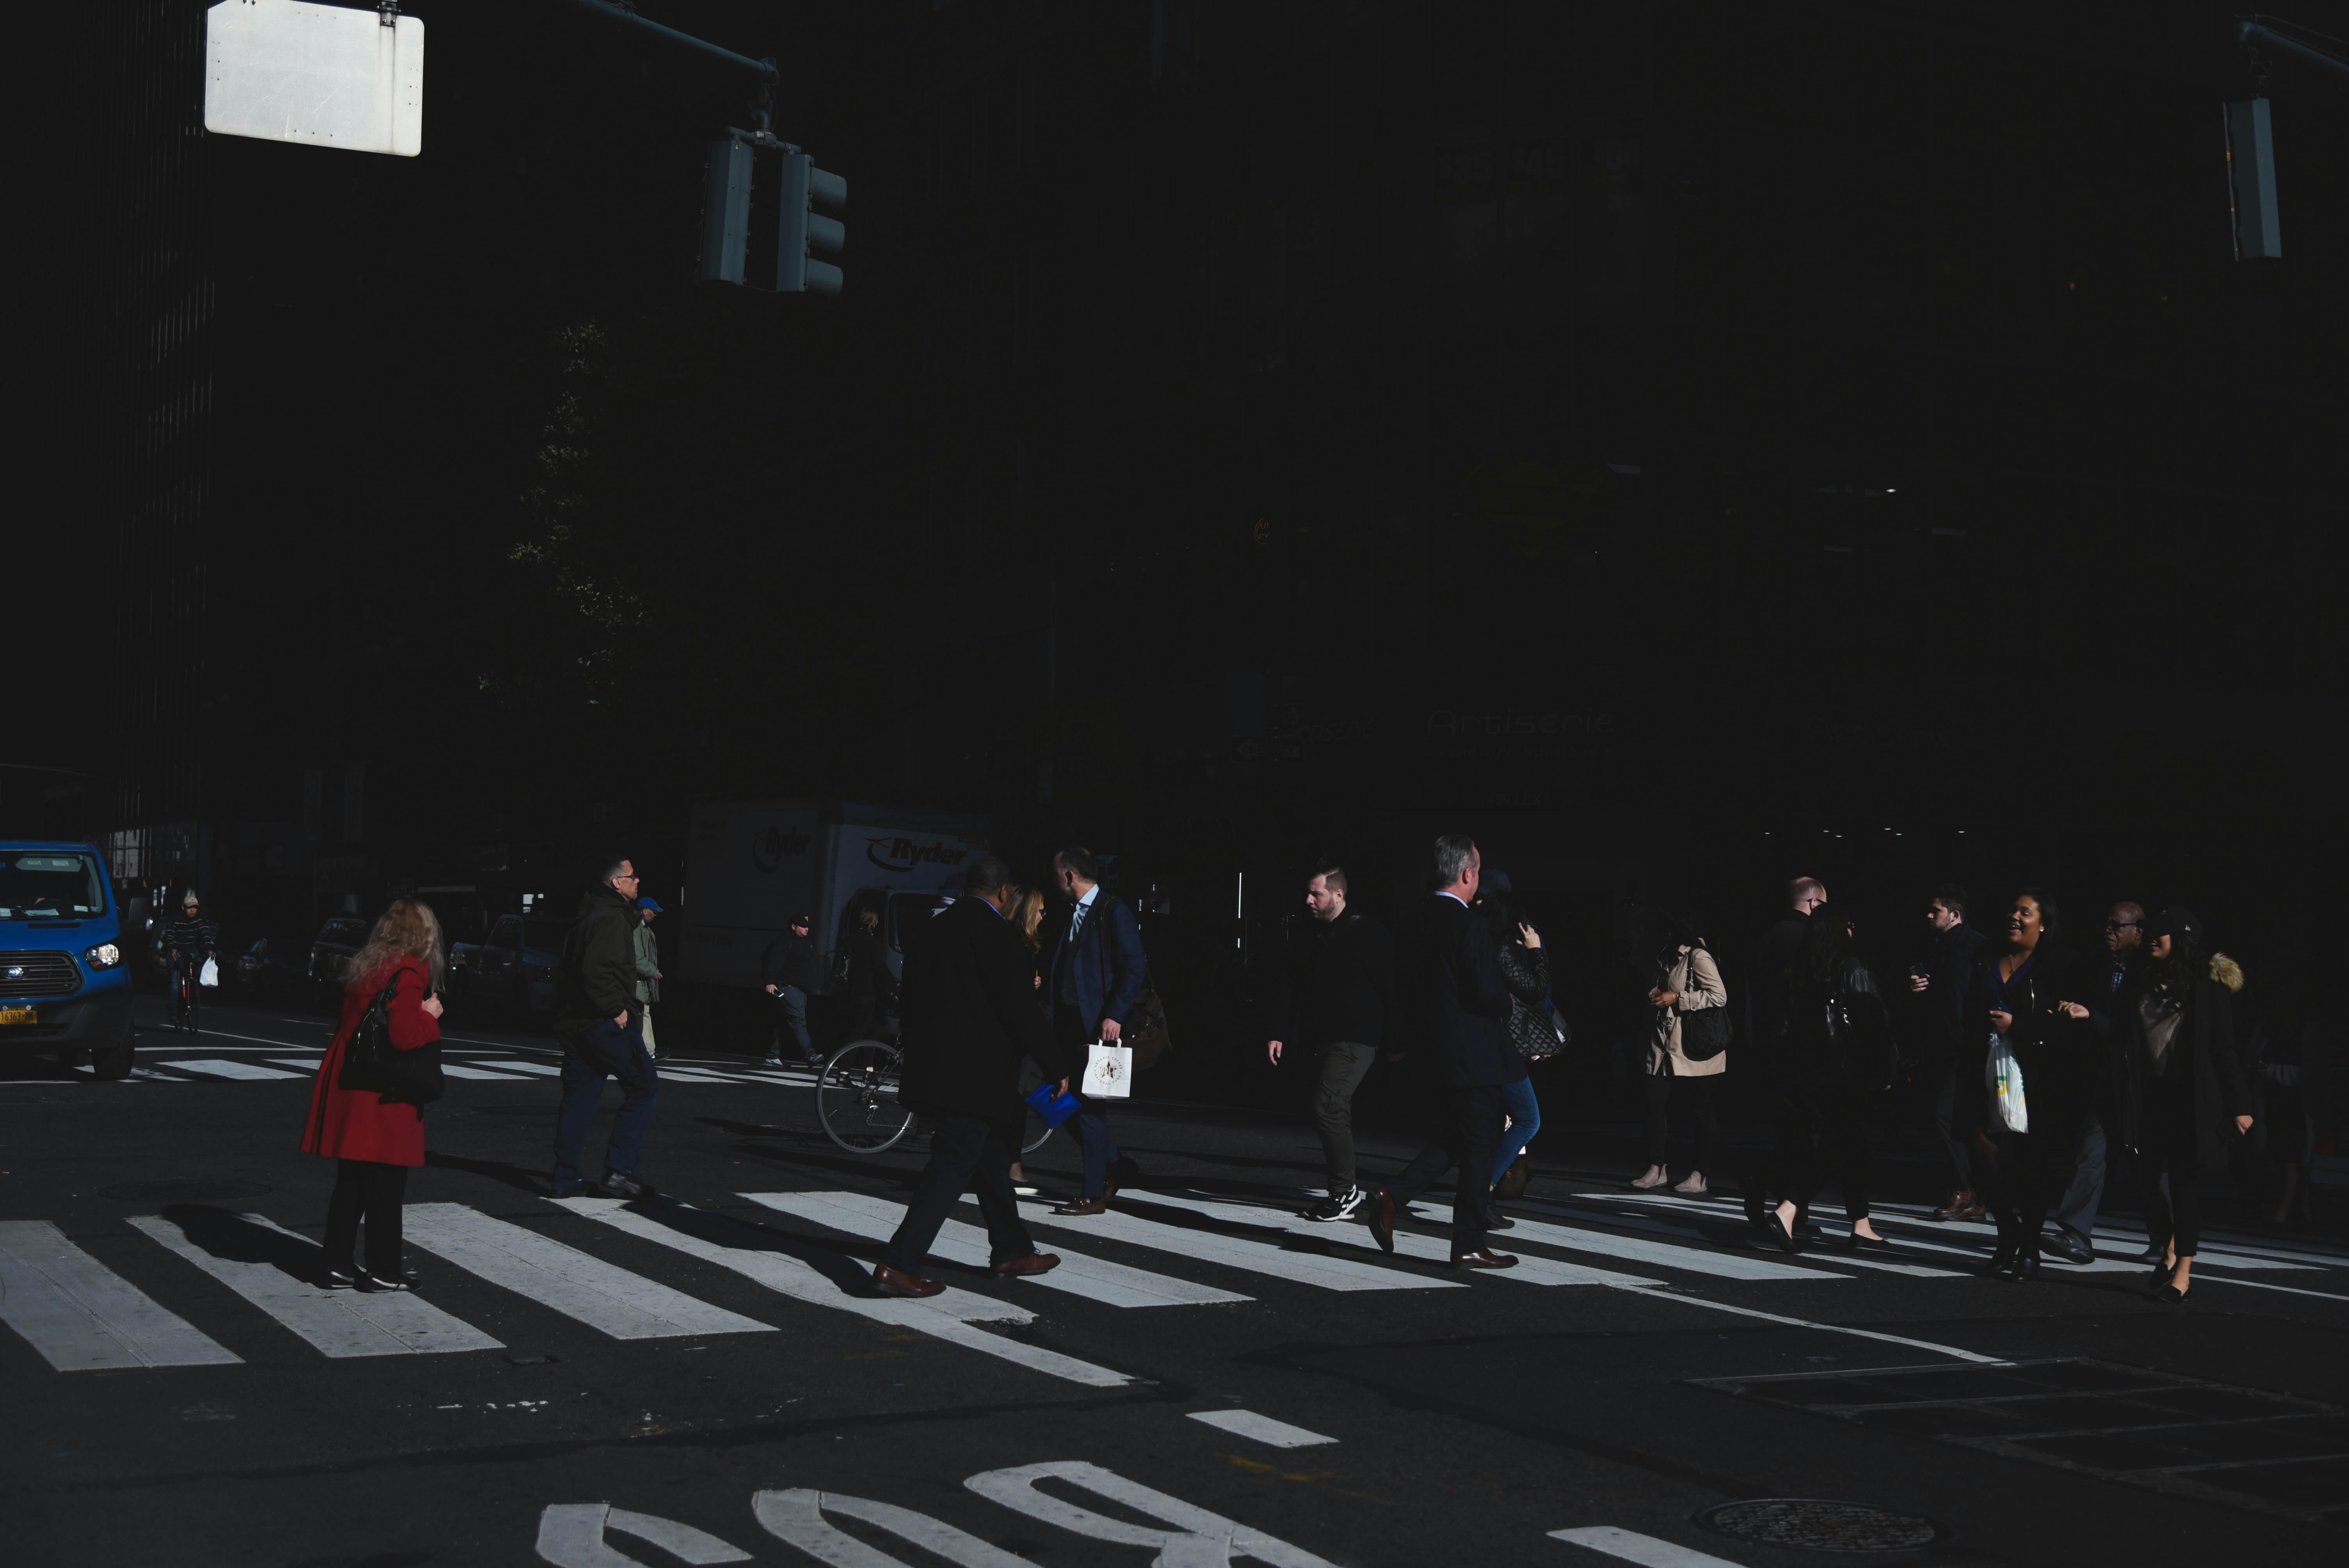
Vehicles have traditionally been the focus of traffic research on roads in developing countries. In constructing roads, considerations for pedestrian comfort, convenience, and safety are usually not given priority in Nigeria. Some difficulties experienced are modeling of pedestrian behavior in Nigeria. So many complications are involved in trying to identify the characteristics that influence pedestrian behavior. For densely populated cities like Port Harcourt, pedestrian traffic at unsignalized crossroads, signalized crossroads and midblock crossings are very common with little or no provision for safe pedestrian crossing. For some intersections crosswalks where people and cars share the same road area, signal phases have been provided to regulate this interaction in Port Harcourt, collisions between pedestrians and vehicles still happen as a result of pedestrian disobedience with traffic signals. However, pedestrian non-conformance with traffic signals causes pedestrian-vehicle interactions. Poor-quality traffic management, high traffic volume, and extended cycle times (waiting time) are some of the causes of pedestrian non-conformance with traffic signals. There are numerous other variables that influence how pedestrians' respond to signals and interactions not included in previous research.
Analyses of pedestrian behaviour have significant consequences for transportation systems, as well as for urban planning principles and methods of design (Laxman et al. 2010). Many research studies according to Laxman et al. (2010) have focused on the characteristics of pedestrians and the features of pedestrian movement in sidewalks and walkways only. A hand full of the studies have looked at the pedestrian flow characteristics at signalized crossings in order to develop pedestrian models for evaluating walking facilities. There have been few studies that looked at pedestrian disobedience at signalized crossings in order to develop pedestrian speed flow relationships (Zhou et al. (2011) and delay models (Li et al. (2013); Marisamnathan & Vedagiri (2013)). For the purpose of increasing pedestrian safety at signalized crossings, pedestrian crossing habits were investigated, and factors affecting those behaviors were found (Ren et al. 2011).
Numerous characteristics have been overlooked in previous studies on pedestrian crossing behavior which is being found in the aforementioned investigations. A study that considers effective elements like pedestrian features, behavior, and traffic characteristics has not yet been done to analyze pedestrian crossing speed variation and pedestrian-vehicle interaction in crosswalks of signalized crossings. Here in Nigeria, studies of this kind are lacking. Thus, this study seeks to identify the factors influencing pedestrian crossing behaviors in Port Harcourt through a structured questionnaire method.
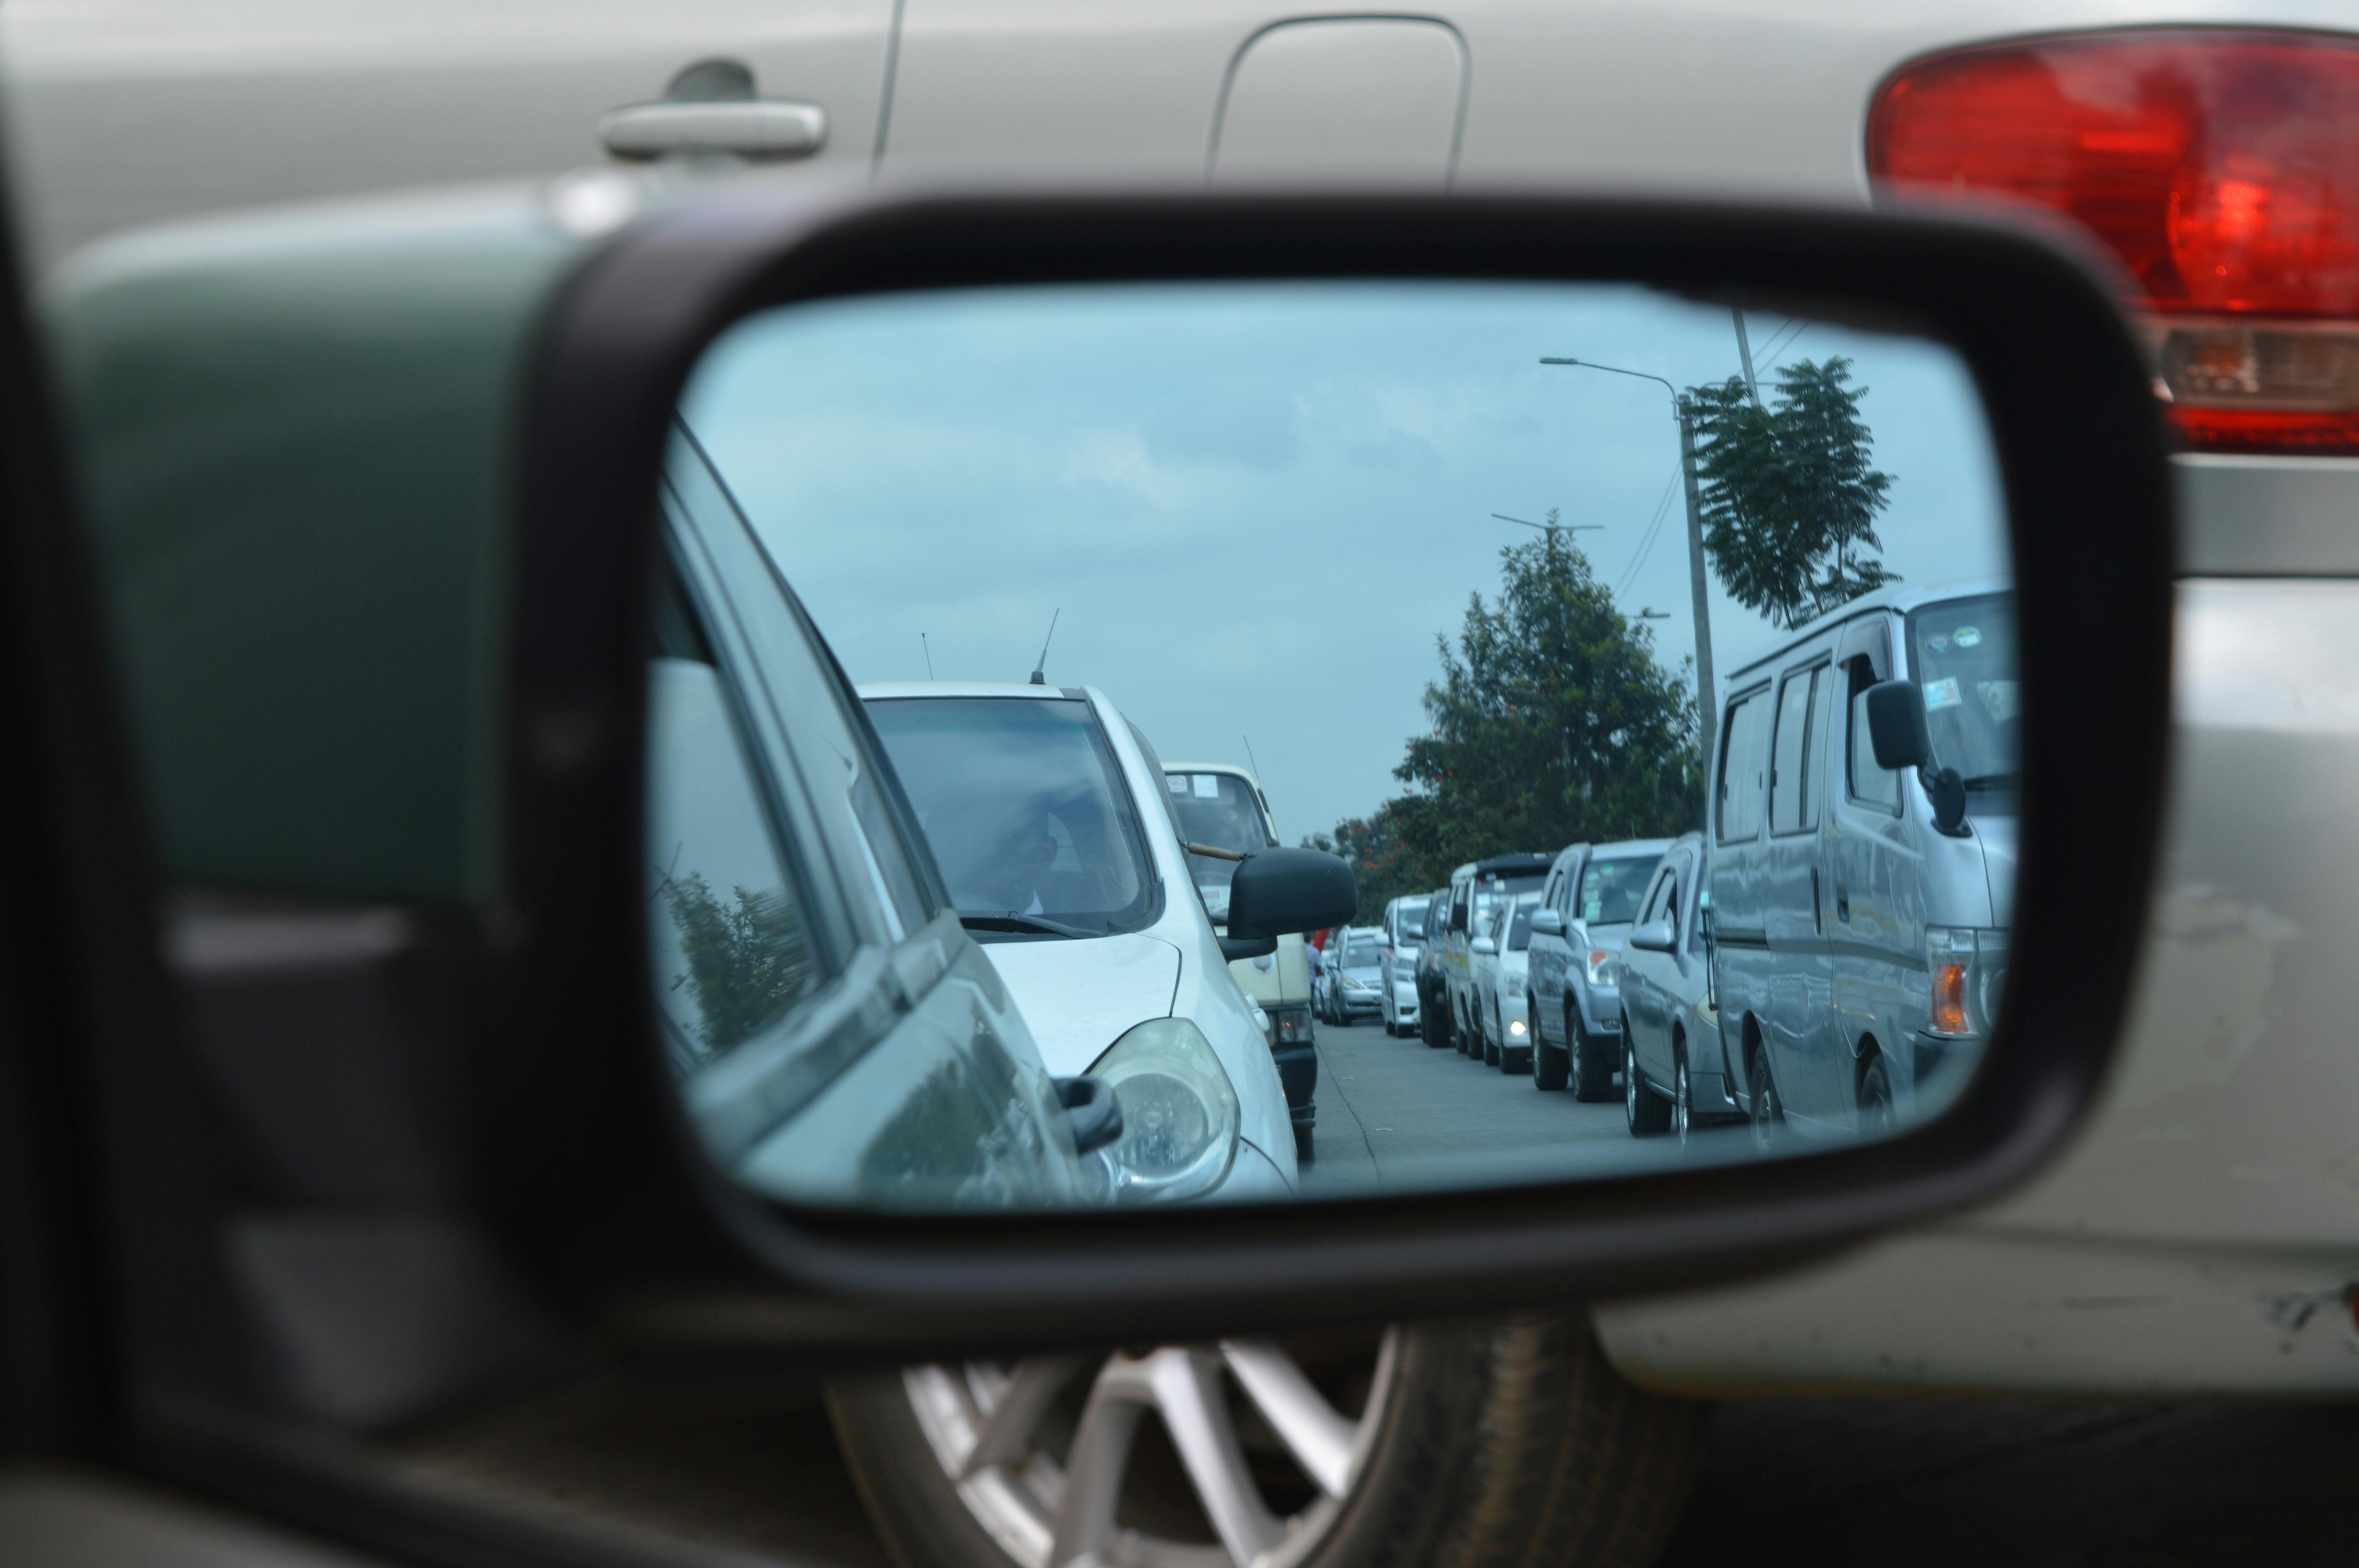
According to the WHO (2013), $22\%$ of all fatalities which results from traffic accidents involve pedestrians, with more than 270,000 fatalities annually. According to Naci et al. (2009) and ACI-ISTAT (2013), pedestrians hit by motor vehicles account for the most significant percentage of road user fatalities, while the majority of injuries take place in urban areas (Bella & Ferrante 2021). For a variety of reasons, a pedestrian might cross the street; some might be hurried and disobey the rules, which occasionally lead to traffic jams and accidents on the road. Drivers must moderate their speed to prevent accidents due to pedestrians' frequent road crossing behavior. It is well known that the driver's inability to yield to the pedestrian cause collision between pedestrians and vehicles. Lowering the vehicle's speed improves pedestrian safety. Random pedestrian crossings of the road force drivers to halt often, which congests the traffic. The effects of unrestrained pedestrian movement on road accidents have been discussed by several scholars [Bichicchi et al. (2017); Gitelman et al. (2017); Killi & Vedagiri, (2014)].
Traffic congestion has had significant negative social, economic, and environmental effects of recent. The economic effects of traffic congestion in developing nations have been the subject of numerous academic studies. Otto and Awarri (2022), Otto and Ogboda (2022), and Otto and Simon (2022) all discussed on achieving sustainability in the transportation and traffic engineering industry when discussing road traffic congestion in Port Harcourt city. A thorough analysis of the factors contributing to traffic congestion in Port Harcourt City is still lacking from the body of knowledge. This study is the first of its kind to address pedestrian crossing behavior in the city of Port Harcourt, in-order to better and more thoroughly formulate policies for a sustainable urban transportation system, this study filled a research gap by identifying the variables influencing pedestrian crossing behavior and road user safety along Port Harcourt's major roads. It also evaluated the impact of pedestrian behavior on traffic congestion along East-West Road, Port Harcourt-Aba Expressway, Ikwerri road, Ada George Road and Rumuokwuta-Choba Road since these roads are the most busiest in the city.
## II. MATERIALS AND METHOD
### a) Materials
Recording sheets, a pencil, a measuring tape, camcorder, and tripods were the materials utilized in this study.
### b) Method
In order to ascertain the pedestrian crossing behavior along these major routes, a thorough field survey was conducted. The statistics were gathered utilizing camcorder in various traffic intersections and midblock crossings over various time intervals on weekdays (7am to 9am as the morning peak hour and 5pm to 7pm as the evening peak hour). The camcorder included data on pedestrian crossing frequency, pedestrian appearance (gender and age group), pedestrian crossing behavior (walking or running), pedestrian crossing locations (using the crosswalk or not), pedestrian crossing phase time (whether pedestrians cross during green phase or not), and pedestrian-vehicle interactions in crosswalks. Also, a well-developed questionnaire was distributed to 500 road users (pedestrians) along these major roads (East-West Road, Port Harcourt-Aba Expressway, Ikwerri road, Ada George Road and Rumuokwuta-Choba Road) to ascertain the factors influencing pedestrian crossing behavior. The responses were then analyzed statistically to determine the factors that are critical using the Likert Scale.
Rensis Likert, an American psychologist, developed the Likert scale in 1932. Likert saw that there was a need to measure people's opinions concerning diverse subjects, whereas scholars in the 1930s used closed ended questions and aims to make their research valid. In order to quantify people's thoughts and attitudes, Likert created the Likert scale, a psychometric scale (Sack, 2021). The Likert scale makes the notion that attitudes or views can be measured. The five-point Likert scale, which ranges from strongly disagree to strongly agree, is the one that is most frequently used. Each response receives a score, sometimes known as a number, ranging from 1 to 5 (McLeod, 2019). For example, "Strongly Disagree" may receive a score of 1, "Disagree" could receive a 2, "Neutral/Undecided" could receive a 3, "Agree" could receive a 4, and "Strongly Agree" could receive a 5.
In this study, the Likert scale as stated above was adopted. Respondents responded to the statements/questions by indicating their opinion based on the 5-point Likert scale of strongly disagree to strongly agree. Using the logic that a mean score of 3 on the Likert scale reflects a neutral, a mean score of less than 3 represents a non-critical effect, and a mean score of greater than 3 represents a critical effect was then calculated. The Likert scale mean score has the following interpretation ranges in this study: 1.0-2.4 (not critical), 2.5-3.4 (neutral), and 3.5-5.0 (critical). The mean score was determined using Equation 1.
$$
M e a n S c o r e = \sum f _ {i} x \div \text{NumberofRespondants} 1
$$
Also, the level of service (LOS) of these roads was determined to assess the effect of pedestrian crossing behavior at midblock locations. When evaluating a transportation facility from the perspective of a traveler, LOS method is adopted. Due to its simplicity, LOS has become fairly common in practice. The volume to capacity (V/C) ratio, maximum service flow rate, vehicle speed, and other traffic parameters can all be used to determine LOS (Wang et al 2018).
The ratio of vehicles passing a point in an hour (V) to the maximum number of vehicles that can pass through that place, has been used in this study. LOS performance is assessed using the V/C ratio. The road segments where traffic mitigation measures are required can be identified by this indicator and made known to transportation operators. There are six service levels listed, and each is assigned a letter designation from A to F (Table 1) (Bhuyan & Nayak 2013). The best operational conditions are indicated by LOS A, and the worst operational conditions are indicated by LOS F. Utilizing information from the traffic volume survey, the average LOS of the road segments have been determined. The LOS of each chosen traffic segment was determined using equation 2 in order to evaluate the effects of pedestrian crossing behavior on traffic flow.
$$
L O S = \frac {V o l u m e}{C a p a c i t y} \quad 2
$$
Table 1: Level of Service Description (Zhou et al 1997)
<table><tr><td>V/C</td><td>LOS Class</td><td>Traffic State</td></tr><tr><td>0 - 0.6</td><td>A</td><td>Free flow</td></tr><tr><td>0.61 - 0.70</td><td>B</td><td>Stable traffic flow, speed is unaffected</td></tr><tr><td>0.71 - 0.80</td><td>C</td><td>Stable traffic flow, speed is affected</td></tr><tr><td>0.81 - 0.90</td><td>D</td><td>Stable flow with high vehicle density</td></tr><tr><td>0.91 - 1.0</td><td>E</td><td>Low speed</td></tr><tr><td>>1.0</td><td>F</td><td>Breakdown flow</td></tr></table>
## III. RESULTS AND DISCUSSIONS
### a) Pedestrian Crossing Statistics at Midblock Crossing
The average pedestrian crossing statistics at midblock crossing observed along the major roads considered in this study are presented in Table 2.
Table 2: Pedestrian Crossing Statistics at Midblock Crossing
<table><tr><td colspan="2">Observed Parameters</td><td>No. of Observed Pedestrians</td><td>Percentage (%)</td></tr><tr><td rowspan="3">Gender</td><td>Male</td><td>422</td><td>67</td></tr><tr><td>Female</td><td>208</td><td>33</td></tr><tr><td>Children</td><td>92</td><td>14.6</td></tr><tr><td rowspan="2">Age group</td><td>Adult</td><td>452</td><td>71.75</td></tr><tr><td>Elderly</td><td>86</td><td>13.65</td></tr><tr><td rowspan="2">Crossing type</td><td>Running</td><td>432</td><td>68.57</td></tr><tr><td>Walking</td><td>198</td><td>31.43</td></tr></table>
According to the statistics a total of 630 pedestrians were observed crossing at midblock crossings as shown in Table 2. More men (67%) than women (33%) walk during peak hours, and adult pedestrians make up the largest part (71.75%) as compared to children (14.6%) and the elderly (13.65%). This is in line with a study carried out by Olawole & Olayiwola (2018) and Marisamynathan & Perumal (2014). Also, 68.57% of pedestrians crossing at midblock prefer to run when crossing rather than walk (31.43%). This is because of the lack of crossing facilities which prompts the pedestrians to use the observed vehicle gaps as the safest time to cross. In a study carried out by Marisamynathan & Perumal (2014), 80.26% of pedestrian crossings walk because pedestrian crossing facilities are provided. From observation factors that make pedestrians to run while crossing include lack of crossing facilities, lack of road signs, improper educational awareness of road usage by drivers/pedestrians and behavior of drivers who do not consider pedestrians and other road users while driving. Also, most drivers in Nigeria are inexperienced, unqualified, and do not obey traffic/road rules. This has led to a lot of pedestrian vehicle accident which in most cases are not properly recorded in this part of the world.
### b) Pedestrian Crossing Statistics Signalized Intersections
The average pedestrian crossing statistics of 526 pedestrians at signalized intersection observed along the major roads considered in this study are presented in Table 3.
Table 3: Pedestrian Crossing Behavior at Signalized Intersections
<table><tr><td colspan="2">Observed Parameters</td><td>No. of
Observed
Pedestrians</td><td>Percentage (%)</td></tr><tr><td>Crosswalk</td><td>Yes</td><td>334</td><td>63.5</td></tr><tr><td>Utilization</td><td>No</td><td>192</td><td>36.5</td></tr><tr><td rowspan="2">Compliance</td><td>Conformance with
signal phase</td><td>385</td><td>73.19</td></tr><tr><td>Non-Conformance
with signal phase</td><td>141</td><td>26.81</td></tr></table>
The crosswalk is only used by $63.5\%$ of pedestrians, according to the research. The $73.19\%$ conformance rate for pedestrians with traffic signals shows that conformance is more common at peak hours in signalized intersections here in Port Harcourt. It is clearly seen that the conformance at signalized intersection is higher in Port Harcourt as compared to Mumbai in India according to Marisamynathan & Perumal (2014).
### c) Factors Influencing Pedestrian Crossing Behavior along Major Roads in Port Harcourt
The factors influencing pedestrian crossing behavior in Port Harcourt were identified from a questionnaire survey of road users including drivers and pedestrians. This is shown in Table 4. From the survey results, age, gender, lack of crossing facilities, use of mobile phones, location of crossing facility, educational awareness are the major factors responsible for pedestrian crossing behavior. Using the Likert scale to analyze the responses of 500 respondents, age, lack of crossing facilities, location of crossing facility, educational awareness are critical factors while gender is not critical and the use of mobile phone is neutral. This result gives a true reflection of Port Harcourt roads. Major roads in Port Harcourt do not have pedestrian crossing facilities. In some cases where pedestrian crossing facilities are available, they are located at places where crossing is highly minimal. Example of such road is the Port Harcourt-Aba Expressway. In terms of age, older people have a better crossing behavior than young people.
Table 4: Factors Influencing Pedestrian Crossing Behavior Along Major Roads in Port Harcourt
<table><tr><td rowspan="2">Statement</td><td colspan="2">Strongly Disagree (1)</td><td colspan="2">Disagree (2)</td><td colspan="2">Neutral (3)</td><td colspan="2">Agree (4)</td><td colspan="2">Strongly Agree (5)</td><td rowspan="2">Total Score</td><td rowspan="2">Mean Score</td><td rowspan="2">Remarks</td></tr><tr><td>f</td><td>%</td><td>f</td><td>%</td><td>f</td><td>%</td><td>F</td><td>%</td><td>f</td><td>%</td></tr><tr><td>Do you agree that age influences Pedestrian crossing behaviour?</td><td>30</td><td>6</td><td>42</td><td>8.4</td><td>11</td><td>2.2</td><td>166</td><td>33.2</td><td>251</td><td>50.2</td><td>2066</td><td>4.132</td><td>Critical</td></tr><tr><td>Do you agree that gender influences pedestrian crossing behaviour?</td><td>145</td><td>29</td><td>173</td><td>34.6</td><td>99</td><td>19.8</td><td>51</td><td>10.2</td><td>32</td><td>6.4</td><td>1152</td><td>2.304</td><td>Not Critical</td></tr><tr><td>Do you agree that Lack of crossing facilities influences pedestrians crossing behaviour?</td><td>21</td><td>4.2</td><td>13</td><td>2.6</td><td>31</td><td>6.2</td><td>153</td><td>30.6</td><td>282</td><td>56.4</td><td>2162</td><td>4.324</td><td>Critical</td></tr><tr><td>Do you agree that the use of mobile phones influences pedestrian crossing behaviour?</td><td>121</td><td>24.2</td><td>106</td><td>21.2</td><td>161</td><td>32.2</td><td>63</td><td>12.6</td><td>49</td><td>9.8</td><td>1313</td><td>2.626</td><td>Neutral</td></tr><tr><td>Do you agree that the location of crossing facilities influences pedestrian crossing behaviour?</td><td>9</td><td>1.8</td><td>31</td><td>6.2</td><td>61</td><td>12.2</td><td>78</td><td>15.6</td><td>321</td><td>64.2</td><td>2171</td><td>4.342</td><td>Critical</td></tr><tr><td>Do you agree that education/awareness influences pedestrian crossing behaviour?</td><td>14</td><td>2.8</td><td>41</td><td>8.2</td><td>7</td><td>1.4</td><td>150</td><td>30</td><td>288</td><td>57.6</td><td>2157</td><td>4.314</td><td>Critical</td></tr></table>
Table 5: Level of Service of Road Segments
<table><tr><td>Road</td><td>Segment</td><td>V/C</td><td>LOS</td></tr><tr><td rowspan="4">East-West Road</td><td>Rumuodara</td><td>0.90</td><td>D</td></tr><tr><td>Rumuosi</td><td>0.96</td><td>E</td></tr><tr><td>Alakahia</td><td>0.85</td><td>D</td></tr><tr><td>Choba</td><td>0.95</td><td>E</td></tr><tr><td rowspan="5">Port Harcourt-Aba Expressway</td><td>Leventis</td><td>0.88</td><td>D</td></tr><tr><td>Government Craft Centre</td><td>0.72</td><td>C</td></tr><tr><td>St Johns</td><td>0.91</td><td>E</td></tr><tr><td>Pleasure Park</td><td>0.74</td><td>C</td></tr><tr><td>Air Force</td><td>0.92</td><td>E</td></tr><tr><td rowspan="5">Ikwerre Road</td><td>Mile 3 Market</td><td>0.97</td><td>E</td></tr><tr><td>Nkpolu- Oruwurokwo</td><td>0.91</td><td>E</td></tr><tr><td>Rumueperikom/Kala</td><td>0.82</td><td>D</td></tr><tr><td>Rumueme</td><td>0.81</td><td>D</td></tr><tr><td>Rumuigbo</td><td>0.77</td><td>C</td></tr><tr><td rowspan="5">Ada George Road</td><td>Agip</td><td>0.91</td><td>E</td></tr><tr><td>Chinda</td><td>0.86</td><td>D</td></tr><tr><td>Open Door</td><td>0.84</td><td>D</td></tr><tr><td>Gateway</td><td>0.88</td><td>D</td></tr><tr><td>Okilton</td><td>0.90</td><td>D</td></tr><tr><td rowspan="4">Rumuokwuta-Choba Road</td><td>GGSS Rumuokwuta</td><td>0.96</td><td>E</td></tr><tr><td>NTA</td><td>0.91</td><td>E</td></tr><tr><td>Ozuoba</td><td>0.93</td><td>E</td></tr><tr><td>Choba</td><td>0.96</td><td>E</td></tr></table>
This study has utilized the LOS for the assessment of the impact of pedestrian crossing behavior. The LOS in Table 5 shows the V/C value of the road segments ranging from 0.72 to 0.97 which means smooth to low traffic flow with an affected speed and high vehicular density. This is a true reflection of the roads in Port Harcourt. However, at Rumuigbo, Pleasure Park and Government Craft Centre segments along Ikwerre road and Port Harcourt-Aba Expressway Road respectively, the speed are observed to be higher.
## IV. CONCLUSION
The study identified the factors affecting pedestrian crossing behavior and has used LOS to illustrate how pedestrian crossing behavior affects the traffic flow characteristics of roadways in Port Harcourt City. This study found that age, gender, lack of crossing facilities, use of mobile phones, location of crossing facility, educational awareness are the major factors responsible for pedestrian crossing behavior. It has also been determined through analysis that more people cross the street during rush hours, which causes significant traffic congestion at the selected road segments as a result of no crossing facilities especially at midblock crossings. Also, at signalized intersections, the conformance rate of $73.19\%$ shows that pedestrians here in Port Harcourt can obey traffic rules if the infrastructural systems needed are provided which is better when compared to the study of Mumbai in India according to Marisamynathan & Perumal (2014).
## V. RECOMMENDATION
The following recommendations are put forward to improve pedestrian crossing behavior and traffic flow along roadways in Port Harcourt.
i. The government should carryout a proper traffic survey along major roads in Port Harcourt and provide crossing facilities at relevant locations. ii. The government should carry out continuous educational awareness campaigns which will help road users to be acquainted with road signs, signals and regulations. This should start from the nursery school level.
iii. Data regarding road accident and pedestrian behavior are lacking in this part of the world. Hence, government should help in making such information available.
Generating HTML Viewer...
References
21 Cites in Article
Guerino Ardizzi,Alessandra Righi (2013). Uso Statistico E Previsivo Delle Transazioni Elettroniche Di Pagamento: La Collaborazione Banca D’Italia-Istat [Statistical and Forecasting Use of Electronic Payment Transactions: Collaboration between Bank of Italy and Istat].
F Bella,C Ferrante (2021). Drivers' Yielding behaviour in different pedestrian crossing configurations: a field survey.
F Bichicchi,C Mazzotta,V Lantieri,A Vignali,G Simone,M Dondi,G Costa,& Dell'acqu,Wegman (2017). The influence of pedestrian crossings features on driving behaviour and road safety.
P Bhuyan,Minakshi Nayak (2013). A Review on Level of Service Analysis of Urban Streets.
Victoria Gitelman,Roby Carmel,Etti Doveh,Shalom Hakkert (2017). Exploring safety impacts of pedestrian-crossing configurations at signalized junctions on urban roads with public transport routes.
Deepak Killi,P Vedagiri (2014). Proactive Evaluation of Traffic Safety at An Unsignalized Intersection Using Micro- Simulation.
Pengfei Li,Yang Bian,Jian Rong,Lin Zhao,Shinan Shu (2013). Pedestrian Crossing Behavior at Unsignalized Mid-block Crosswalks Around the Primary School.
S Marisamynathan,P Vedagiri (2013). Modeling Pedestrian Delay at Signalized Intersection Crosswalks Under Mixed Traffic Condition.
Marisamynathan,Vedagiri Perumal (2014). Study on pedestrian crossing behavior at signalized intersections.
S Mcleod (2019). Likert scale. Simply Psychology.
H Naci,D Chisholm,T Baker (2009). Distribution of road traffic deaths by road user group: a global comparison.
M Olawole,A Olayiwole (2018). Pedestrian Crossing Behaviour in South-Western Nigeria.
C Otto,B Simeon (2022). Capacity Assessment of Slaughter Rotary Intersection.
C Otto,A W Awarri (2022). Public Transport Sector Development in Port Harcourt, a Road Map for Reducing Traffic Congestion.
B Ifeoma,Nwanodim Lucky (2022). Design Analysis of 5G Microstrip Antenna.
Gang Ren,Zhuping Zhou,Wei Wang,Yong Zhang,Weijie Wang (2011). Crossing Behaviors of Pedestrians at Signalized Intersections: Observational Study and Survey in China.
H Sack (2020). Rensis Likert and the Likert scale method.
Chao Wang,Mohammed Quddus,Stephen Ison (2013). The effect of traffic and road characteristics on road safety: A review and future research direction.
Hiroki Saito,Funda Timurkaynak,Tcheun Borzykowski,Claire Kilpatrick,Daniela Pires,Benedetta Allegranzi,Didier Pittet (2013). “It’s in Your Hands – Prevent Sepsis in Health Care”; 5th May 2018 World Health Organization (WHO) SAVE LIVES: Clean Your Hands Campaign.
Min Zhou,Virginia Sisiopiku (1997). Relationship Between Volume-to-Capacity Ratios and Accident Rates.
No ethics committee approval was required for this article type.
Data Availability
Not applicable for this article.
How to Cite This Article
Captain Gospel Otto. 2026. \u201cUnderstanding the Factors Influencing Pedestrian Crossing Behavior and Its Effect on Road Performance in Port Harcourt City\u201d. Global Journal of Research in Engineering - E: Civil & Structural GJRE-E Volume 23 (GJRE Volume 23 Issue E2): .
Explore published articles in an immersive Augmented Reality environment. Our platform converts research papers into interactive 3D books, allowing readers to view and interact with content using AR and VR compatible devices.
Your published article is automatically converted into a realistic 3D book. Flip through pages and read research papers in a more engaging and interactive format.
In Port Harcourt city, the design of roads do not adequately accommodate pedestrians, leading to ongoing conflicts as motorists and pedestrians try to share the limited spaces on roads. However response time to control vehicles in Port Harcourt is minimal making pedestrian crossing behavior at intersections and midblock crossings significantly more complicated. These problems created the need for additional research into pedestrian crossing behavior at crucial roads in Port Harcourt. This study’s primary goal is to discover the factors influencing pedestrian crossing behavior at signalized intersections and midblock crossings and its effect regarding road performance. Considering this reason, 520 questionnaires were developed and shared among road users (drivers and pedestrians) to determine the factors influencing pedestrian crossing behavior. Again, traffic survey was conducted using a camcorder, questionnaires were analyzed using the Likert scale to identify elements that may be critical. In addition, the level of service (LOS) was used to assess the effect on congestion.
Our website is actively being updated, and changes may occur frequently. Please clear your browser cache if needed. For feedback or error reporting, please email [email protected]
Thank you for connecting with us. We will respond to you shortly.