
I. INTRODUCTION
a) Restaurant Industry Profile in Bangladesh
Bangladesh's fast-food and restaurant industries have seen substantial transformations as a result of the country's economic progress. Bangladesh's fast food and restaurant industries have grown as a result of consumerization brought about by urbanization. Although there weren't a lot of fast food chains in Dhaka even ten years ago, the city currently has thousands of small- to large-scale fast food establishments (Abir, 2019). In Bangladesh, the fast-food sector first emerged in the early 1990s. During that period, Helvetia, Western Grill, and Swiss were a few of the most well-known brands. Twenty-five years later, Dhaka alone is home to over 200 fast-food restaurants. Takeout, Mad Chef, Chef's Cuisine, Steakhouse, etc. are a few of these titles. International franchises, including KFC, Pizza Hut, Gloria Jeans, Burger King, Nando's, and Crimson Cup, have arrived in the nation due to the industry's profitability (Islam & Ullah, 2010). There are several variables that have aided in the expansion of the restaurant sector. From the standpoint of the business owner, feeding the masses with fast food, frozen food, organic food, or any other kind of food is a lucrative endeavor (The Financial Express, 2018).
b) Company Profile
Russell Weiner serves as the CEO of Domino's Pizza, Inc., a 1960-founded American international chain of pizza restaurants operating under the brand name Domino's. "To be the leader in providing off-premise pizza convenience to people throughout the globe" is Domino's Pizza's stated mission (Dominos, 2020). Domino's Pizza Bangladesh began operations at Ranges Fortune, Dhanmondi, Dhaka, on March 1, 2019 (Daily Star, 2022). Pizza from Domino's After Sbarro, Pizza Hut, and Pizza Inn, Bangladesh, is the fourth American pizza franchise to open in Bangladesh. Bangladesh presents a significant development potential for Domino, given its youthful demographics and ranking as the eighth most populated nation in the world. Many patrons of this restaurant business come with their family and friends. The impact of restaurant services on customer patronage is a recent development in this nation. Domino's Pizza Bangladesh targets university attendees, foreigners, and lower middle- and middle-class income groups. The restaurant's consumers are drawn in by its affordability (Bhasin, 2020). However, several additional aspects of services impact the patronage of the client. Customer happiness and patronage satisfaction are impacted by several factors, including the atmosphere, service contemporary equipment, staff appearance, and timely service provided by the staff (Khan & Aditi, 2020).
c) Problem Statement
As Domino's Pizza in Bangladesh is new in this country, they need to know what kinds of services are necessary to attract customers and increase patronage. There were many studies conducted after Domino's Pizza entered Bangladesh. From this study, managers can know which services are needed to increase the number of customers at this restaurant. There is very little research on the factors in services that influence customers. This study will help the managers understand the perceptions and preferences of Domino's Pizza. So, from this study, managers can develop strategies to increase and modify their services.
d) Rational of the Research
Research on the restaurant industry in Bangladesh is necessary because the entry of international restaurant chains is increasing. It helps you identify the target demographic so that you can customize the menu and services to cater to their needs. The restaurant can offer a more appealing menu and services that can lead to better customer engagement and eventually customer delight. Restaurant market research is essential for restaurant businesses and entrepreneurs to understand the latest market trends, identify consumer pain points, and target exactly what consumers are looking for. Research on the service factors that affect customer satisfaction will help Domino's Pizza Bangladesh open up new outlets in Dhaka and outside Dhaka to capitalize on the opportunities.
e) Research Objectives
The objectives of the research are
To identify the factors affecting customers satisfaction on the services of domino's pizza Bangladesh.
To identify whether prompt services attract customers to come back to the restaurants.
To identify the reasons why customers want to go to the Domino's pizza.
f) Research Questions
The research will find out the following questions
Which factors are affecting the customer satisfactions of domino's pizza Bangladesh?
Which service performance is contributing most?
Which personal characteristics affect customer satisfaction?
II. LITERATURE REVIEW
a) Customer Satisfaction
The modern consumer is intelligent since they possess a wealth of knowledge and information about various culinary trends, which has a big impact on restaurant sector marketing. Customer satisfaction with provided services may be used to forecast future patronage. If the restaurant provides high-quality services, its patrons will return (Barber et al., 2011). The importance of the restaurant's qualities as judged by the customer guides their choice to buy. The company's reputation and social aspects have the potential to impact customers' decisions (Parsa et al., 2005). While many managers concentrate on reaching basic objectives in the provision of services, it's possible that paying more attention to the specifics may increase customer satisfaction. Consumers often anticipate that service providers will be knowledgeable about their industry and honor their basic service commitments (Berry et al., 2006).
b) Factors Affecting Patronage Intention to Restaurant
Customers choose to eat out of the house for a variety of reasons. As an example, compared to those who live in rural regions, city dwellers are more likely to eat fast food (Adediran et al., 2020). Several physical and intangible aspects, like employee conduct, customer service, and convenience, might impact a restaurant's goal to attract new customers. Maziriri et al. (2020) carried out research that demonstrated the influence of look, sound, and scent on customers' opinions of quick-service restaurants and their propensity to visit them. Furthermore, there was a favorable correlation between consumer opinions of quick-service restaurants and plans to patronize them.
Vardhan (2021) conducted exploratory research to understand the tactics used by various fast-food businesses to meet the expectations of consumers in the city of Mysore. McDonald's, Kentucky Fried Chicken (KFC), Pizza Hut, Domino's Pizza, and Café Coffee Day (CCD) were the five quick service restaurants chosen from the city using a multistage random sample process. Findings showed that consumers look for concrete aspects in fast food businesses, such as how the buildings look, the staff, the equipment, and the communication materials.
Lee and Choi (2020) assessed customers' sentiments regarding the look of personnel. Furthermore, the effectiveness of these attitudes for satisfaction and desire to return was evaluated. The findings indicated that there were substantial in perceived attitudes between low and high facial attractiveness, as well as low and high uniform attractiveness. In both situations, visual pleasure affected the consumer's inclination to return. Ryu et al. (2021) used Mehrabian-Russell's theoretical framework to study how the physical environment affects staff performance, consumers' emotional states, satisfaction, and behavioural intentions in premium restaurants. The research indicated that the physical environment had a bigger influence on arousal than employee conduct, while employee behaviour had a greater impact on enjoyment. Furthermore, arousal was shown to have a favorable effect on enjoyment.
Alhelalat et al. (2017) aims to provide a more comprehensive knowledge of the ways in which restaurant staff service practices impact customer satisfaction. The results of the data analysis showed that both the functional and personal parts of service conduct might account for customer satisfaction, with the personal aspects accounting for a larger portion of the explanation than the functional ones. The elements that account for customer satisfaction in the full-service restaurant business were identified by Saad Andaleeb & Conway (2006). According to the regression model, pricing and meal quality had the greatest impact on customer satisfaction, with frontline staff attentiveness coming in second. The restaurant's outside layout and design had no appreciable impact.
By looking at the moderating effect of customers' gender in Arabic restaurants, Omar et al. (2016) seek to shed light on the relationship between service quality and customer satisfaction. They further aim to ascertain the degree to which every aspect of service quality is associated with customer happiness as assessed by consumers in Malaysia. The result
c) Measured Variables and Sources
shows that each of the five characteristics of high-quality services- tangibles, assurance, responsiveness, consistency, and empathy- has a positive correlation with customer happiness. Agnihotri et al. (2022) develop and examine a theory that offers further insight into how service recovery antecedents affect patron joy and satisfaction in the setting of quick-service restaurants (QSRs). According to the study's results, in the context of QSRs, customer happiness and joy are well-characterized by the antecedents of service recovery.
Abdullah (2022) looks at the relationship between customer loyalty, satisfaction with services, and quality of service. The findings indicate that important restaurant appearances have a long-lasting positive impact on interaction goals. Customer desire notably facilitates the link between important restaurant components and customer behavioral intentions. The association between QSR's Service Quality Dimensions-such as Employee Skills, Restaurant Ambiance, Food Quality, Restaurant Cleanliness, and Waiting Time- and Customer Online Reviews was investigated by Norazha et al. in 2022. The study found that waiting times, restaurant ambiance, and cleanliness- all of which are QSR Service Quality Dimensions- have a big impact on online customer evaluations.
| Measured Variables | Variables used in the Study | Sources (Citations) |
| 1. Modern looking | The study demonstrated that attractive food presentation, good cuisine, spatial seating arrangement, exciting interior design, nice background music, dependable service, responsive service, and skilled workers are all essential factors in diners' high satisfaction. | Are highly satisfied restaurant customers really different? A quality perception perspective (Namkung and Jang, 2008). |
| 2. Employees' appearance | The results of the research demonstrated a strong correlation between customer hospitality and the following factors: greetings, seating arrangements, food quality, menu diversity, employee behavior, and speed of service, child area, security, decoration, and reasonable pricing. Therefore, timely services and the look of the employees are two essential criteria here. | Customer Hospitality: The Case of Fast Food Industry in Bangladesh (Harun & Ahmed, 2013). |
| 3. Prompt services | ||
| 4. Charged accurately | According to the research's findings, consumer satisfaction is positively correlated with restaurant atmosphere, pricing, and service quality. | The Influence of Service Quality, Price and Environment on Customer Loyalty in the Restaurant's Industry: The Mediating Role of Customer Satisfaction (Danish Ali et al., 2021). |
| 5. Responding request | The results demonstrated that the primary determinant of customer satisfaction is the tangible proof of service quality characteristics, including concern, responsiveness, dependability, and assurances. | "The Impact of Service Quality Components on Customer Satisfaction" (Bungatang & Reynel, 2021) |
| 6. Courteous | ||
| 7. Individual attention | ||
| 8. Customer satisfaction (Dependent variable) | Food quality has been shown to have a favorable and significant impact on brand perception, customer satisfaction, and referral intention. Furthermore, research has shown that brand image and referral intention are significantly and favorably impacted by customer satisfaction. Thus, one important factor is client happiness. | The Effect of Restaurant Experience on Food Quality, Satisfaction, Recommendation Behavior, and Brand Image (Solunoğlu, 2020). |
To provide more context for this sparse literature, the current research formulates the following hypothesis:
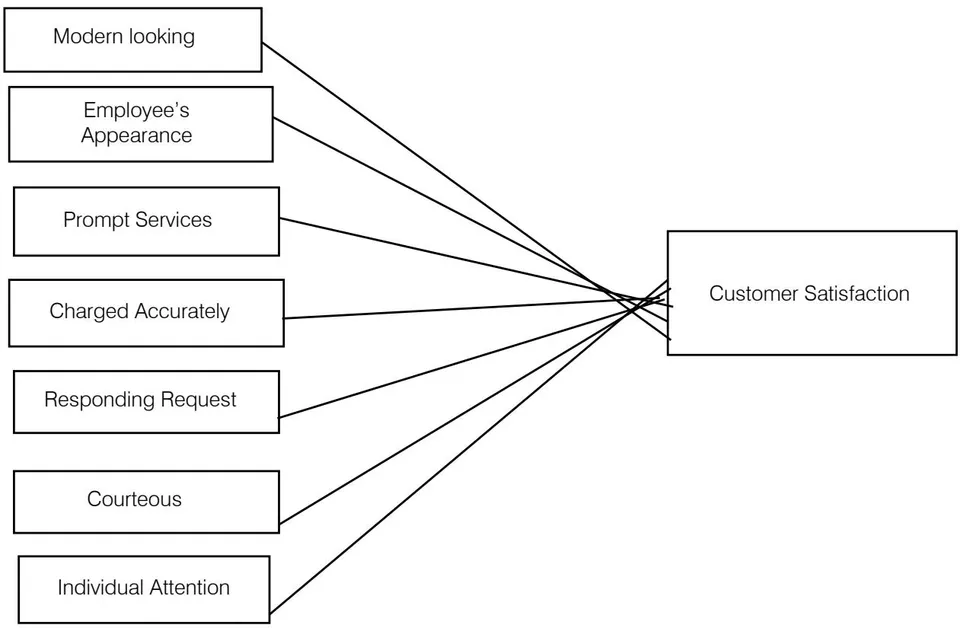
There is a relationship between service performance variables and customer satisfaction regarding Domino's Pizza Bangladesh.
d) Conceptual Framework
III. RESEARCH METHODOLOGY
a) Qualitative Versus Quantitative Research
Naresh k. Malhotra divides the primary data into qualitative and quantitative. Qualitative research provides insights and understanding of the problem settings. It is unstructured and non-statistical. Qualitative research uses exploratory research methodology based on small samples which develop initial understanding. On the other hand, quantitative research quests to quantify data and, typically apply some form of statistics analysis. Data collection is structured and it analyses data statistically. The research is quantitative.
b) Data Collection
Both primary and secondary data were used to develop a good understanding of the factors that satisfy the customers of Domino's Pizza. A questionnaire was constructed by using Google Forms in the context of Bangladesh. Data were collected from the customers who have at least gone to Domino's Pizza Bangladesh and have a good knowledge about it. The questionnaire was distributed online to different customers of the domino's pizza. Respondents were invited to fill in the questionnaire by providing their personal information and indicating their agreement level with different statements. Besides, different articles and journals that are available online have been studied to conduct the research.
c) Sampling Techniques and Sample Size
The target population is students of Dhaka University who have gone the Domino's Pizza Bangladesh. The sample size is 100. The research employed a simple random sampling method, a type of probability sampling where participants are chosen randomly from the population. Each individual within the population has an equal probability of being selected. The responses of the respondents who have experience with Domino Pizza's customer services have been given the most importance in terms of data evaluation.
d) Measurement of Variables
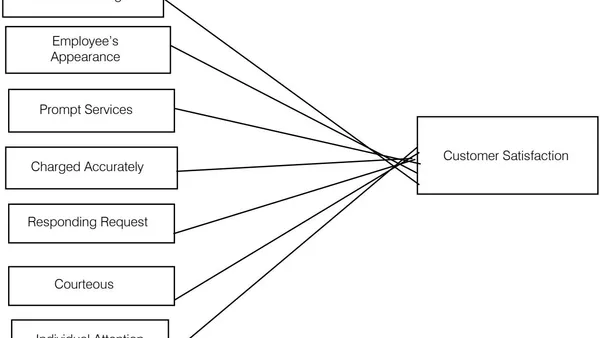
The dependent variable (customer satisfaction) and 7 independent variables (Modern looking, employee's appearance, prompt services, charged accurately, responding to requests, courteous, individual attention) were measured using a 5-point Likert scale.
IV. DATA ANALYSIS AND FINDINGS
a) Demographic Characteristics of the Respondents
Demographic Characteristics of the respondents contribute significantly toward presenting data in research. As per demographic attributes, the number of respondents is categorized into four sections including gender, age, profession, and income.
From Table 2 we can see that there are a total of 103 respondents. The researcher has collected data both from male and female where are female respondents and are male among the 103 respondents. As the target respondents mostly were young university students, most of the respondents fall in the age group 20-25 which is of the total respondents. On the other hand, of respondents are from the age group 26-30. Moreover, the age group is represented by university students. So the questionnaire was provided to the students who represent of respondents. As most of them, are students of the respondents fall in the income group 5000tk to 10000tk.
| Demographic Characteristics | Frequency | |
| Gender | Female | 51 |
| Male | 52 | |
| Total | 103 | |
| Age | 20-25 | 88 |
| 26-30 | 14 | |
| 31-35 | 1 | |
| Total | 103 | |
| Profession | Business people | 4 |
| Job holder | 7 | |
| Student | 89 | |
| Unemployed | 3 | |
| Total | 103 | |
| Income | 11000tk to 15000tk | 8 |
| 16000tk to 20000tk | 2 | |
| 21000tk to 25000tk | 3 | |
| 5000tk to 10000tk | 84 | |
| Above 25000tk | 6 | |
| Total | 103 | |
b) Descriptive Statistics
Descriptive statistics have been done with all eight variables including modern looking, employees' appearance, Prompt Services, charged accurately, responding to requests, courteous, individual attention, and satisfaction by using SPSS version 26. The mean and standard deviation have been identified. The mean represents the distribution center and the standard deviation represents how the data has been derived from the mean.
| Descriptive Statistics | |||||
| N | Minimum | Maximum | Mean | Std. Deviation | |
| Modern looking(ML) | 103 | 2 | 5 | 4.10 | .603 |
| Employees' appearance (EA) | 103 | 3 | 5 | 4.14 | .627 |
| Prompt services (PS) | 103 | 1 | 5 | 4.04 | .713 |
| charged accurately (CA) | 103 | 2 | 5 | 4.03 | .834 |
| Responding request (RQ) | 103 | 2 | 5 | 4.19 | .658 |
| Courteous (C) | 103 | 2 | 5 | 4.18 | .622 |
| Individual attention (IA) | 103 | 1 | 5 | 3.85 | .901 |
| Satisfied | 103 | 1 | 5 | 4.07 | .661 |
| Valid N (list wise) | 103 | ||||
c) Reliability Analysis
Test score reliability refers to how consistent the scores are when the test is taken multiple times, across different versions of the test, or when scored by different people. The value of alpha is reliable when it is greater than 0.60 that is alpha value . In table 4 we can see that the value of Cronbach's alpha is 0.798 which is higher. So it represents that the model is fit for the study.
| Reliability Statistics | ||
| Cronbach's Alpha | Cronbach's Alpha Based on Standardized Items | N of Items |
| .798 | .804 | 8 |
d) Test of Multicollinearity
To determine whether there is a multicollinearity problem and sampling adequacy for conducting Factor analysis the analyses of the VIF, Tolerance, condition index, and KMO and Bartlett's test of sphericity have been analyzed by using SPSS version 26.
i. Variance Inflation Factor (VIF), Tolerance and Condition Index When the Variance Inflation Factor (VIF) exceeds 10, it indicates the presence of multicollinearity. If the VIF value is less than 10, then the multicollinearity is acceptable. In Table 6, the maximum VIF value is
1.922 which is within 10 in case of response request. So the collinearity is acceptable in that case. On the other hand, if the tolerance is greater than 0.10 then the multi collinearity is acceptable. Here all the values of tolerance are greater than 0.10. Multicollinearity isn't the concern in this context.
On the other hand, if the condition index value is greater than 15 multicollinearity exists. In Table 6, only two variables have condition indexes which are less than 15, but the rest 5 variables have condition indexes which are more than 15. So here the problem of multicollinearity exists.
| Variables | Tolerance | VIF | Condition Index |
| Modern looking | .796 | 1.257 | 1.000 |
| Employees' appearance | .869 | 1.150 | 14.645 |
| Prompt services. | .601 | 1.663 | 15.400 |
| Charged accurately | .822 | 1.216 | 19.994 |
| Respond request. | .520 | 1.922 | 21.968 |
| Courteous | .645 | 1.551 | 23.696 |
| Individual attention. | .681 | 1.468 | 27.523 |
ii. KMO and Bartlett's Test
The KMO statistic measures the suitability of data for conducting factor analysis with the sampling adequacy for each variable in the model and for the complete model. In table 7, the KMO value is 0.80 which is greater than.60, implying that there is the presence of multicollinearity. Bartlett's Test of Sphericity dismisses the notion that the population correlation matrix conforms to an identity matrix. The approximate chi-square statistic is 156.202 with 21 degrees of freedom, which is highly significant . So, it can be said that there exists multicollinearity, and undertaking factor analysis is appropriate.
| Kaiser-Meyer-Olkin Measure of Sampling Adequacy. | .800 | |
| Bartlett's Test of Sphericity | Approx. Chi-Square | 156.202 |
| df | 21 | |
| Sig. | .000 | |
e) Factor Analysis
To determine the minimum and appropriate number of factors for using them as predictors in the regression analysis, the method of Principal Component
Principal Component Analysis (PCA) is utilized following the orthogonal varimax procedure in this study. The PCA extracts factors based on the information contained in the original variables to explain the total variance in the data.
i.e. the primary factor accounts for the majority of the overall variance, followed by the second factor which captures a significant portion of the remaining variance, and this pattern continues for subsequent factors... Now it is necessary to determine the appropriate number of extracted factors and interpret them.
i. Determination of Appropriate Number of Factors
The appropriate number of factors is determined based on three approaches: eigenvalue criteria, amount of total variance explained, and scree plot.
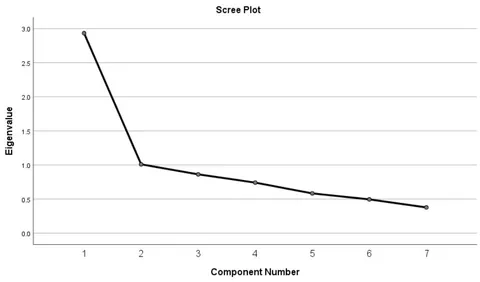
If the eigenvalue is greater than 1 then it is acceptable to be included in the number of factors. In table 8 we can see that 2 factors have eigenvalues of more than 1. In Figure 2 the scree plot also suggested that two factors are appropriate.
| Factor | Eigenvalues | % of Variance | Cumulative% |
| 1 | 2.208 | 31.548 | 31.548 |
| 2 | 1.733 | 24.762 | 56.309 |
ii. Interpretation of the Factors
In this study, orthogonal rotation with the varimax procedure has been utilized to transform the complex factor matrix into a simpler one, which facilitates easy interpretation of the factors and uses them in subsequent regression analysis as they are uncorrelated. So in Table 9, the first factor can be named Service Performance, which is associated with five variables which are prompt services, charged accurately, respond request, courteous, and individual attention. The second factor can be named as Visual Appearance which consists of two factors such as modern looking and employees' appearance.
| variables | Factor | |
| Factor 1(Service Performance) | Factor2(Visual Appearance) | |
| Modern Looking | .773 | |
| Employees' appearance | .696 | |
| Prompt services. | .546 | |
| Charged accurately | .637 | |
| Respond request. | .560 | .596 |
| Courteous | .818 | |
| Individual attention. | .717 | |
f) Multiple Regression Analysis
Given that the extracted two factors are appropriate following the factor analysis in the foregoing, the regression model can be specified as:
Where,
Satisfied with the services
i. Model Summary
The summary of the estimation of the regression model is presented in Table 10. It shows that the value of R square is.457 which is highly significant , indicating that the predictors explain of the variability in the dependent variable. The value of R is.676 which indicates there are other factors that could be considered in the study.
| Model | R | R Square | Adjusted R Square | Std. Error of the Estimate | Durbin-Watson | Sig. |
| 1 | .676a | .457 | .447 | .491 | 1.579 | .000 |
| a. Predictors: (Constant), Visual Appearance, Service Performance | ||||||
| b. Dependent Variable: Overall you are satisfied with the services of Domino's Pizza Bangladesh. | ||||||
ii. Multiple Regression Coefficient
In Table 10, particularly in terms of standardized coefficients, it appears that Service Performance is highly significant (p =.000) Visual Appearance is not significant.
| Model | Unstandardized Coefficients | Standardized Coefficients | t | Sig. | ||
| b | Std. Error | B | ||||
| 1 | (Constant) | .341 | .471 | .725 | .470 | |
| Service Performance | .786 | .101 | .631 | 7.801 | .000 | |
| Visual Appearance | .130 | .110 | .096 | 1.183 | .240 | |
| a. Dependent Variable: Overall you are satisfied with the services of Domino's Pizza Bangladesh. | ||||||
V. RECOMMENDATIONS AND CONCLUSIONS
a) Limitations and Recommendation
The research has been done on the service factors to predict patronage intention. But there are other factors such as cultural and ethical settings to be considered. The role of moderating factors such as customer attitude and satisfaction can also be examined. Structural equation modeling can be used to examine the structural relationships of the variables.
Beyond these selected factors other factors are contributing to the satisfaction and dissatisfaction toward Domino's Pizza Bangladesh. So future researchers can identify those factors such as emotional and functional reasons.
In this digital area, social networks are affecting customers and millennials to follow the trends. When they see themselves on online and social media their surroundings and friends are going to Domino's Pizza for their social esteem. Then the millennials were influenced by them and went to the restaurant to socialize and take experiences. So future researchers can identify how social media is influencing the millennials to go to Domino's Pizza Bangladesh. The researcher can also research to see whether Domino's
Pizza Bangladesh will be acceptable in the other districts in the country especially in Chittagong, Sylhet, etc.
b) Conclusion
The findings of this research offer both theoretical and practical insights into what influences consumers to return and how satisfied they are with the quality of service provided. It is interesting thing find that there are no differences in case demographic factors such as gender. Both males and females are going to Domino's Pizza Bangladesh. The researcher also identified that service performance such as prompt services, Charge accuracy, responding to requests, Courteousness, and individual attention are important factors which are influence customer satisfaction with Domino's Pizza Bangladesh. So for expanding this restaurant chain the managers of Domino's Pizza Bangladesh can take necessary strategies to capitalize on the opportunities.
- Abdullah, O. (2022). Service Quality and its Influence on Customer Satisfaction and Customer
- Loyalty in the Restaurants of Five-Star Hotels. Tourism and Leisure, 11.
Abir, M. R. (2019). An Overview of the Restaurant Industry in Bangladesh. The Strategy Watch.
Adediran, D. O. J., Alabi, R. A., & Bashiru, A. A. (n.d.). Factors Influencing Patronage and Effectiveness of Consumers' Demographic Attributes On Preference for Foodservice Outlets in Ilorin, Kwara State.
Agnihotri, D., Kulshreshtha, K., Tripathi, V., & Chaturvedi, P. (2022). "Actions speak louder than words": an impact of service recovery antecedents on customer delight in quick-service restaurants. Asia-Pacific Journal of Business Administration, 14 (4), 421-444.
Alhelalat, J. A., Habiballah, M. A., & Twaissi, N. M. (2017). The impact of personal and functional aspects of restaurant employee service behaviour on customer satisfaction. International Journal of Hospitality Management, 66, 46-53. https://doi.org/10.1016/j.ijhm.2017.07.001
Barber, N., Goodman, R. J., & Goh, B. K. (2011). Restaurant consumers repeat patronage: A service quality concern. International Journal of Hospitality Management, 30 (2), 329-336. https://doi.org/10.1016/j.ijhm.2010.08.008
Berry, L. L., Wall, E. A., & Carbone, L. P. (2006). Service Clues and Customer Assessment of the Service Experience: Lessons from Marketing. Academy of Management Perspectives, 20 (2), 43-57. https://doi.org/10.5465/amp.2006.20591004
Bungatang, B., &Reynel, R. (2021). The Effect of Service Quality Elements on Customer Satisfaction. Golden Ratio of Marketing and Applied Psychology of Business, 1(2), 107-118. https://doi.org/10.52970/grmapb.v1i2.102
Daily star. (2022). Domino's Pizza Now in Bangladesh. Dhaka: Dailystar.
Danish Ali, Mohammad Alam, & Hazrat Bilal. (2021). The Influence of Service Quality, Price, and Environment on Customer Loyalty in the Restaurant's Industry: The Mediating Role of Customer Satisfaction. Journal of Accounting and Finance in Emerging Economies, 7 (1), 143-154. https://doi.org/10.26710/jafee.v7i1.1587
Dominos. (2020). Dominos mission and vison statements analysis. Retrieved from Staement dominos:https://missionstatement.com/dominos/#: ~:text=All%20in%20all%2C%20the%20company, the%20leading%20pizza%20providers%20globally.
Financial Express Online Report (2018). Hotel and restaurant sector set to post higher growth.
Harun, A., & Ahmed, F. (n. d.). Customer Hospitality: The Case of Fast Food Industry in Bangladesh.
Islam, N., & Ullah, G. M. (2010). Factors Affecting Consumers' Preferences on Fast Food Items in